| Param | Original file | Final file |
|---|---|---|
| Filename | modeM0/AS1A10_058T13_9000004088_28419cztM0_level2.evt | modeM0/AS1A10_058T13_9000004088_28419cztM0_level2_quad_clean.evt |
| Size (bytes) | 636,514,560 | 74,724,480 |
| Size | 607.0 MB | 71.3 MB |
| Events in quadrant A | 3,622,097 | 454,179 |
| Events in quadrant B | 3,875,553 | 460,197 |
| Events in quadrant C | 3,658,944 | 442,873 |
| Events in quadrant D | 7,612,574 | 383,444 |
| Mode M0 | |||
|---|---|---|---|
| Quadrant | BADHDUFLAG | Total packets | Discarded packets |
| A | 0 | 15680 | 0 |
| B | 0 | 16220 | 0 |
| C | 0 | 15610 | 0 |
| D | 0 | 27647 | 0 |
| Mode M9 | |||
|---|---|---|---|
| Quadrant | BADHDUFLAG | Total packets | Discarded packets |
| A | 0 | 2 | 0 |
| B | 0 | 2 | 0 |
| C | 0 | 2 | 0 |
| D | 0 | 2 | 0 |
| Quadrant | Total seconds | Saturated seconds | Saturation percentage |
|---|---|---|---|
| A | 7493 | 124 | 1.654878% |
| B | 7493 | 185 | 2.468971% |
| C | 7493 | 173 | 2.308822% |
| D | 7493 | 1007 | 13.439210% |
Noise dominated data is calculated using 1-second bins in cleaned event files. If a bin has >2000 counts, and if more than 50% of those come from <1% of pixels, then it is considered to be noise-dominated and hence unusable.
| Quadrant | # 1 sec bins | Bins with >0 counts | Bins with >2000 counts | High rate bins dominated by noise | Noise dominated (total time) | Noise dominated (detector-on time) | Marked lightcurve |
|---|---|---|---|---|---|---|---|
| A | 7633 | 7493 | 6 | 6 | 0.08% | 0.08% | 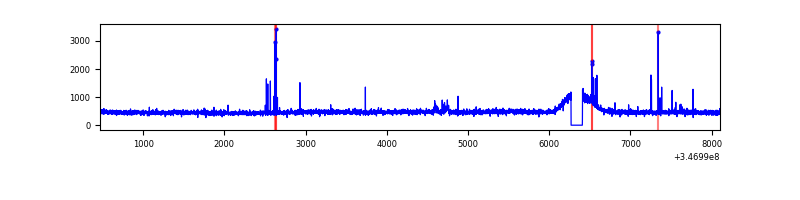 |
| B | 7633 | 7494 | 18 | 18 | 0.24% | 0.24% | 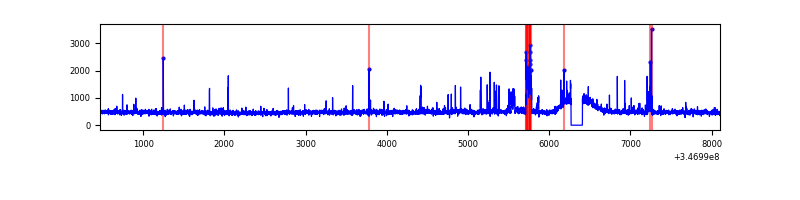 |
| C | 7633 | 7494 | 1 | 1 | 0.01% | 0.01% | 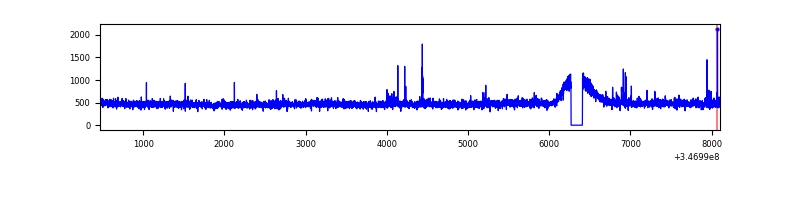 |
| D | 7633 | 7494 | 915 | 915 | 11.99% | 12.21% | 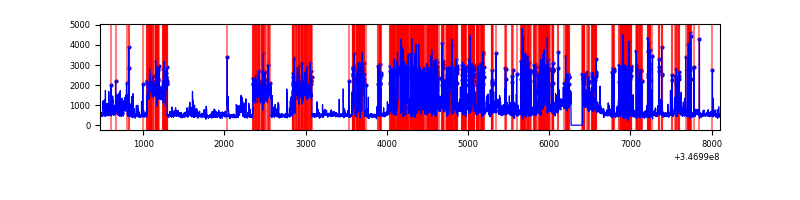 |
Top three noisy pixels from each quadrant. If the there are fewer than three noisy pixels in the level2.evt file, extra rows are filled as -1
| Pixel properties | Quadrant properties | ||||||
|---|---|---|---|---|---|---|---|
| Quadrant | DetID | PixID | Counts | Sigma | Mean | Median | Sigma |
| A | 6 | 16 | 25857 | 132.9 | 922 | 902 | 187.8 |
| A | 12 | 96 | 22727 | 116.23 | 922 | 902 | 187.8 |
| A | 15 | 174 | 17327 | 87.47 | 922 | 902 | 187.8 |
| B | 10 | 245 | 243319 | 1343.86 | 919 | 894 | 180.4 |
| B | 12 | 111 | 22426 | 119.36 | 919 | 894 | 180.4 |
| B | 11 | 111 | 20539 | 108.9 | 919 | 894 | 180.4 |
| C | 14 | 238 | 140681 | 659.67 | 887 | 892 | 211.9 |
| C | 7 | 220 | 53312 | 247.37 | 887 | 892 | 211.9 |
| C | 13 | 61 | 6101 | 24.58 | 887 | 892 | 211.9 |
| D | 1 | 52 | 3022339 | 15022.81 | 837 | 814 | 201.1 |
| D | 8 | 195 | 1202254 | 5973.47 | 837 | 814 | 201.1 |
| D | 2 | 250 | 112093 | 553.27 | 837 | 814 | 201.1 |
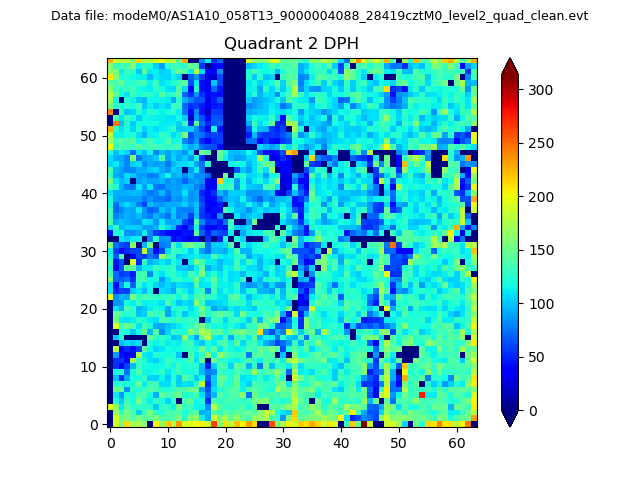
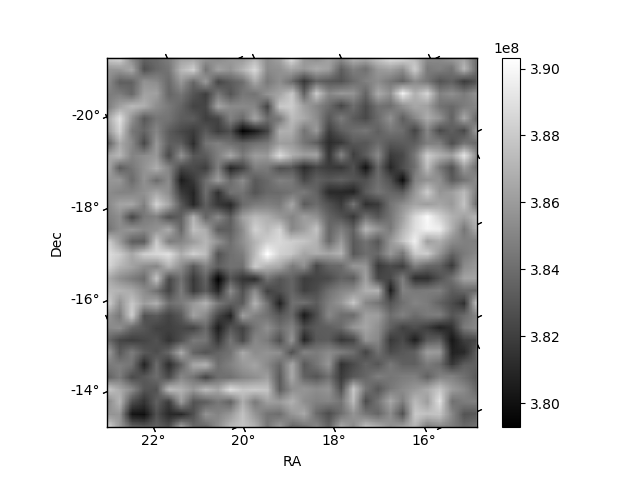
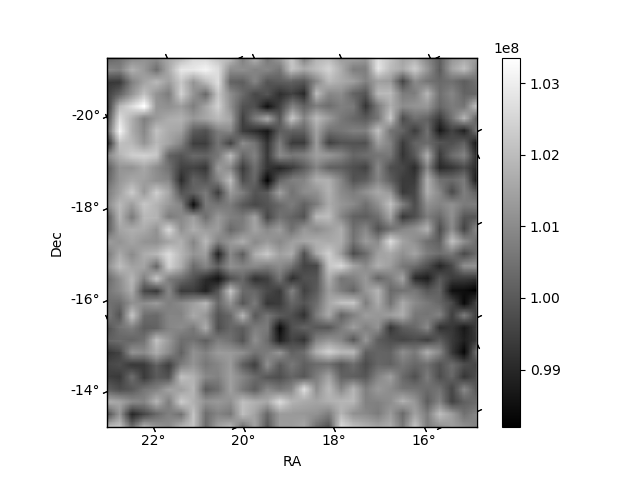
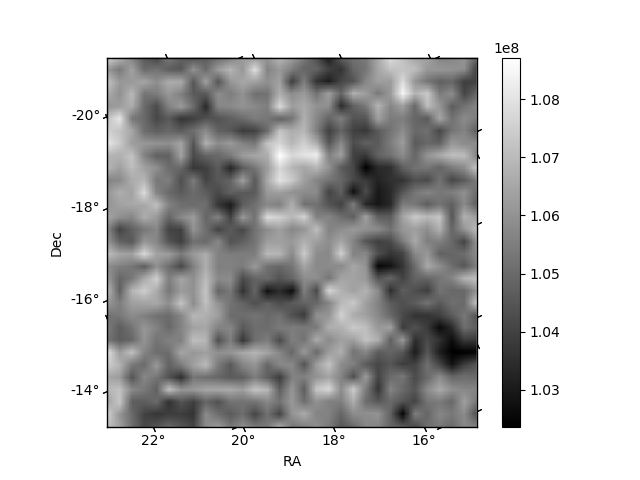
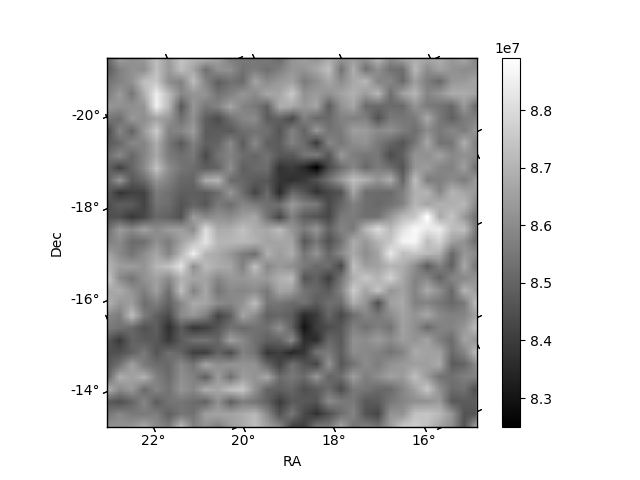
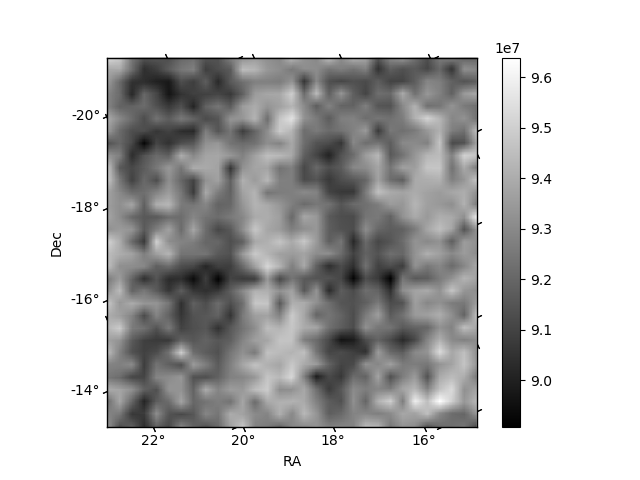
Histogram calculated using DETX and DETY for each event in the final _common_clean file
| Quadrant A | 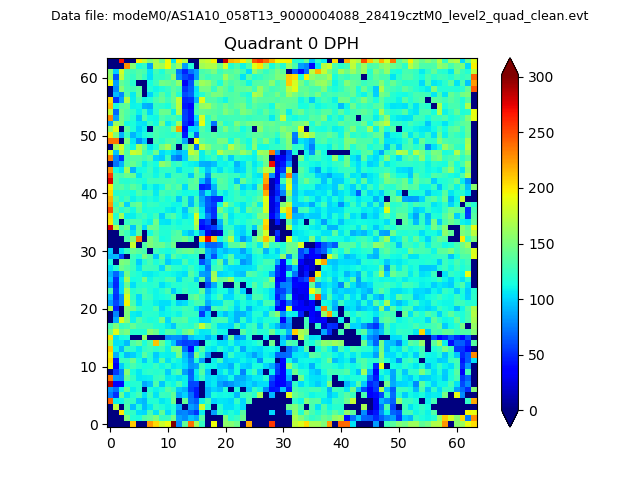 |
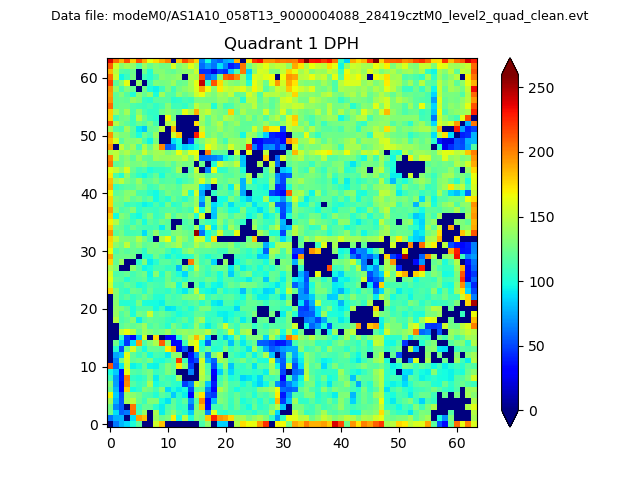 |
Quadrant B |
|---|---|---|---|
| Quadrant D | 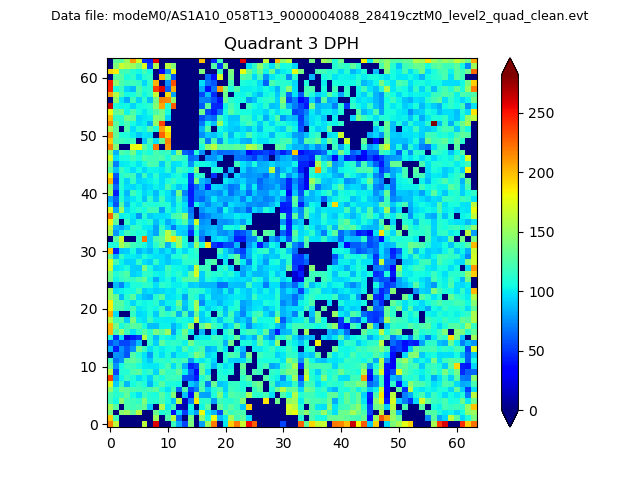 |
 |
Quadrant C |
| Plot type | Count rate plots | Images |
|---|---|---|
| Comparison with Poisson distribution Blue bars denote a histogram of data divided into 1 sec bins. Red curve is a Poisson curve with rate = median count rate of data. |
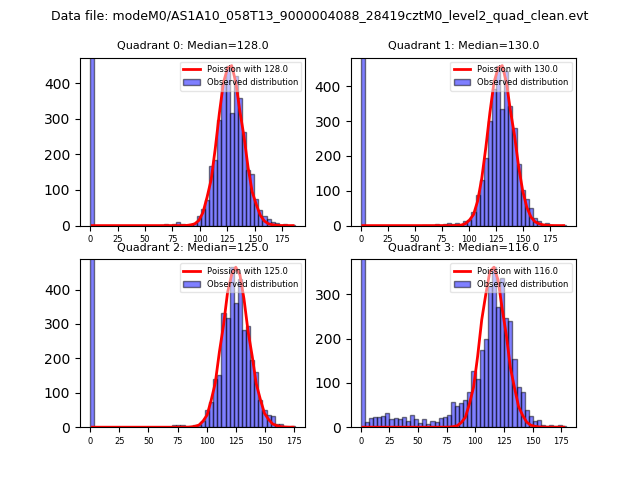 |
 |
| Quadrant-wise count rates Data is divided into 100 sec bins |
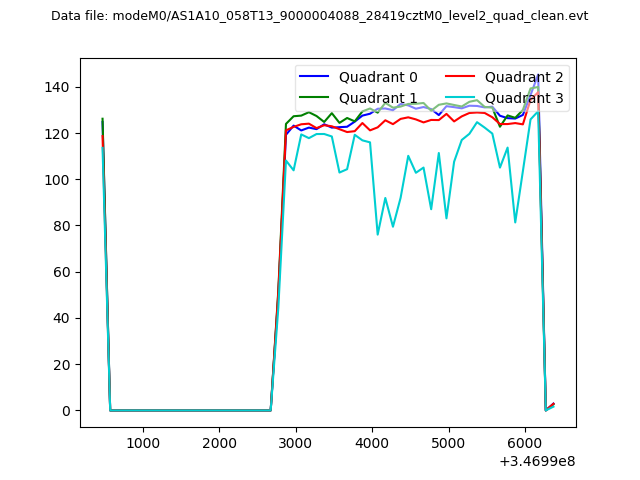 |
|
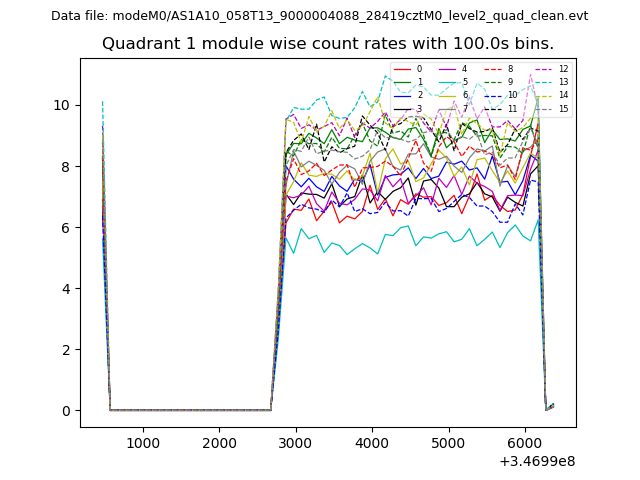
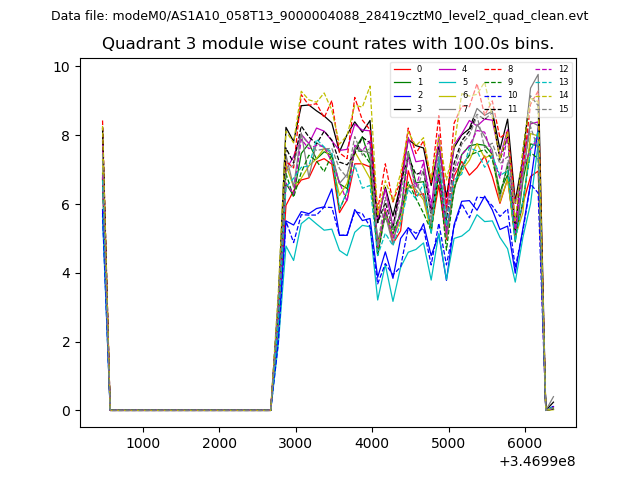
| Module-wise count rates for Quadrant A Data is divided into 100 sec bins |
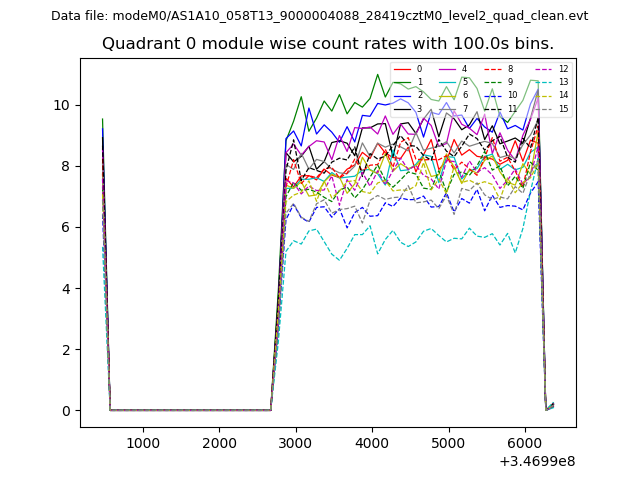 |
 |
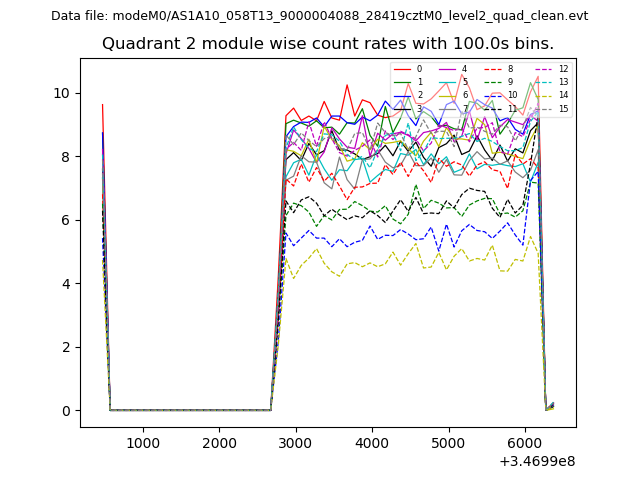
| Module-wise count rates for Quadrant B Data is divided into 100 sec bins |
 |
 |
| Module-wise count rates for Quadrant C Data is divided into 100 sec bins |
 |
 |
| Module-wise count rates for Quadrant D Data is divided into 100 sec bins |
 |
 |
| Parameter | Plot |
|---|---|
| CZT HV Monitor | 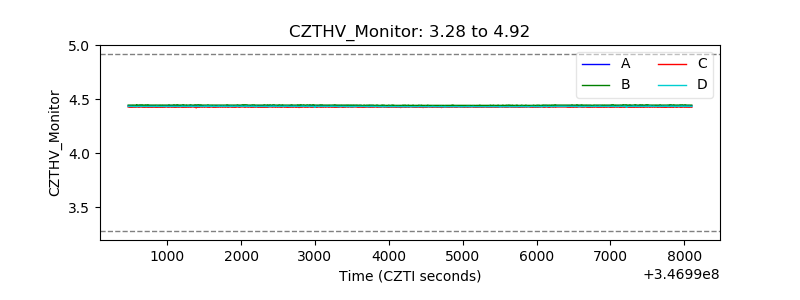 |
| D_VDD | 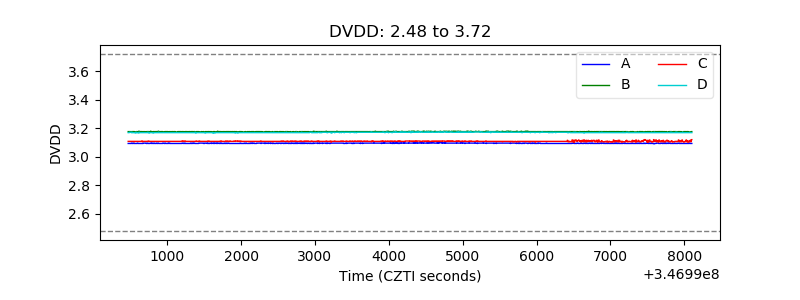 |
| Temperature 1 | 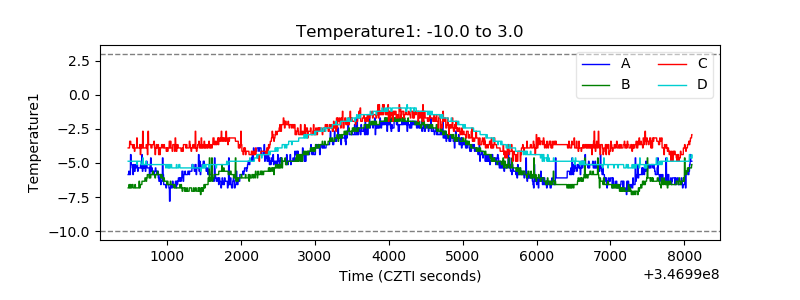 |
| Veto HV Monitor | 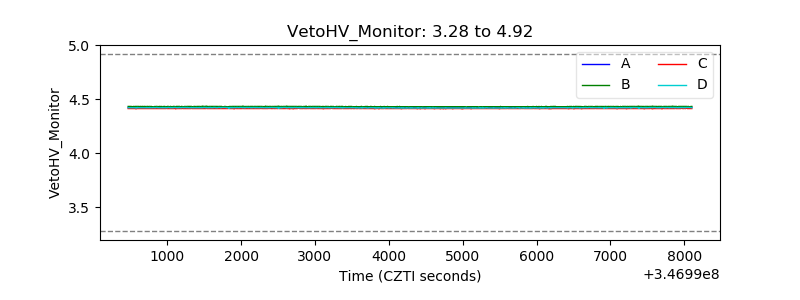 |
| Veto LLD | 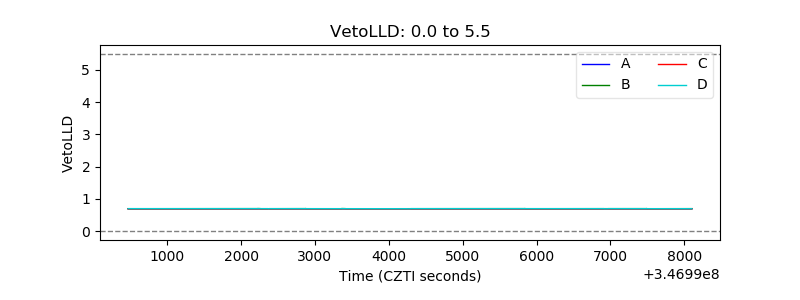 |
| Alpha Counter | 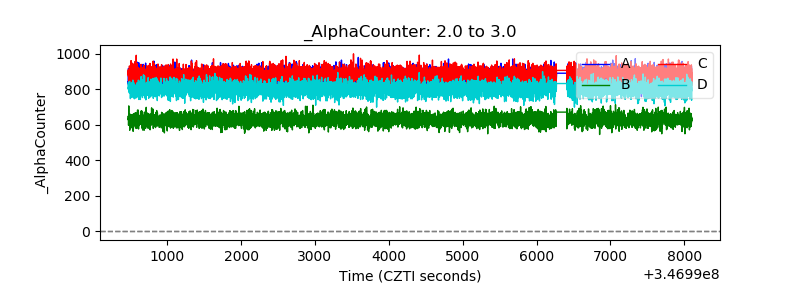 |
| _CPM_Rate | 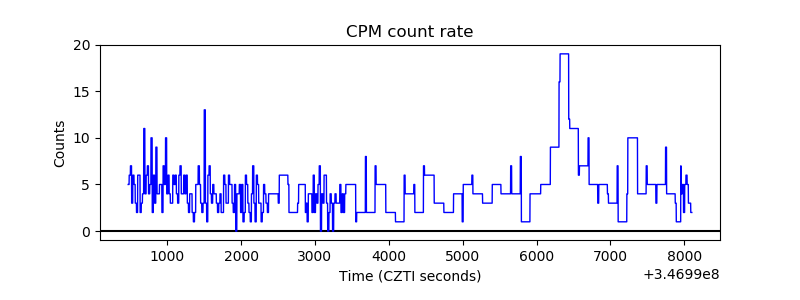 |
| CZT Counter | 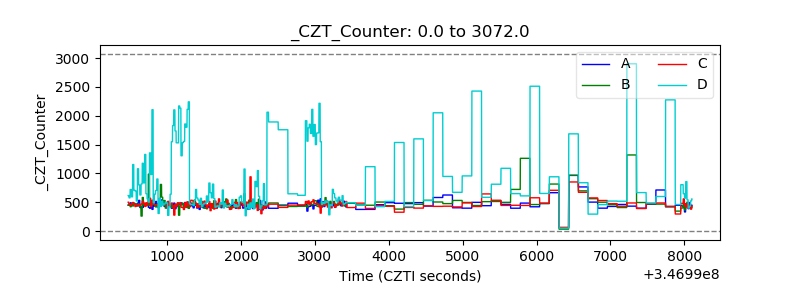 |
| +2.5 Volts monitor |  |
| +5 Volts monitor |  |
| _ROLL_ROT | 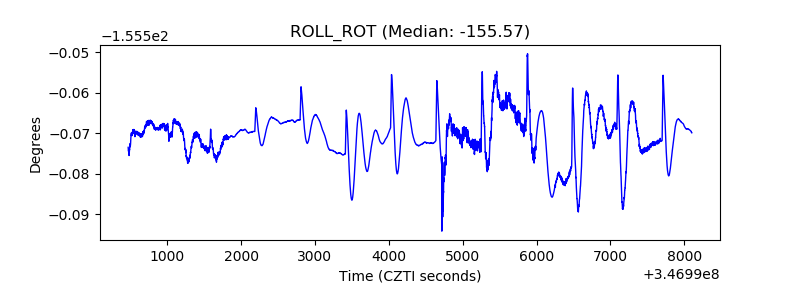 |
| _Roll_DEC | 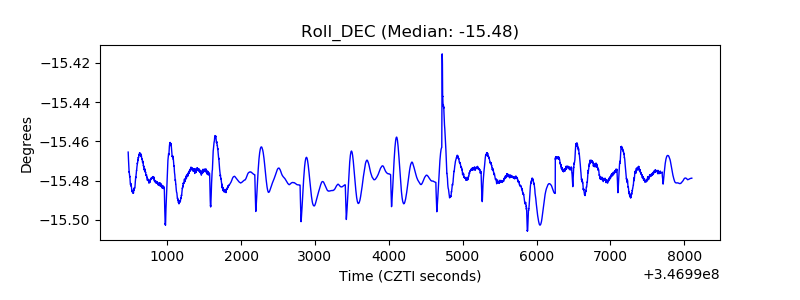 |
| _Roll_RA | 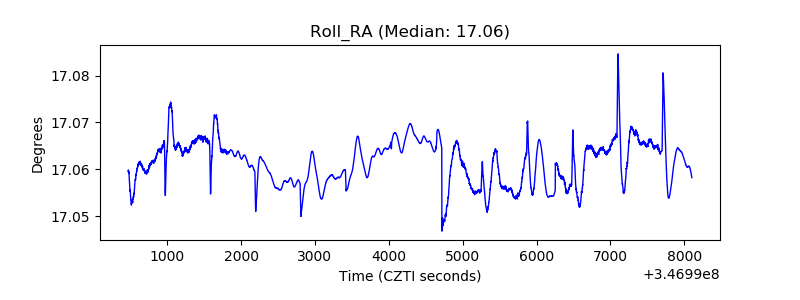 |
| Veto Counter | 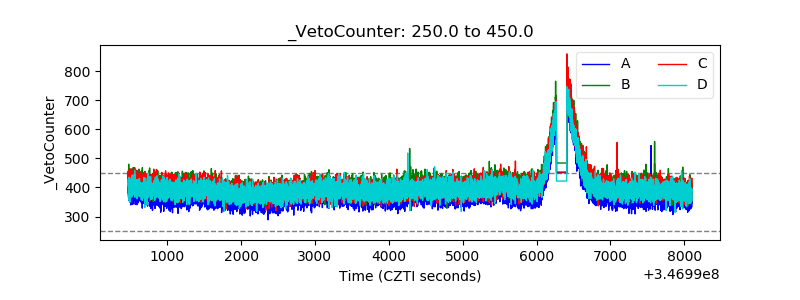 |