| Param | Original file | Final file |
|---|---|---|
| Filename | modeM0/AS1A10_058T13_9000004088_28420cztM0_level2.evt | modeM0/AS1A10_058T13_9000004088_28420cztM0_level2_quad_clean.evt |
| Size (bytes) | 393,511,680 | 57,643,200 |
| Size | 375.3 MB | 55.0 MB |
| Events in quadrant A | 2,155,637 | 368,492 |
| Events in quadrant B | 2,450,330 | 373,520 |
| Events in quadrant C | 2,149,904 | 357,813 |
| Events in quadrant D | 4,847,493 | 320,886 |
| Mode M0 | |||
|---|---|---|---|
| Quadrant | BADHDUFLAG | Total packets | Discarded packets |
| A | 0 | 9464 | 0 |
| B | 0 | 10218 | 0 |
| C | 0 | 9362 | 0 |
| D | 0 | 17641 | 0 |
| Quadrant | Total seconds | Saturated seconds | Saturation percentage |
|---|---|---|---|
| A | 4617 | 24 | 0.519818% |
| B | 4618 | 46 | 0.996102% |
| C | 4618 | 19 | 0.411434% |
| D | 4618 | 656 | 14.205284% |
Noise dominated data is calculated using 1-second bins in cleaned event files. If a bin has >2000 counts, and if more than 50% of those come from <1% of pixels, then it is considered to be noise-dominated and hence unusable.
| Quadrant | # 1 sec bins | Bins with >0 counts | Bins with >2000 counts | High rate bins dominated by noise | Noise dominated (total time) | Noise dominated (detector-on time) | Marked lightcurve |
|---|---|---|---|---|---|---|---|
| A | 4617 | 4617 | 19 | 19 | 0.41% | 0.41% | 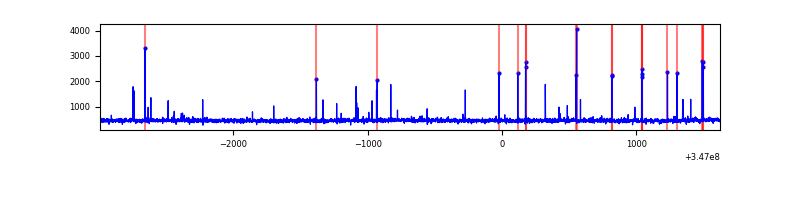 |
| B | 4618 | 4618 | 31 | 31 | 0.67% | 0.67% | 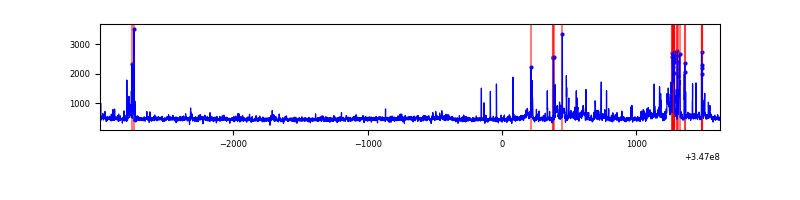 |
| C | 4618 | 4618 | 1 | 1 | 0.02% | 0.02% | 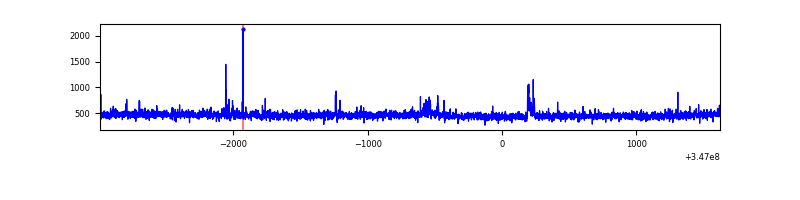 |
| D | 4618 | 4618 | 650 | 650 | 14.08% | 14.08% | 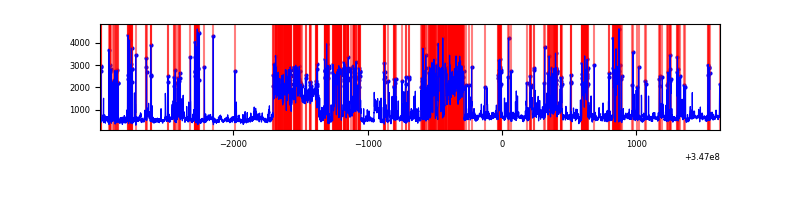 |
Top three noisy pixels from each quadrant. If the there are fewer than three noisy pixels in the level2.evt file, extra rows are filled as -1
| Pixel properties | Quadrant properties | ||||||
|---|---|---|---|---|---|---|---|
| Quadrant | DetID | PixID | Counts | Sigma | Mean | Median | Sigma |
| A | 6 | 16 | 70324 | 632.37 | 538 | 526 | 110.4 |
| A | 12 | 96 | 7634 | 64.39 | 538 | 526 | 110.4 |
| A | 13 | 254 | 7010 | 58.74 | 538 | 526 | 110.4 |
| B | 10 | 245 | 320850 | 3086.1 | 534 | 520 | 103.8 |
| B | 0 | 230 | 19086 | 178.87 | 534 | 520 | 103.8 |
| B | 12 | 111 | 12725 | 117.58 | 534 | 520 | 103.8 |
| C | 14 | 238 | 82057 | 668.17 | 514 | 516 | 122.0 |
| C | 7 | 220 | 43052 | 348.55 | 514 | 516 | 122.0 |
| C | 8 | 128 | 9301 | 71.99 | 514 | 516 | 122.0 |
| D | 1 | 52 | 1834132 | 15573.43 | 486 | 472 | 117.7 |
| D | 8 | 195 | 747900 | 6347.97 | 486 | 472 | 117.7 |
| D | 13 | 104 | 212873 | 1803.94 | 486 | 472 | 117.7 |
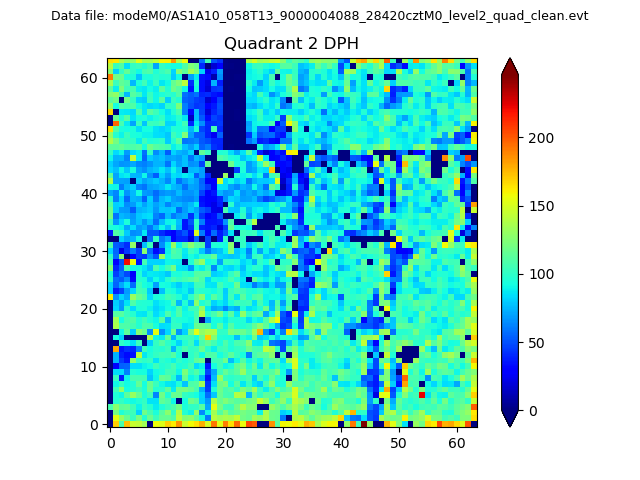
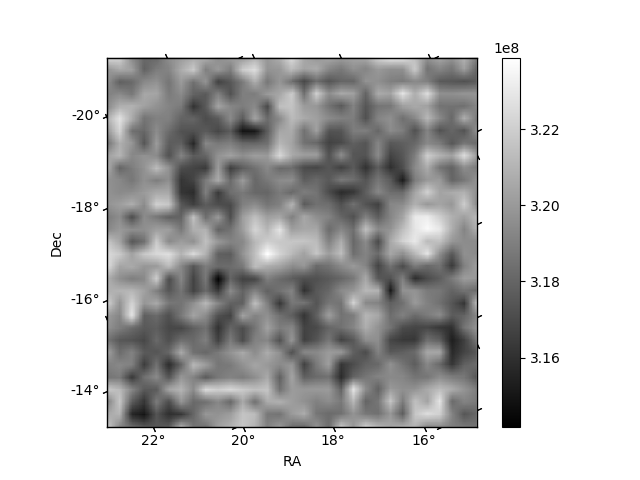
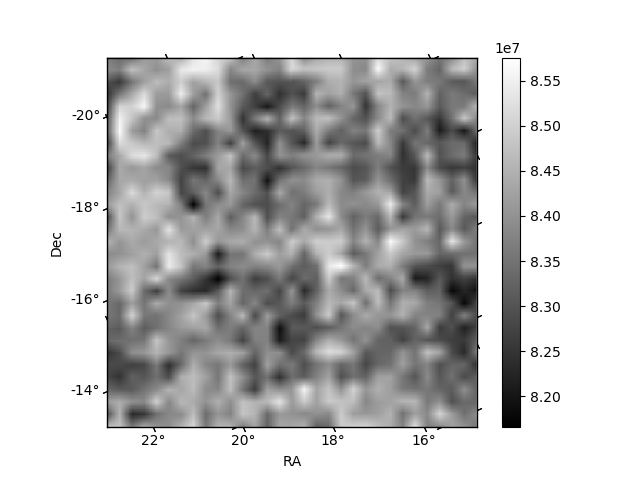
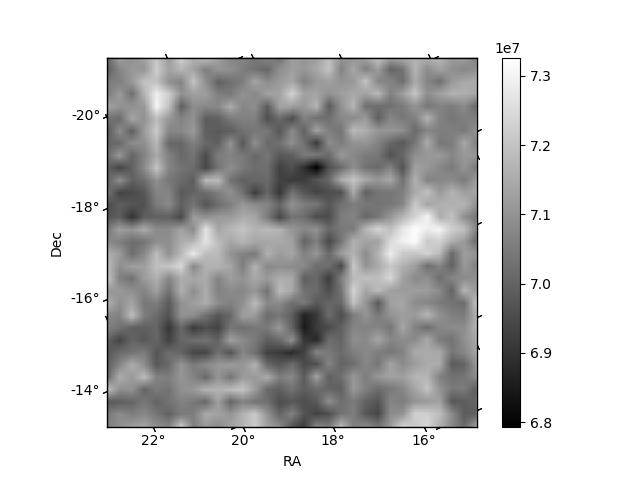
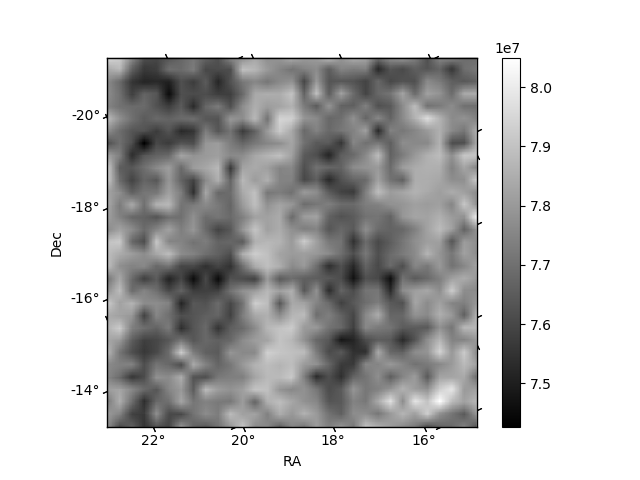
Histogram calculated using DETX and DETY for each event in the final _common_clean file
| Quadrant A | 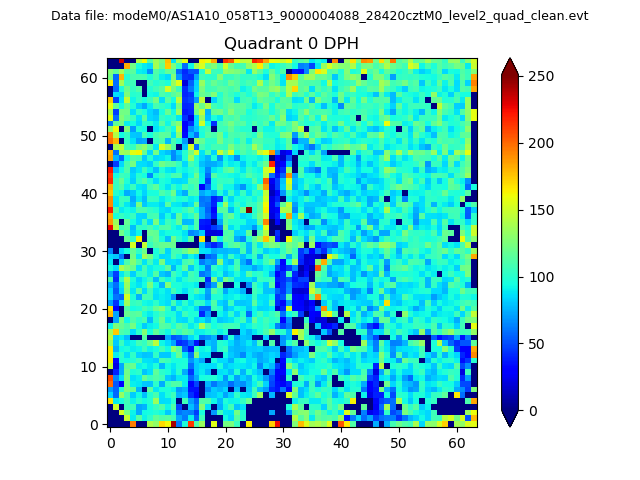 |
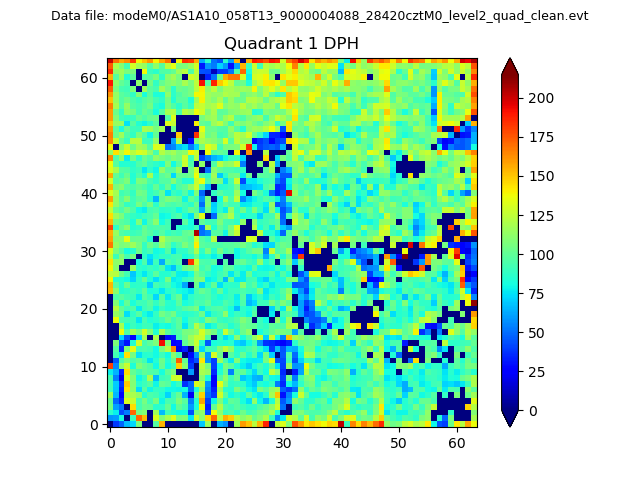 |
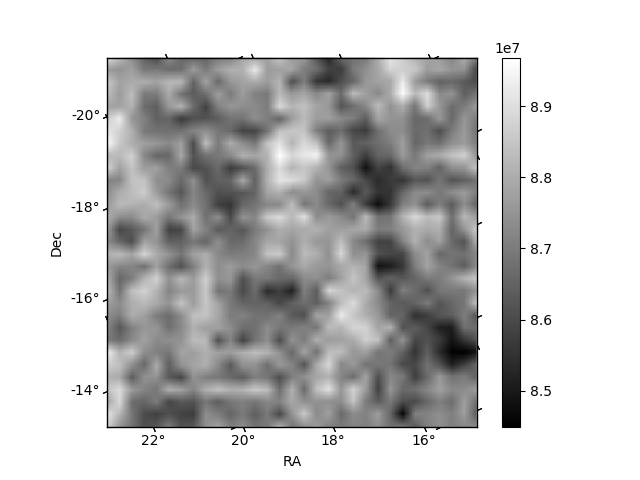
Quadrant B |
|---|---|---|---|
| Quadrant D | 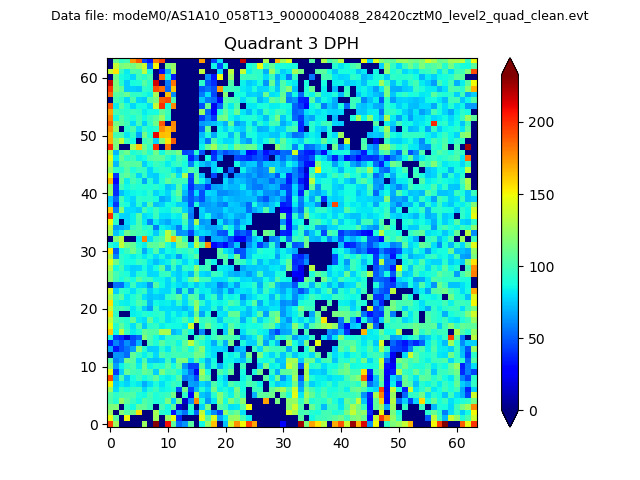 |
 |
Quadrant C |
| Plot type | Count rate plots | Images |
|---|---|---|
| Comparison with Poisson distribution Blue bars denote a histogram of data divided into 1 sec bins. Red curve is a Poisson curve with rate = median count rate of data. |
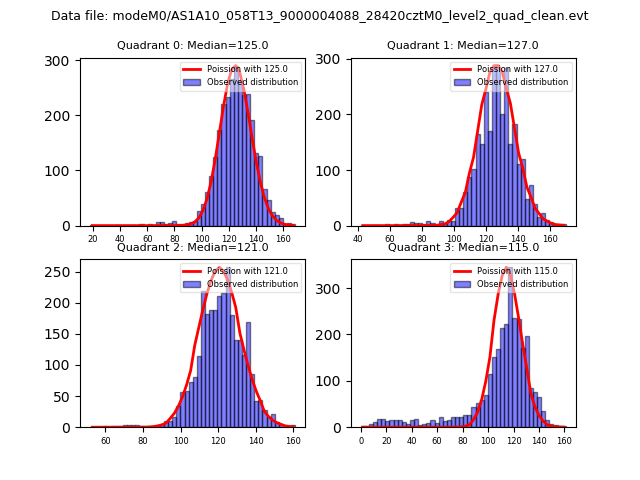 |
 |
| Quadrant-wise count rates Data is divided into 100 sec bins |
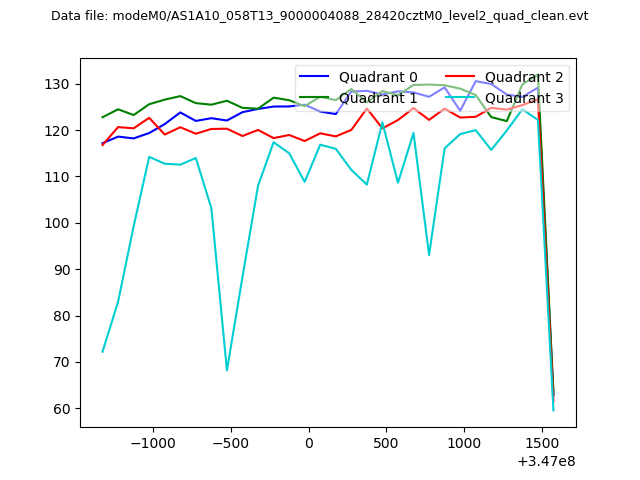 |
|
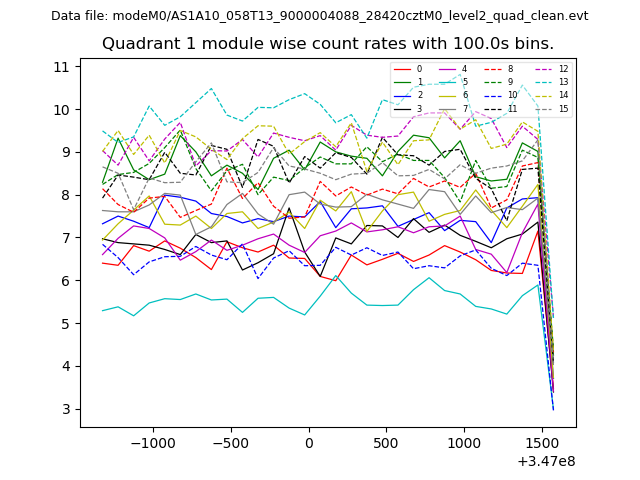
| Module-wise count rates for Quadrant A Data is divided into 100 sec bins |
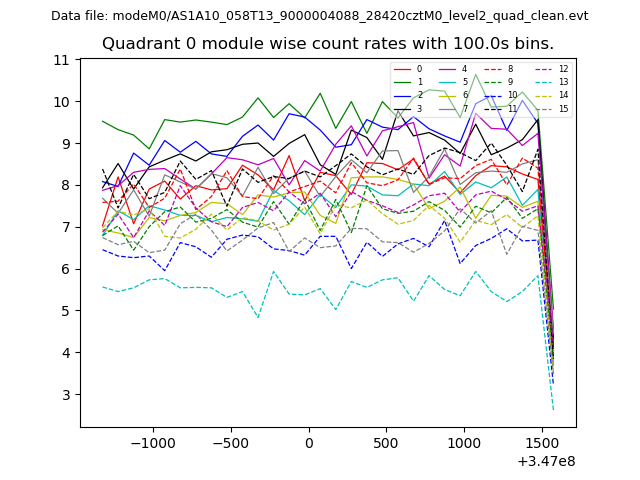 |
 |
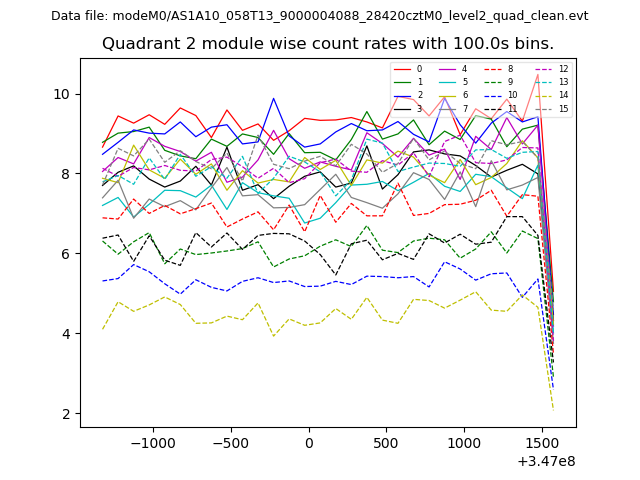
| Module-wise count rates for Quadrant B Data is divided into 100 sec bins |
 |
 |
| Module-wise count rates for Quadrant C Data is divided into 100 sec bins |
 |
 |
| Module-wise count rates for Quadrant D Data is divided into 100 sec bins |
 |
 |
| Parameter | Plot |
|---|---|
| CZT HV Monitor | 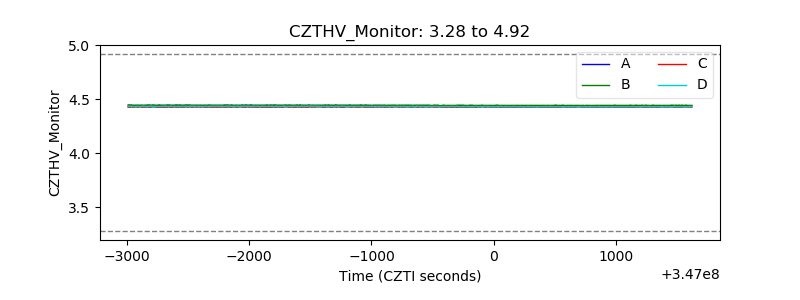 |
| D_VDD | 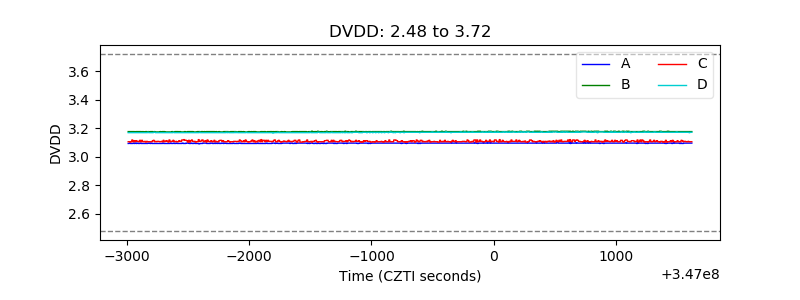 |
| Temperature 1 | 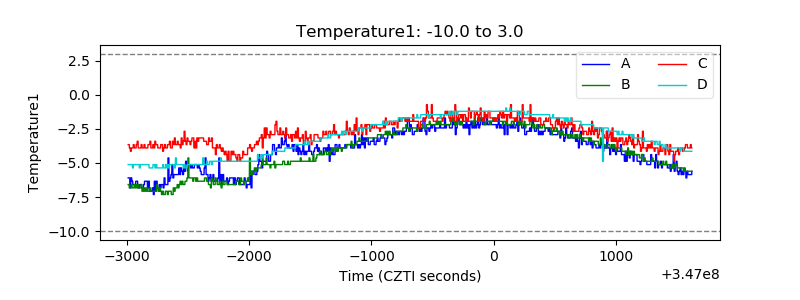 |
| Veto HV Monitor | 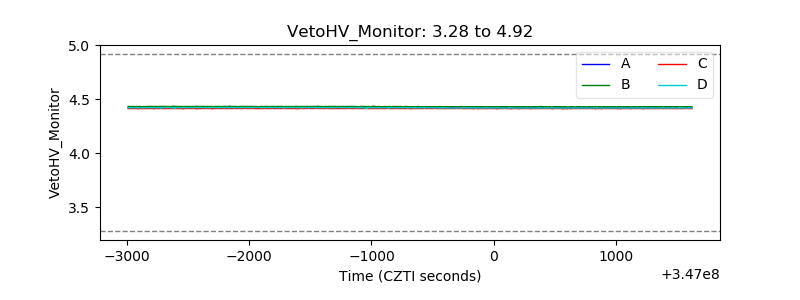 |
| Veto LLD | 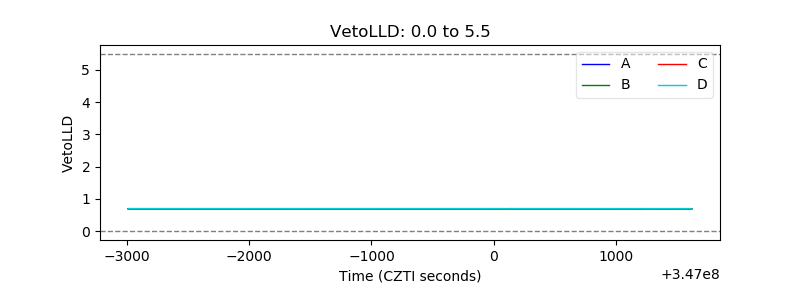 |
| Alpha Counter |  |
| _CPM_Rate |  |
| CZT Counter | 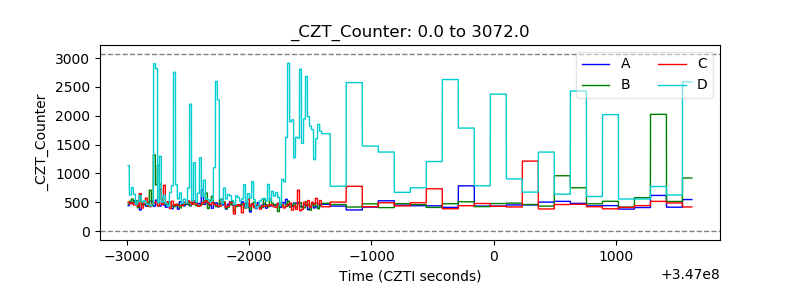 |
| +2.5 Volts monitor |  |
| +5 Volts monitor |  |
| _ROLL_ROT | 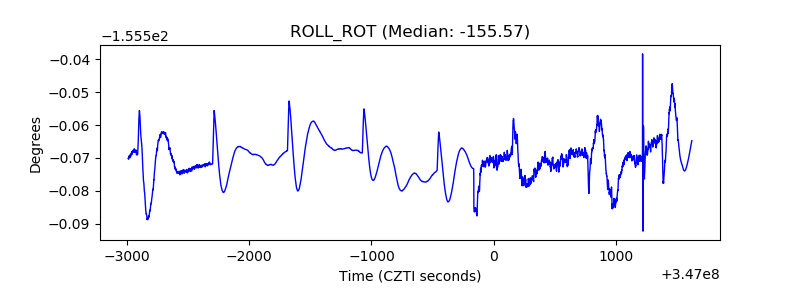 |
| _Roll_DEC | 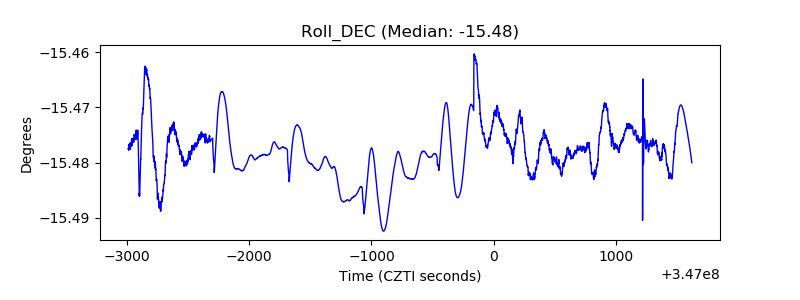 |
| _Roll_RA | 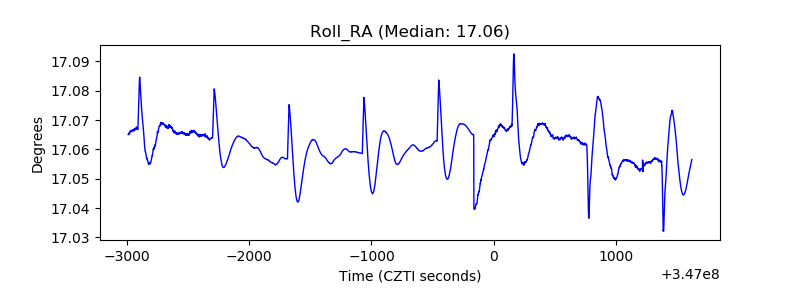 |
| Veto Counter | 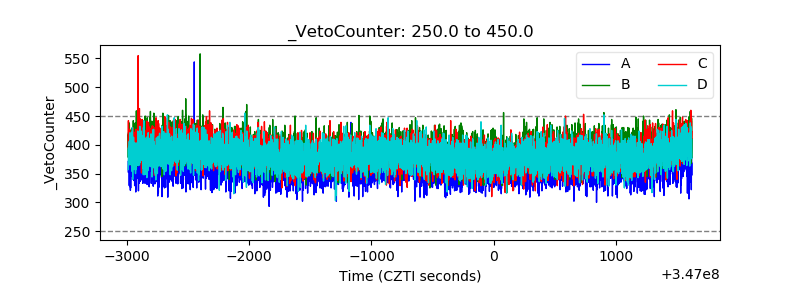 |