| Param | Original file | Final file |
|---|---|---|
| Filename | modeM0/AS1A10_101T21_9000004090_28420cztM0_level2.evt | modeM0/AS1A10_101T21_9000004090_28420cztM0_level2_quad_clean.evt |
| Size (bytes) | 151,156,800 | 29,373,120 |
| Size | 144.2 MB | 28.0 MB |
| Events in quadrant A | 726,250 | 198,264 |
| Events in quadrant B | 801,027 | 203,411 |
| Events in quadrant C | 1,142,203 | 192,036 |
| Events in quadrant D | 1,794,615 | 174,797 |
| Mode M0 | |||
|---|---|---|---|
| Quadrant | BADHDUFLAG | Total packets | Discarded packets |
| A | 0 | 3366 | 0 |
| B | 0 | 3464 | 0 |
| C | 0 | 4558 | 0 |
| D | 0 | 6452 | 0 |
| Quadrant | Total seconds | Saturated seconds | Saturation percentage |
|---|---|---|---|
| A | 1640 | 6 | 0.365854% |
| B | 1640 | 13 | 0.792683% |
| C | 1640 | 99 | 6.036585% |
| D | 1640 | 313 | 19.085366% |
Noise dominated data is calculated using 1-second bins in cleaned event files. If a bin has >2000 counts, and if more than 50% of those come from <1% of pixels, then it is considered to be noise-dominated and hence unusable.
| Quadrant | # 1 sec bins | Bins with >0 counts | Bins with >2000 counts | High rate bins dominated by noise | Noise dominated (total time) | Noise dominated (detector-on time) | Marked lightcurve |
|---|---|---|---|---|---|---|---|
| A | 1640 | 1640 | 0 | 0 | 0.00% | 0.00% | 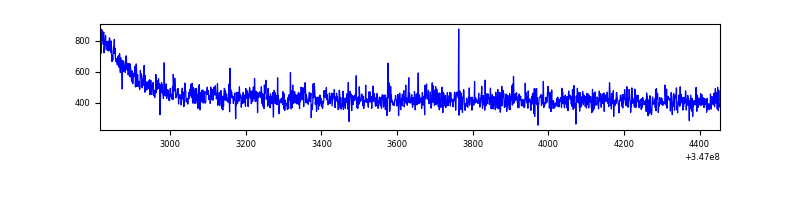 |
| B | 1640 | 1640 | 0 | 0 | 0.00% | 0.00% | 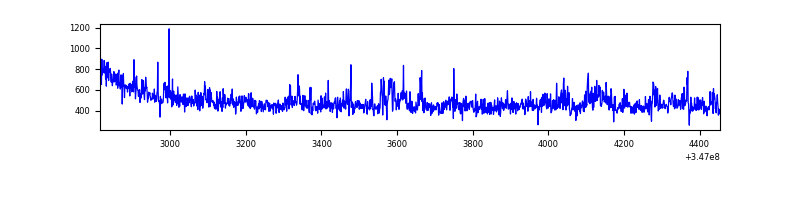 |
| C | 1640 | 1640 | 65 | 65 | 3.96% | 3.96% | 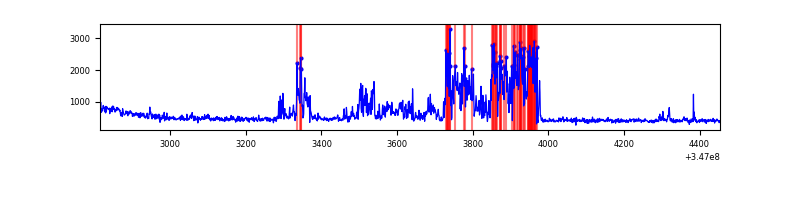 |
| D | 1640 | 1640 | 294 | 294 | 17.93% | 17.93% | 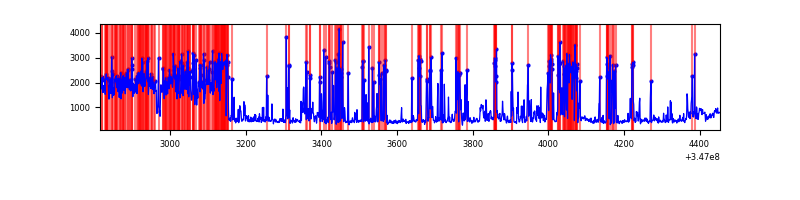 |
Top three noisy pixels from each quadrant. If the there are fewer than three noisy pixels in the level2.evt file, extra rows are filled as -1
| Pixel properties | Quadrant properties | ||||||
|---|---|---|---|---|---|---|---|
| Quadrant | DetID | PixID | Counts | Sigma | Mean | Median | Sigma |
| A | 13 | 254 | 2553 | 58.85 | 187 | 183 | 40.3 |
| A | 3 | 137 | 1991 | 44.9 | 187 | 183 | 40.3 |
| A | 0 | 226 | 1619 | 35.66 | 187 | 183 | 40.3 |
| B | 10 | 245 | 59538 | 1546.07 | 188 | 183 | 38.4 |
| B | 12 | 111 | 4804 | 120.37 | 188 | 183 | 38.4 |
| B | 11 | 111 | 4284 | 106.82 | 188 | 183 | 38.4 |
| C | 7 | 220 | 420473 | 9786.52 | 176 | 177 | 42.9 |
| C | 14 | 238 | 29070 | 672.77 | 176 | 177 | 42.9 |
| C | 3 | 233 | 4029 | 89.69 | 176 | 177 | 42.9 |
| D | 1 | 52 | 738732 | 18178.83 | 164 | 159 | 40.6 |
| D | 8 | 195 | 420321 | 10341.64 | 164 | 159 | 40.6 |
| D | 2 | 250 | 6741 | 162.01 | 164 | 159 | 40.6 |
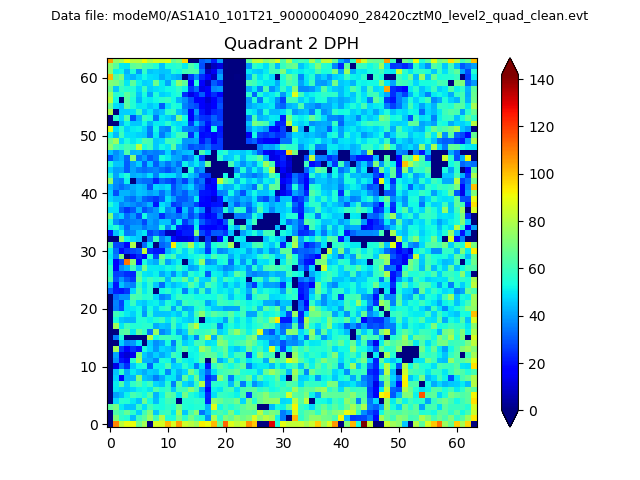
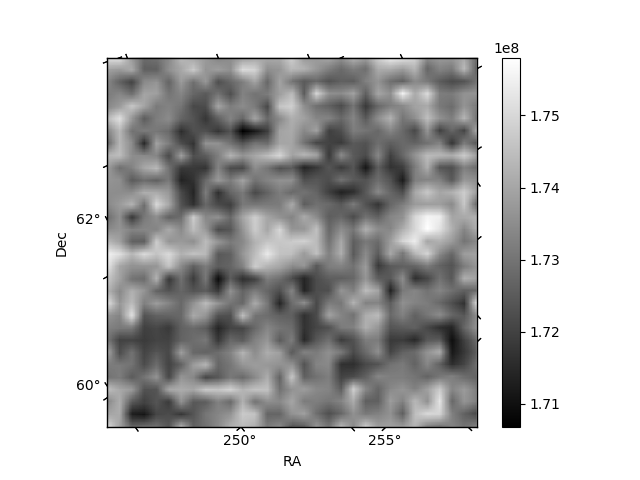
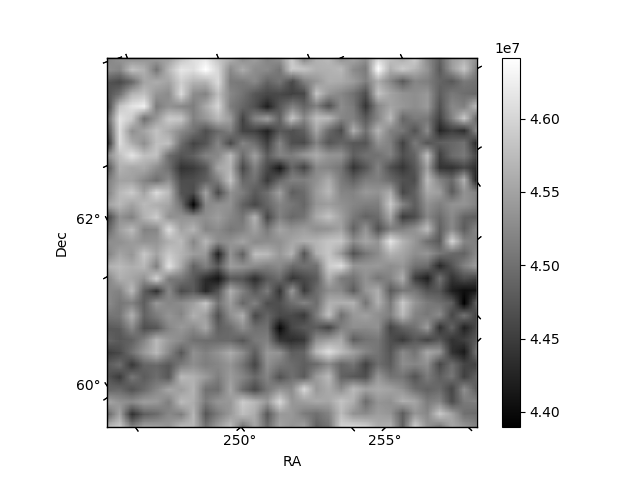
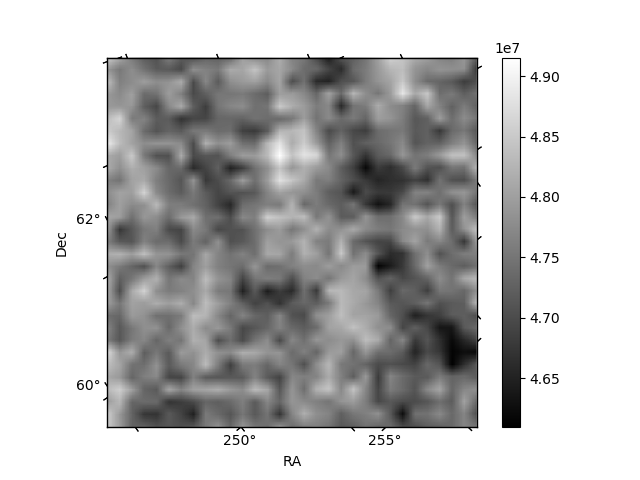
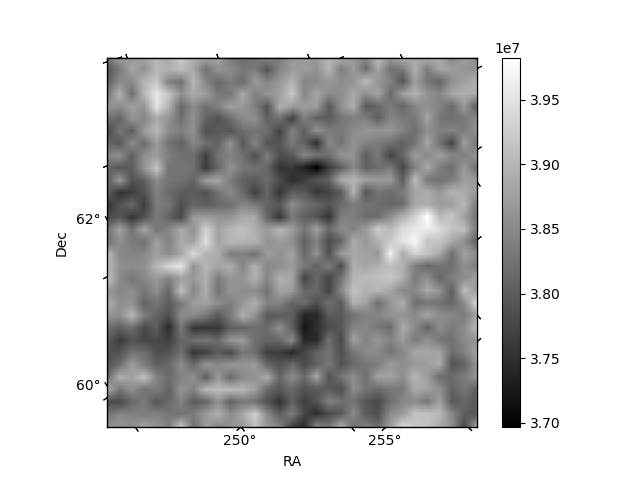
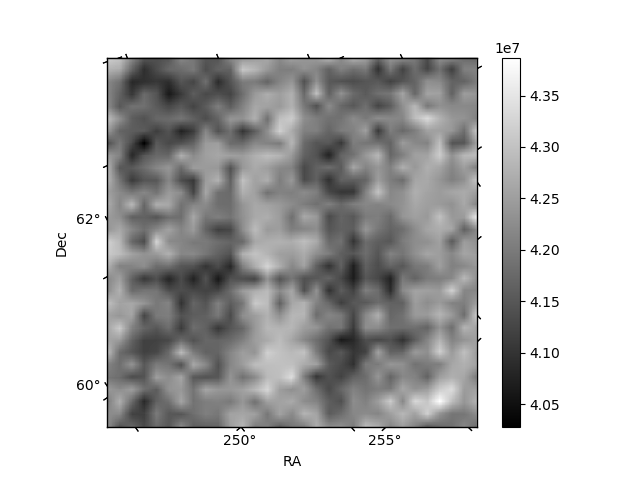
Histogram calculated using DETX and DETY for each event in the final _common_clean file
| Quadrant A | 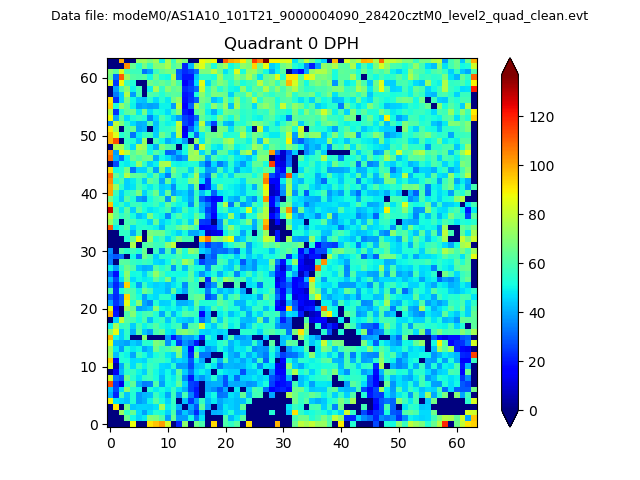 |
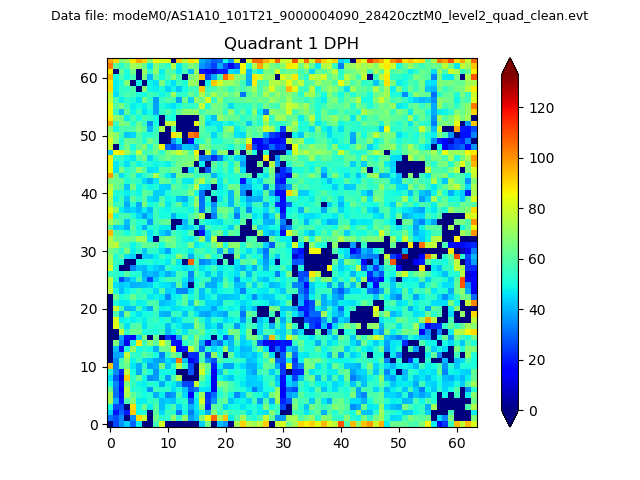 |
Quadrant B |
|---|---|---|---|
| Quadrant D | 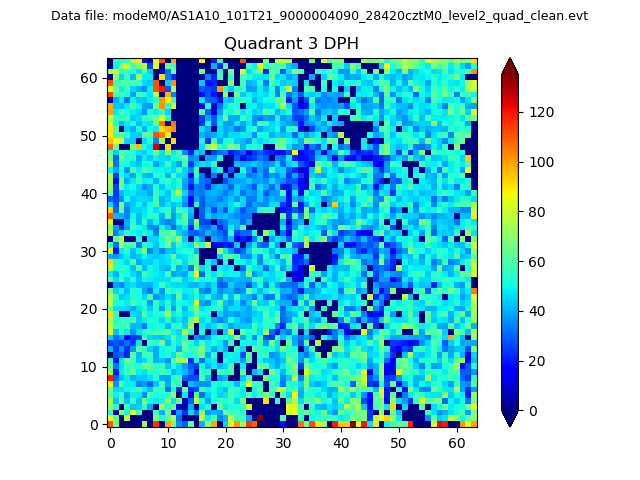 |
 |
Quadrant C |
| Plot type | Count rate plots | Images |
|---|---|---|
| Comparison with Poisson distribution Blue bars denote a histogram of data divided into 1 sec bins. Red curve is a Poisson curve with rate = median count rate of data. |
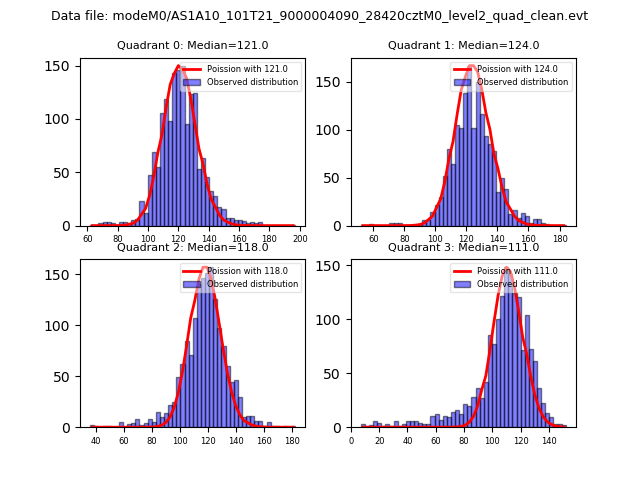 |
 |
| Quadrant-wise count rates Data is divided into 100 sec bins |
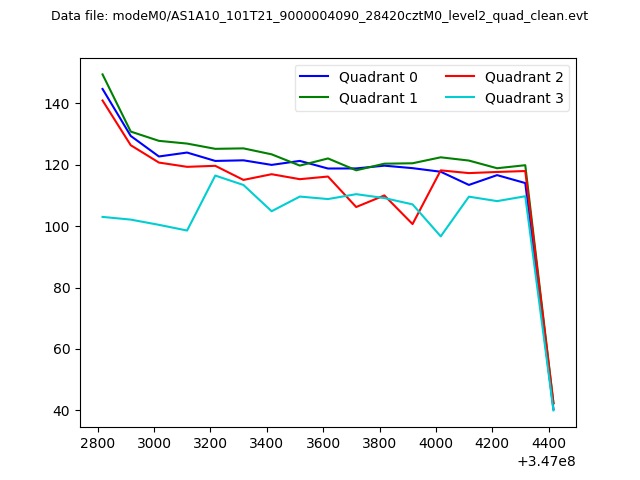 |
|
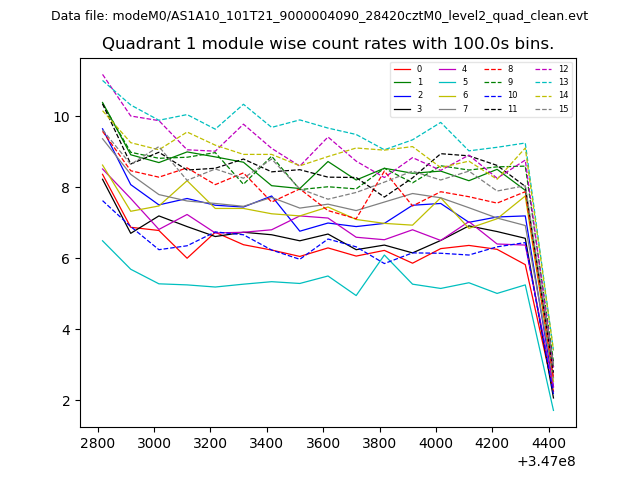
| Module-wise count rates for Quadrant A Data is divided into 100 sec bins |
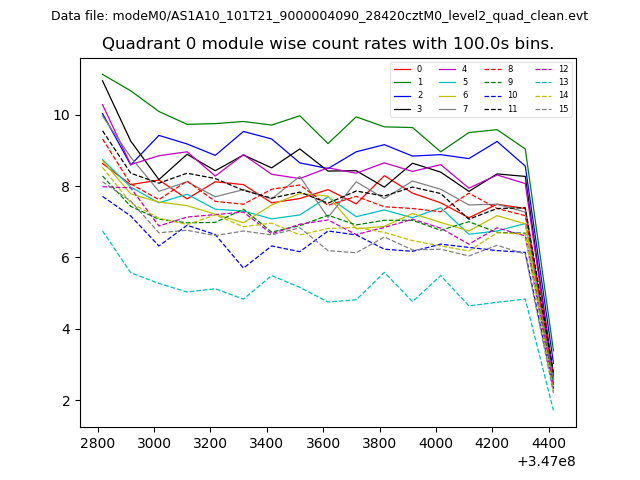 |
 |
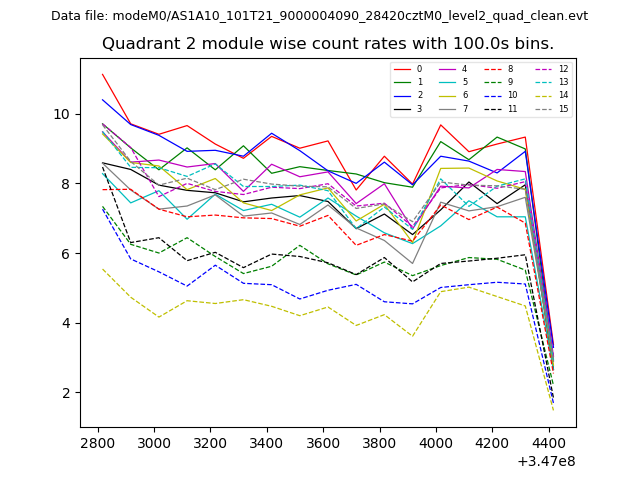
| Module-wise count rates for Quadrant B Data is divided into 100 sec bins |
 |
 |
| Module-wise count rates for Quadrant C Data is divided into 100 sec bins |
 |
 |
| Module-wise count rates for Quadrant D Data is divided into 100 sec bins |
 |
 |
| Parameter | Plot |
|---|---|
| CZT HV Monitor | 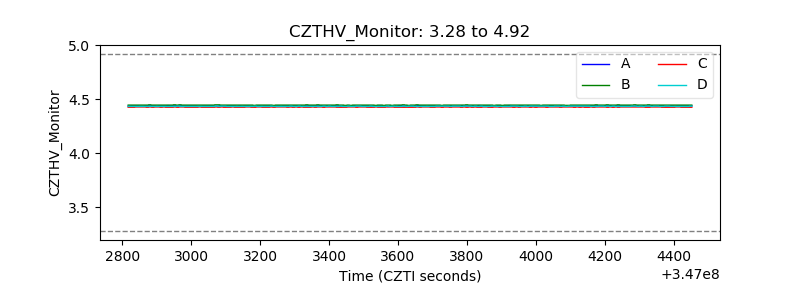 |
| D_VDD | 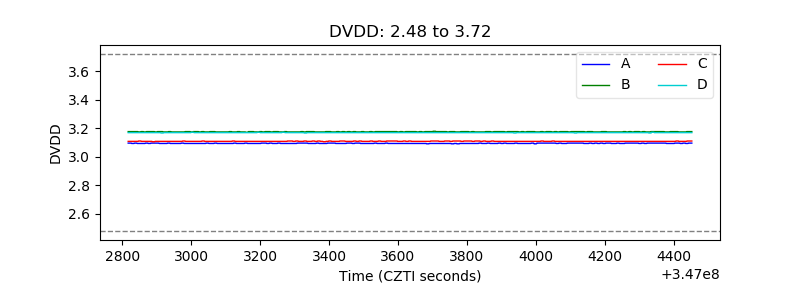 |
| Temperature 1 | 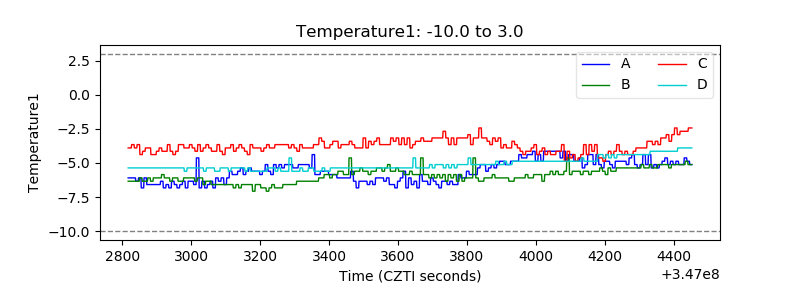 |
| Veto HV Monitor | 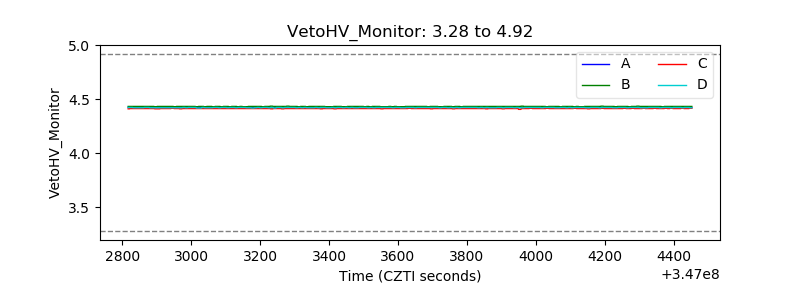 |
| Veto LLD | 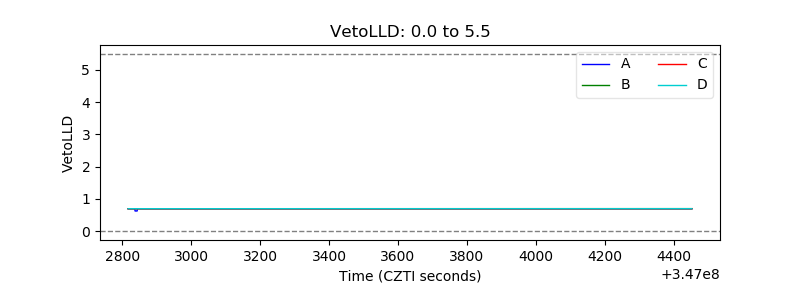 |
| Alpha Counter |  |
| _CPM_Rate |  |
| CZT Counter | 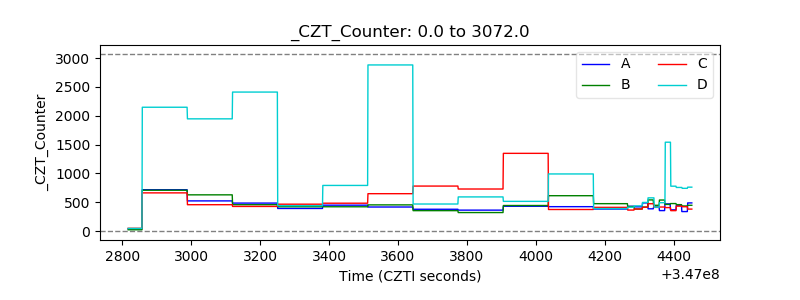 |
| +2.5 Volts monitor |  |
| +5 Volts monitor |  |
| _ROLL_ROT | 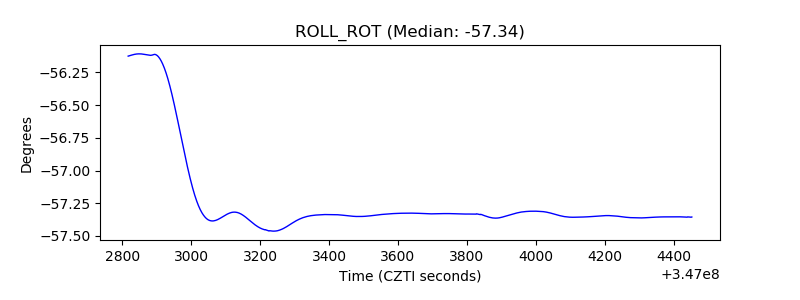 |
| _Roll_DEC | 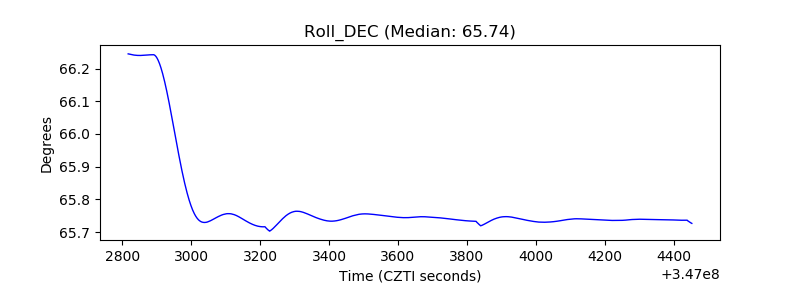 |
| _Roll_RA | 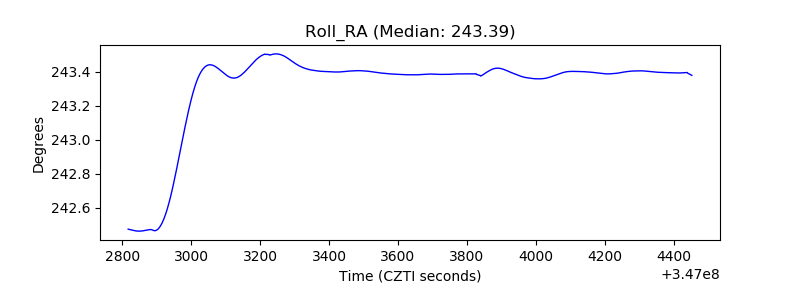 |
| Veto Counter | 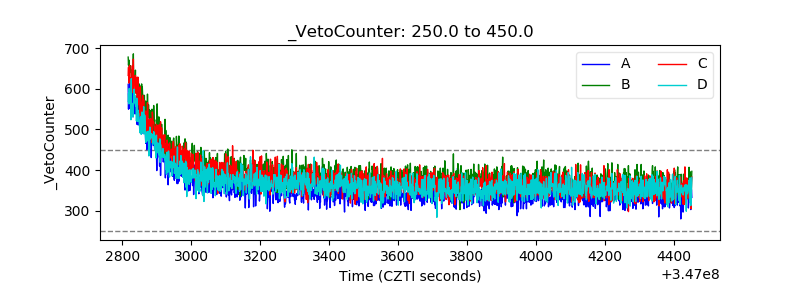 |