| Param | Original file | Final file |
|---|---|---|
| Filename | modeM0/AS1A10_101T21_9000004090_28424cztM0_level2.evt | modeM0/AS1A10_101T21_9000004090_28424cztM0_level2_quad_clean.evt |
| Size (bytes) | 484,891,200 | 107,418,240 |
| Size | 462.4 MB | 102.4 MB |
| Events in quadrant A | 2,897,663 | 731,535 |
| Events in quadrant B | 3,016,844 | 739,602 |
| Events in quadrant C | 2,940,112 | 704,768 |
| Events in quadrant D | 5,410,440 | 645,483 |
| Mode M0 | |||
|---|---|---|---|
| Quadrant | BADHDUFLAG | Total packets | Discarded packets |
| A | 0 | 12638 | 0 |
| B | 0 | 12873 | 0 |
| C | 0 | 12676 | 0 |
| D | 0 | 20027 | 0 |
| Mode M9 | |||
|---|---|---|---|
| Quadrant | BADHDUFLAG | Total packets | Discarded packets |
| A | 0 | 10 | 0 |
| B | 0 | 10 | 0 |
| C | 0 | 10 | 0 |
| D | 0 | 10 | 0 |
| Quadrant | Total seconds | Saturated seconds | Saturation percentage |
|---|---|---|---|
| A | 6181 | 41 | 0.663323% |
| B | 6182 | 40 | 0.647040% |
| C | 6182 | 56 | 0.905856% |
| D | 6182 | 768 | 12.423164% |
Noise dominated data is calculated using 1-second bins in cleaned event files. If a bin has >2000 counts, and if more than 50% of those come from <1% of pixels, then it is considered to be noise-dominated and hence unusable.
| Quadrant | # 1 sec bins | Bins with >0 counts | Bins with >2000 counts | High rate bins dominated by noise | Noise dominated (total time) | Noise dominated (detector-on time) | Marked lightcurve |
|---|---|---|---|---|---|---|---|
| A | 7186 | 6181 | 0 | 0 | 0.00% | 0.00% | 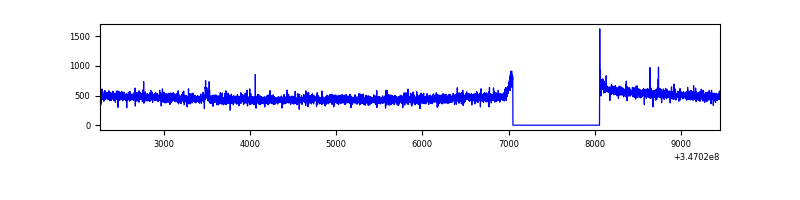 |
| B | 7187 | 6182 | 0 | 0 | 0.00% | 0.00% | 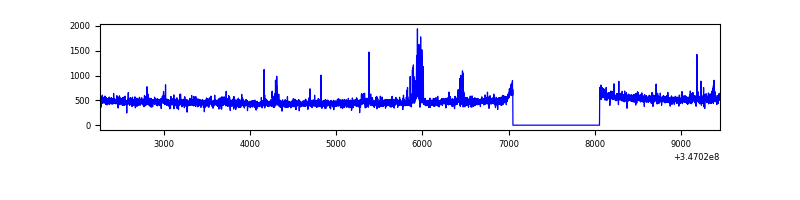 |
| C | 7187 | 6182 | 1 | 1 | 0.01% | 0.02% | 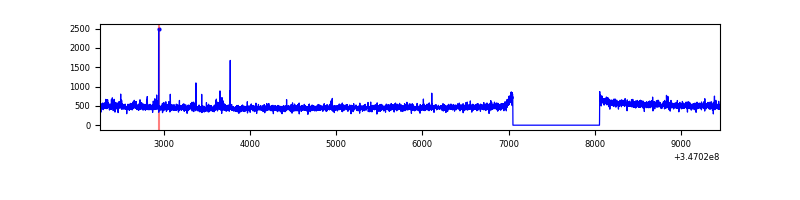 |
| D | 7187 | 6182 | 691 | 691 | 9.61% | 11.18% | 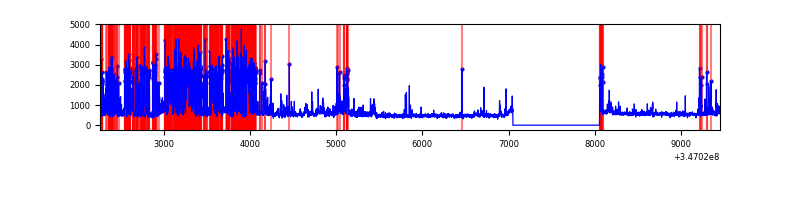 |
Top three noisy pixels from each quadrant. If the there are fewer than three noisy pixels in the level2.evt file, extra rows are filled as -1
| Pixel properties | Quadrant properties | ||||||
|---|---|---|---|---|---|---|---|
| Quadrant | DetID | PixID | Counts | Sigma | Mean | Median | Sigma |
| A | 13 | 254 | 9853 | 60.06 | 748 | 730 | 151.9 |
| A | 3 | 137 | 7480 | 44.44 | 748 | 730 | 151.9 |
| A | 0 | 226 | 6378 | 37.18 | 748 | 730 | 151.9 |
| B | 10 | 245 | 56152 | 395.54 | 737 | 718 | 140.1 |
| B | 0 | 230 | 29147 | 202.85 | 737 | 718 | 140.1 |
| B | 12 | 111 | 17083 | 116.77 | 737 | 718 | 140.1 |
| C | 14 | 238 | 114922 | 686.72 | 714 | 715 | 166.3 |
| C | 7 | 220 | 39678 | 234.28 | 714 | 715 | 166.3 |
| C | 13 | 61 | 4911 | 25.23 | 714 | 715 | 166.3 |
| D | 1 | 52 | 2154995 | 13332.37 | 688 | 670 | 161.6 |
| D | 8 | 195 | 307826 | 1900.88 | 688 | 670 | 161.6 |
| D | 2 | 250 | 136902 | 843.09 | 688 | 670 | 161.6 |
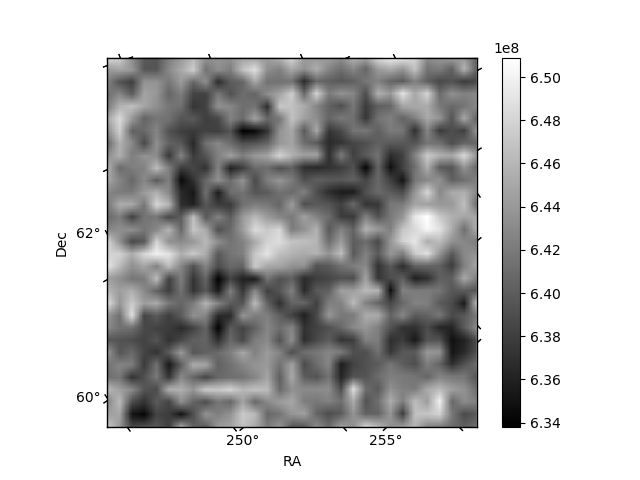
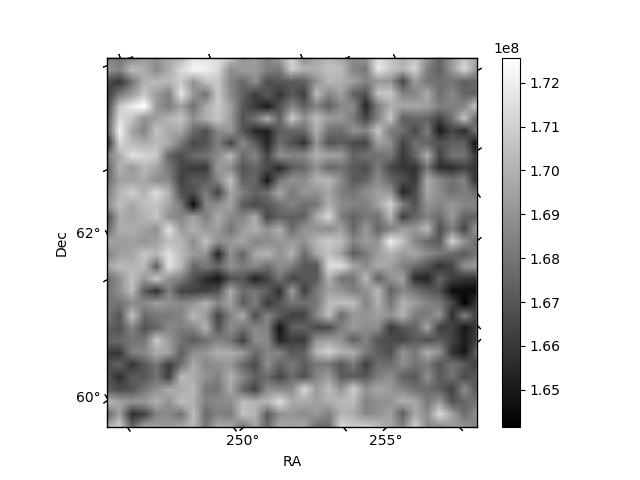
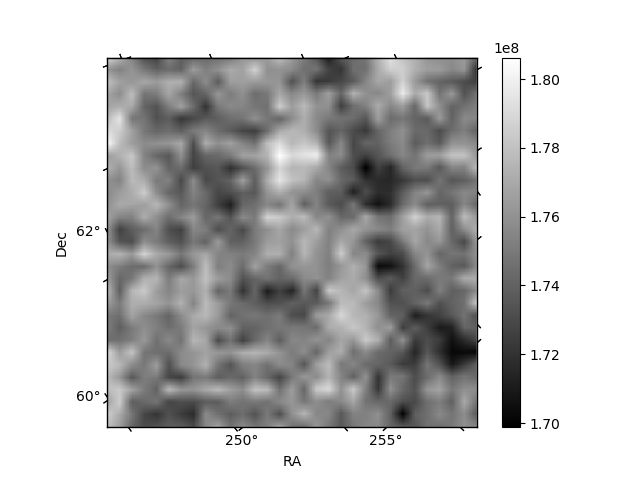
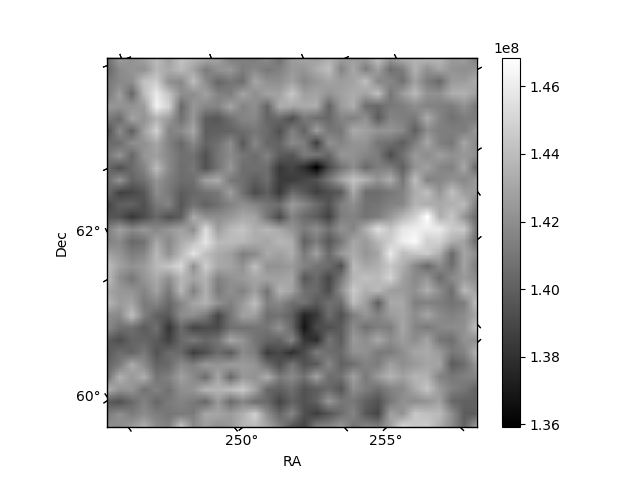
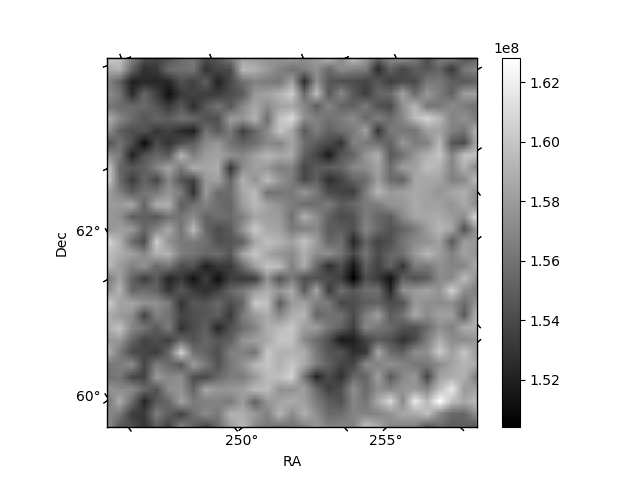
Histogram calculated using DETX and DETY for each event in the final _common_clean file
| Quadrant A | 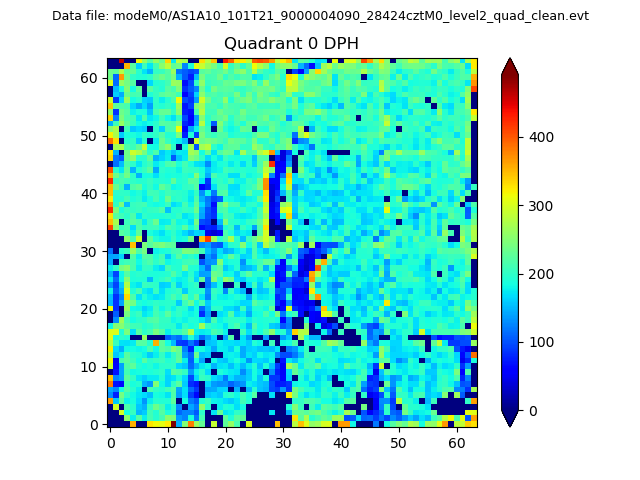 |
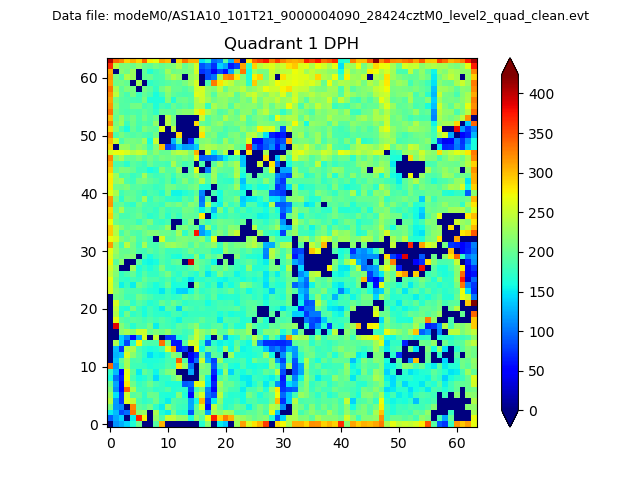 |
Quadrant B |
|---|---|---|---|
| Quadrant D | 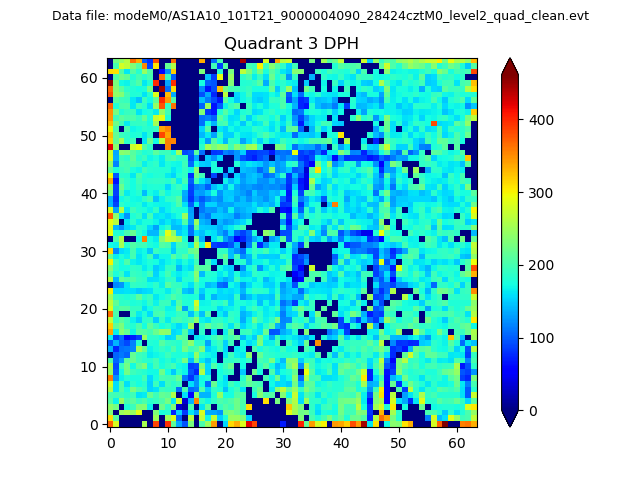 |
 |
Quadrant C |
| Plot type | Count rate plots | Images |
|---|---|---|
| Comparison with Poisson distribution Blue bars denote a histogram of data divided into 1 sec bins. Red curve is a Poisson curve with rate = median count rate of data. |
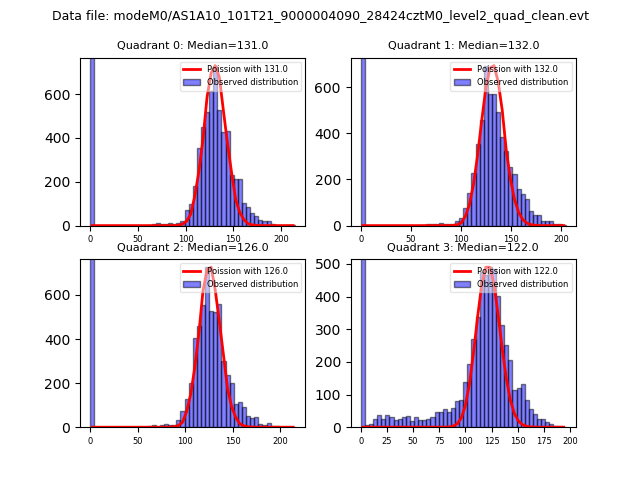 |
 |
| Quadrant-wise count rates Data is divided into 100 sec bins |
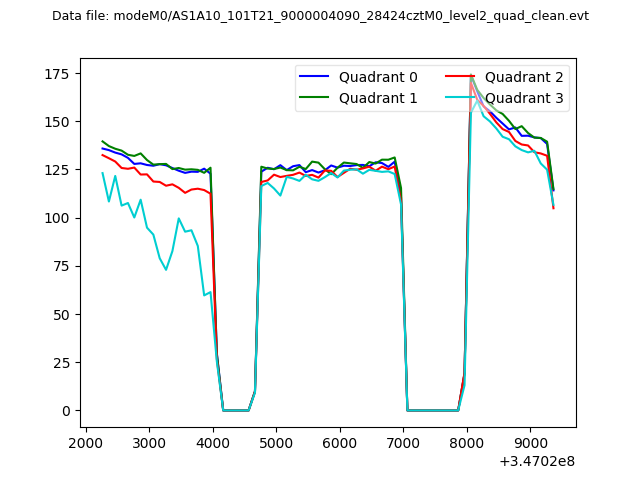 |
|
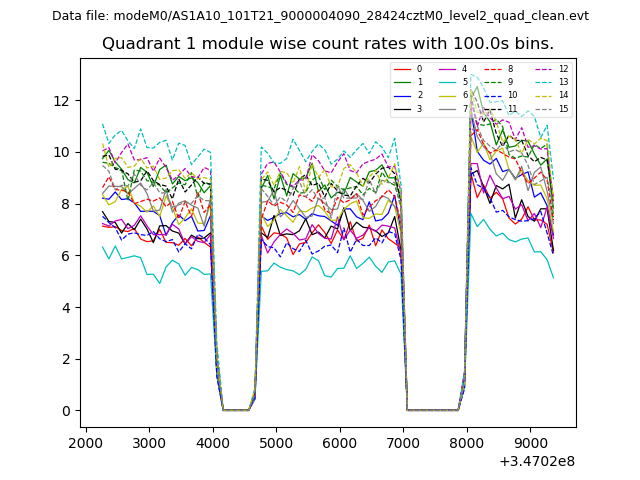
| Module-wise count rates for Quadrant A Data is divided into 100 sec bins |
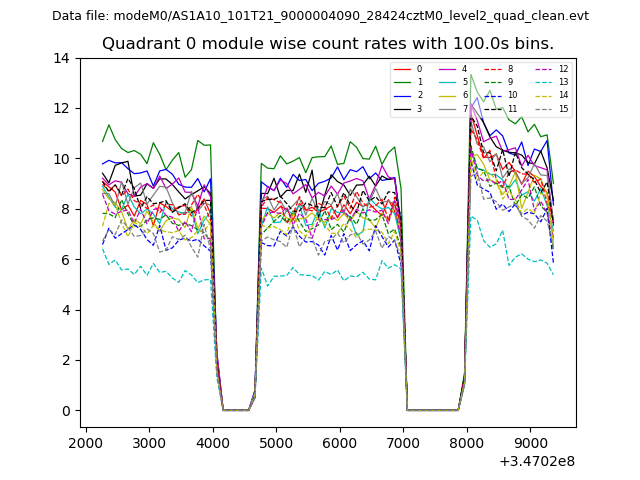 |
 |
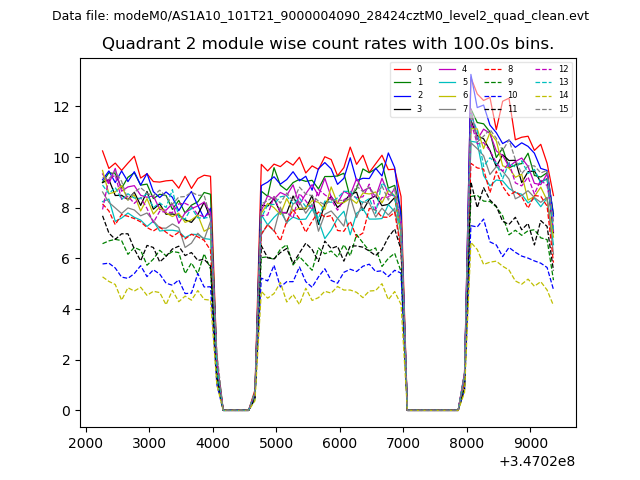
| Module-wise count rates for Quadrant B Data is divided into 100 sec bins |
 |
 |
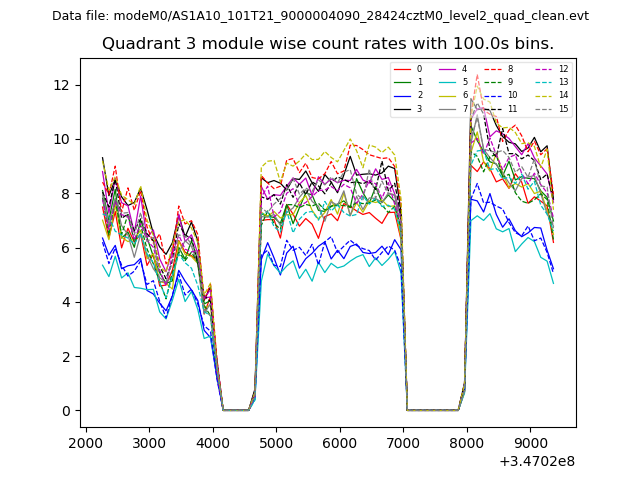
| Module-wise count rates for Quadrant C Data is divided into 100 sec bins |
 |
 |
| Module-wise count rates for Quadrant D Data is divided into 100 sec bins |
 |
 |
| Parameter | Plot |
|---|---|
| CZT HV Monitor | 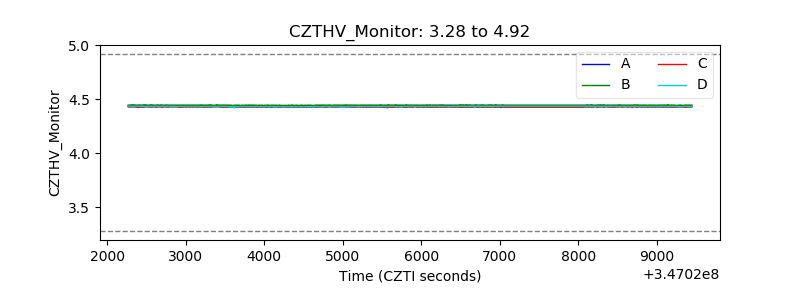 |
| D_VDD | 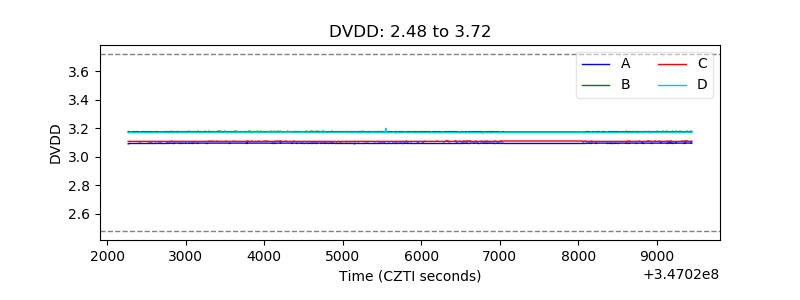 |
| Temperature 1 | 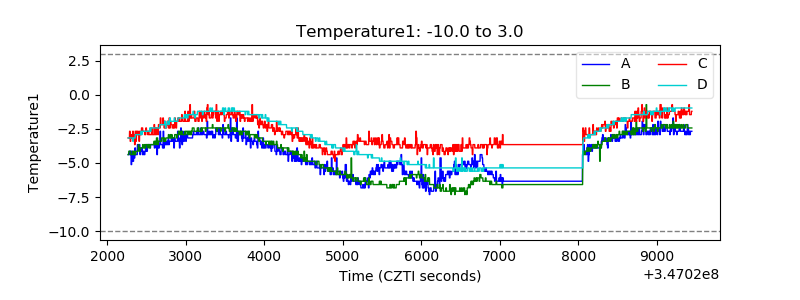 |
| Veto HV Monitor | 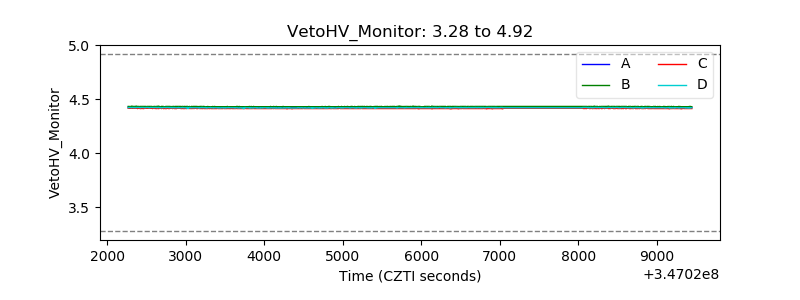 |
| Veto LLD | 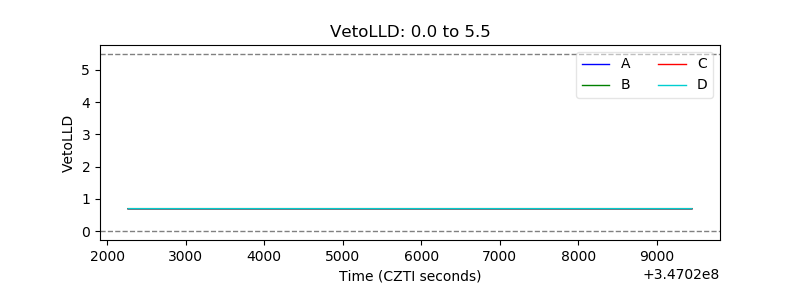 |
| Alpha Counter | 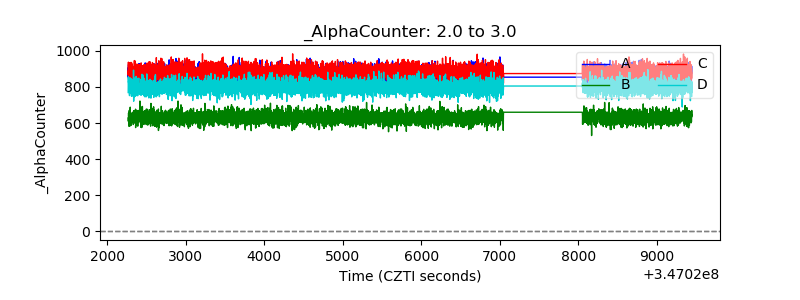 |
| _CPM_Rate | 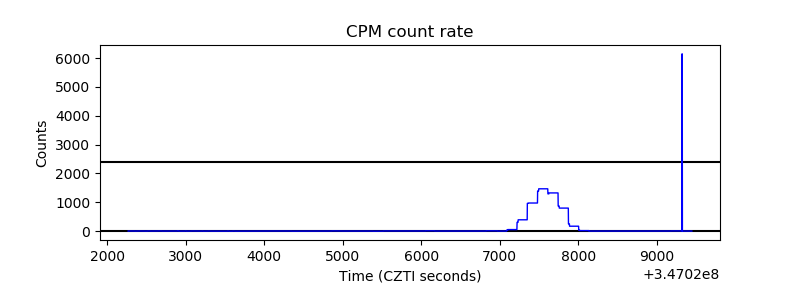 |
| CZT Counter | 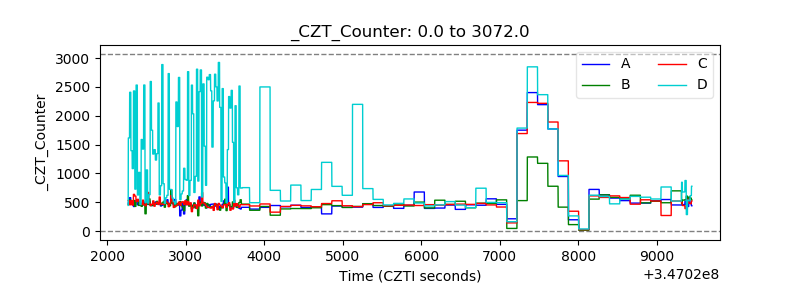 |
| +2.5 Volts monitor |  |
| +5 Volts monitor |  |
| _ROLL_ROT | 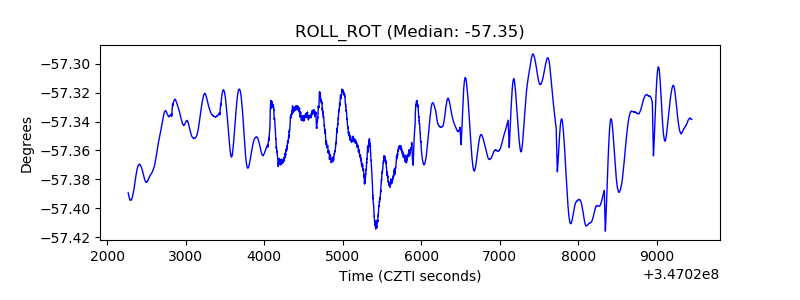 |
| _Roll_DEC | 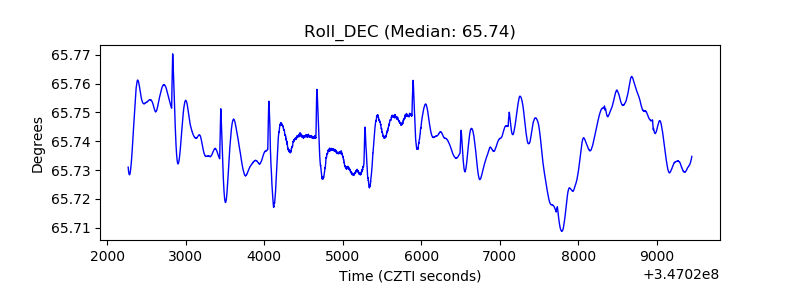 |
| _Roll_RA | 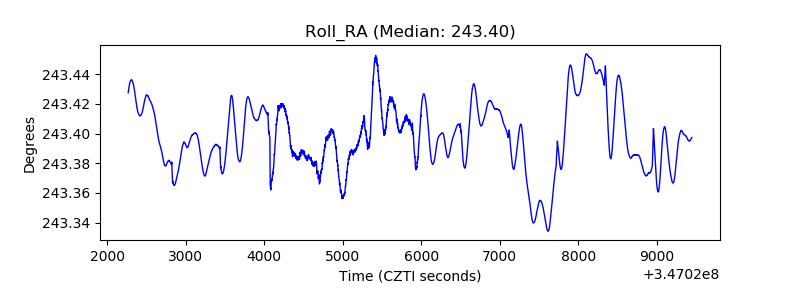 |
| Veto Counter | 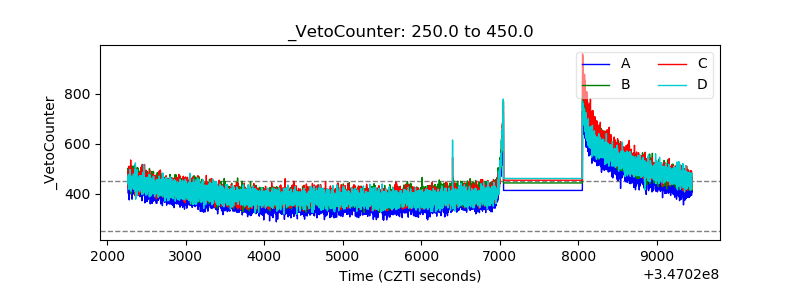 |