| Param | Original file | Final file |
|---|---|---|
| Filename | modeM0/AS1A10_101T21_9000004090_28426cztM0_level2.evt | modeM0/AS1A10_101T21_9000004090_28426cztM0_level2_quad_clean.evt |
| Size (bytes) | 432,734,400 | 112,008,960 |
| Size | 412.7 MB | 106.8 MB |
| Events in quadrant A | 2,906,549 | 755,992 |
| Events in quadrant B | 3,004,592 | 765,208 |
| Events in quadrant C | 3,007,311 | 734,029 |
| Events in quadrant D | 3,777,507 | 716,366 |
| Mode M0 | |||
|---|---|---|---|
| Quadrant | BADHDUFLAG | Total packets | Discarded packets |
| A | 0 | 12612 | 0 |
| B | 0 | 12804 | 0 |
| C | 0 | 12772 | 0 |
| D | 0 | 15246 | 0 |
| Mode M9 | |||
|---|---|---|---|
| Quadrant | BADHDUFLAG | Total packets | Discarded packets |
| A | 0 | 11 | 0 |
| B | 0 | 11 | 0 |
| C | 0 | 11 | 0 |
| D | 0 | 11 | 0 |
| Quadrant | Total seconds | Saturated seconds | Saturation percentage |
|---|---|---|---|
| A | 6020 | 56 | 0.930233% |
| B | 6021 | 59 | 0.979904% |
| C | 6021 | 98 | 1.627637% |
| D | 6021 | 100 | 1.660854% |
Noise dominated data is calculated using 1-second bins in cleaned event files. If a bin has >2000 counts, and if more than 50% of those come from <1% of pixels, then it is considered to be noise-dominated and hence unusable.
| Quadrant | # 1 sec bins | Bins with >0 counts | Bins with >2000 counts | High rate bins dominated by noise | Noise dominated (total time) | Noise dominated (detector-on time) | Marked lightcurve |
|---|---|---|---|---|---|---|---|
| A | 7150 | 6020 | 0 | 0 | 0.00% | 0.00% | 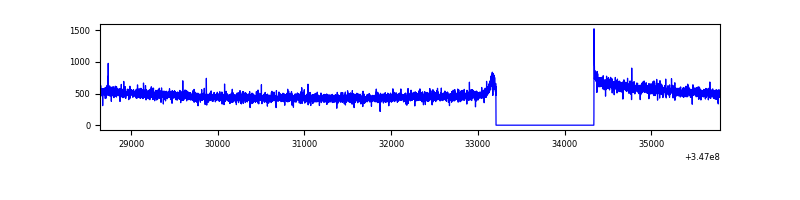 |
| B | 7151 | 6021 | 1 | 1 | 0.01% | 0.02% | 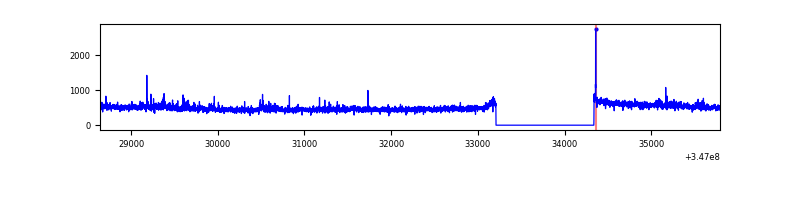 |
| C | 7151 | 6021 | 0 | 0 | 0.00% | 0.00% | 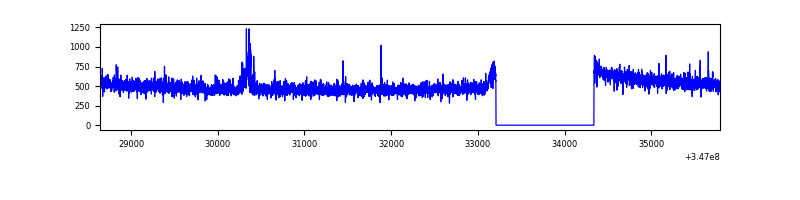 |
| D | 7151 | 6021 | 73 | 73 | 1.02% | 1.21% | 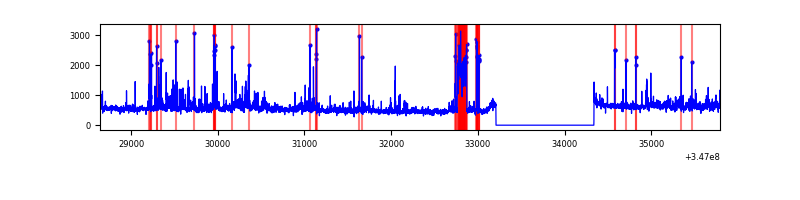 |
Top three noisy pixels from each quadrant. If the there are fewer than three noisy pixels in the level2.evt file, extra rows are filled as -1
| Pixel properties | Quadrant properties | ||||||
|---|---|---|---|---|---|---|---|
| Quadrant | DetID | PixID | Counts | Sigma | Mean | Median | Sigma |
| A | 13 | 254 | 9968 | 61.42 | 750 | 734 | 150.3 |
| A | 3 | 137 | 7064 | 42.11 | 750 | 734 | 150.3 |
| A | 0 | 226 | 6322 | 37.17 | 750 | 734 | 150.3 |
| B | 0 | 230 | 53818 | 382.46 | 741 | 723 | 138.8 |
| B | 10 | 245 | 16827 | 116.0 | 741 | 723 | 138.8 |
| B | 12 | 111 | 16694 | 115.04 | 741 | 723 | 138.8 |
| C | 14 | 238 | 117040 | 689.51 | 725 | 729 | 168.7 |
| C | 7 | 220 | 59837 | 350.4 | 725 | 729 | 168.7 |
| C | 13 | 61 | 4947 | 25.0 | 725 | 729 | 168.7 |
| D | 8 | 195 | 533757 | 3052.03 | 733 | 713 | 174.7 |
| D | 1 | 52 | 228916 | 1306.61 | 733 | 713 | 174.7 |
| D | 2 | 250 | 107454 | 611.16 | 733 | 713 | 174.7 |
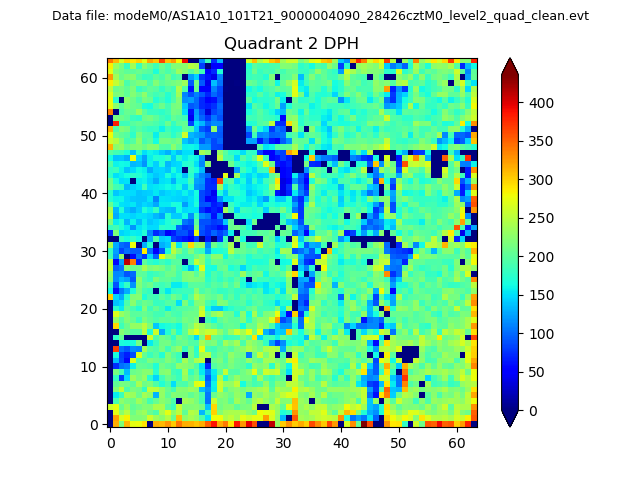
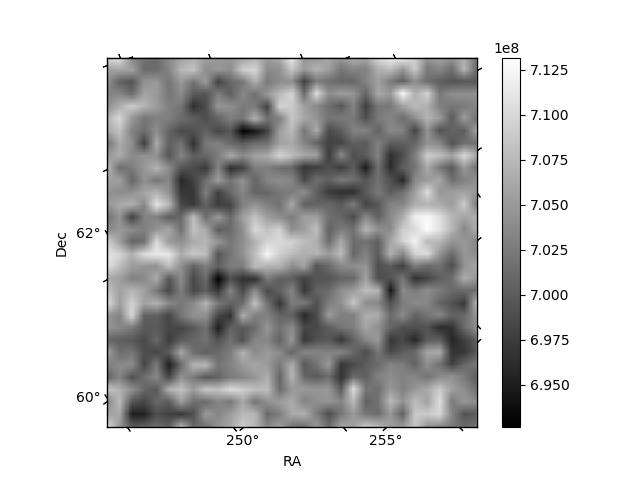
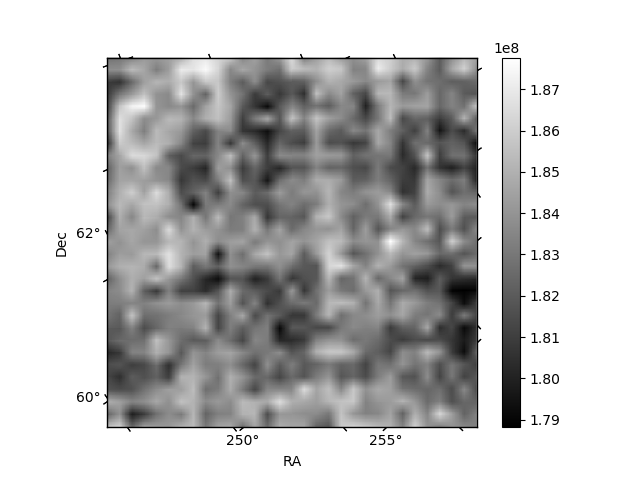
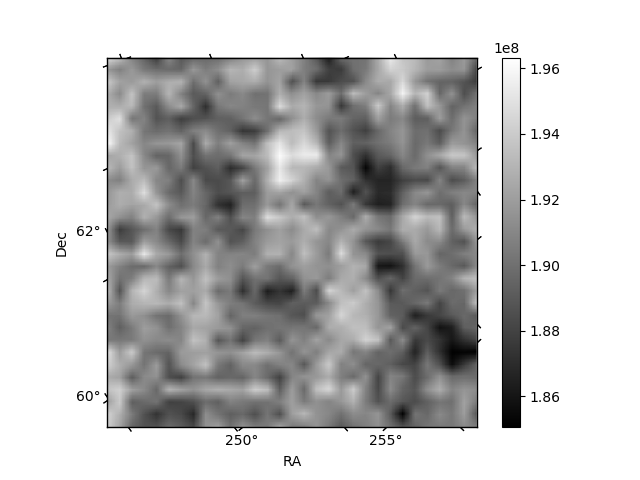
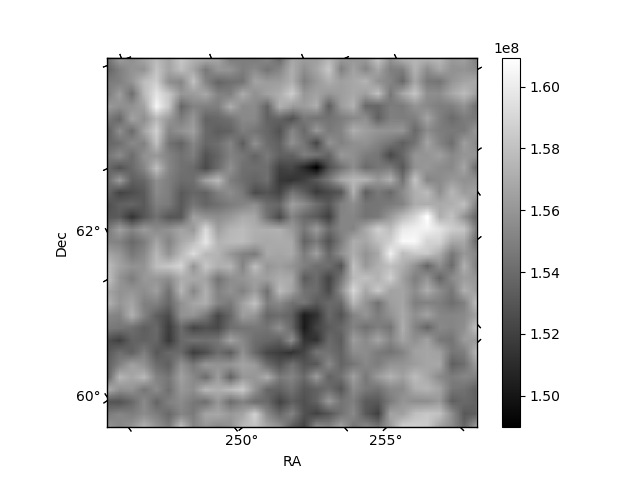
Histogram calculated using DETX and DETY for each event in the final _common_clean file
| Quadrant A | 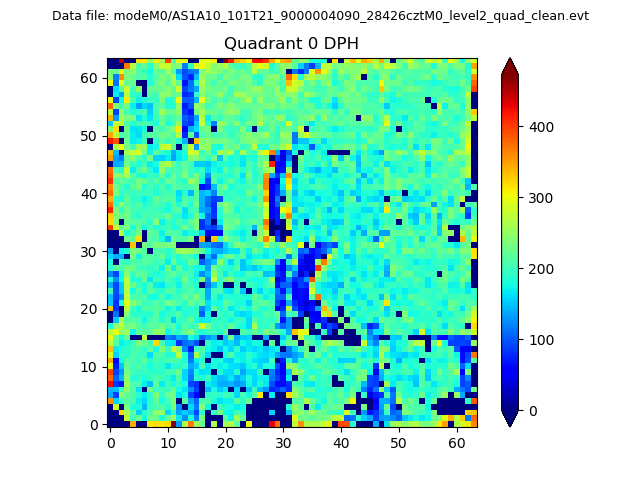 |
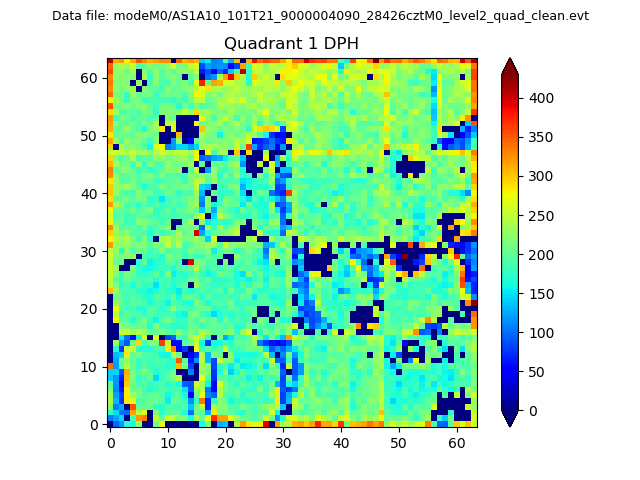 |
Quadrant B |
|---|---|---|---|
| Quadrant D | 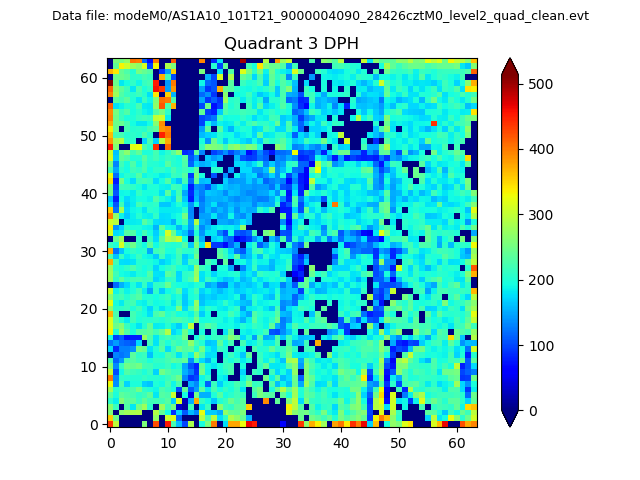 |
 |
Quadrant C |
| Plot type | Count rate plots | Images |
|---|---|---|
| Comparison with Poisson distribution Blue bars denote a histogram of data divided into 1 sec bins. Red curve is a Poisson curve with rate = median count rate of data. |
 |
 |
| Quadrant-wise count rates Data is divided into 100 sec bins |
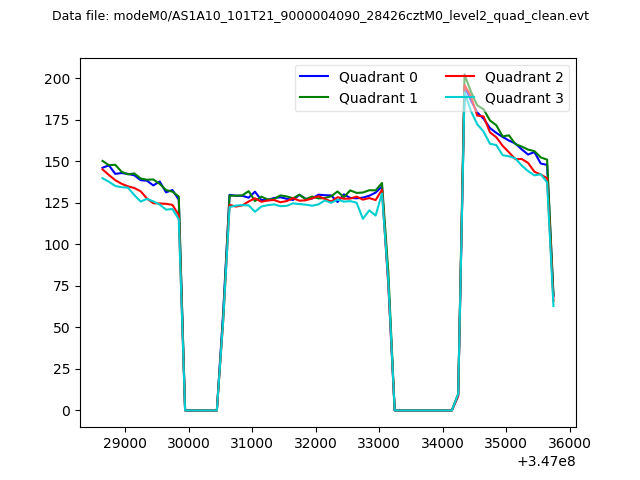 |
|
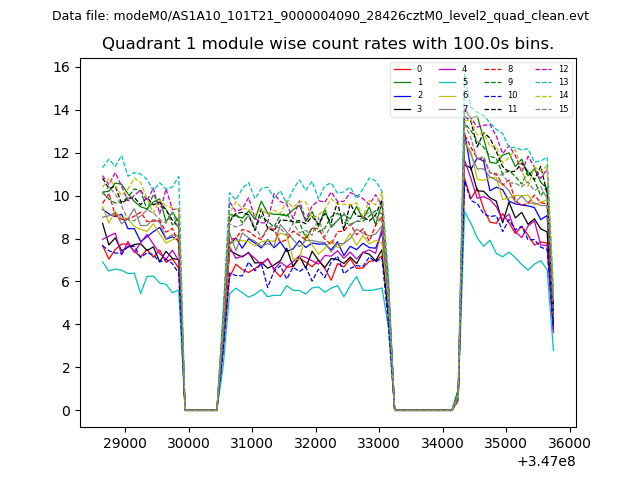
| Module-wise count rates for Quadrant A Data is divided into 100 sec bins |
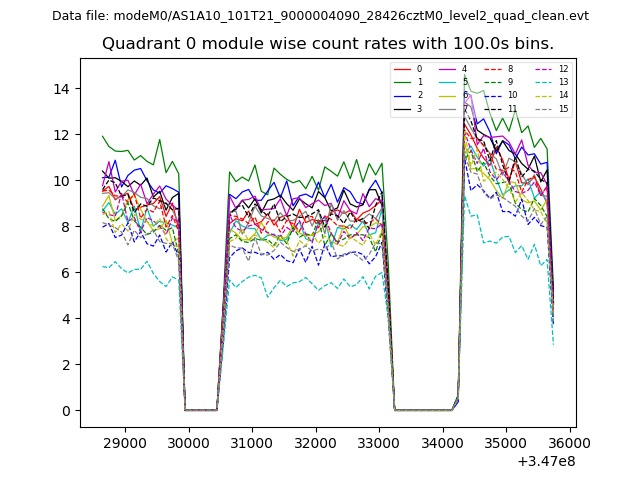 |
 |
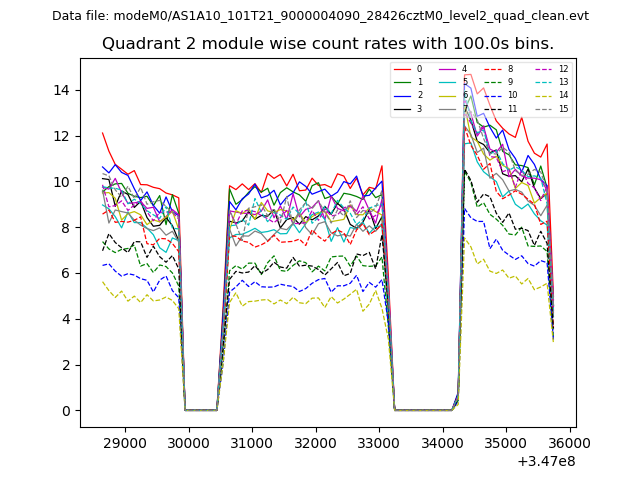
| Module-wise count rates for Quadrant B Data is divided into 100 sec bins |
 |
 |
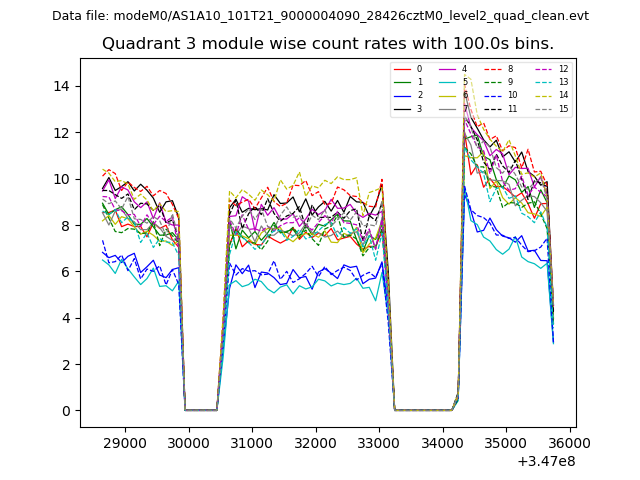
| Module-wise count rates for Quadrant C Data is divided into 100 sec bins |
 |
 |
| Module-wise count rates for Quadrant D Data is divided into 100 sec bins |
 |
 |
| Parameter | Plot |
|---|---|
| CZT HV Monitor | 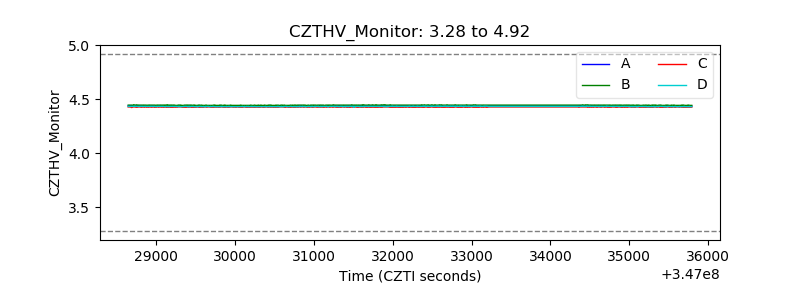 |
| D_VDD | 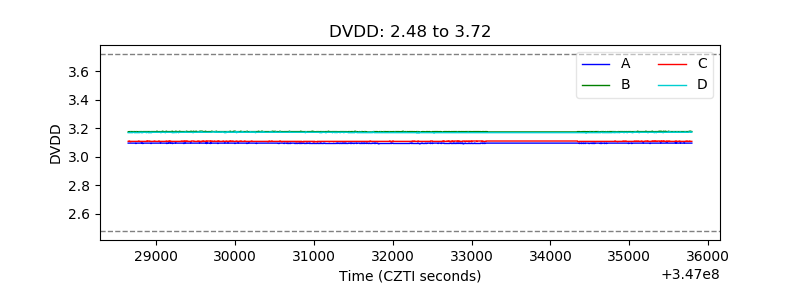 |
| Temperature 1 | 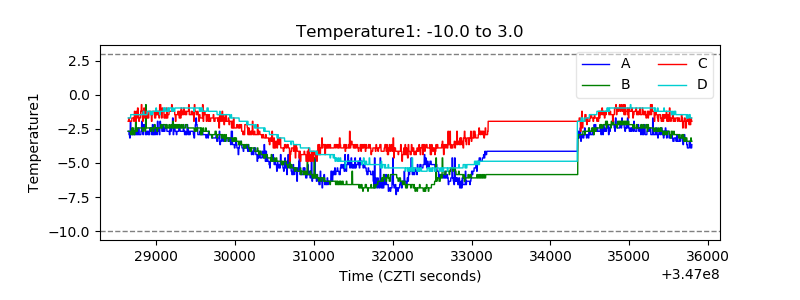 |
| Veto HV Monitor |  |
| Veto LLD | 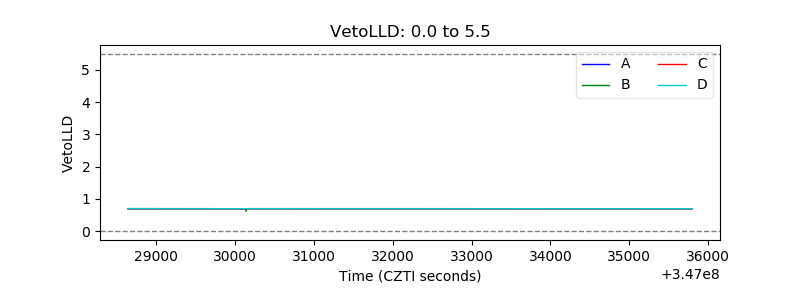 |
| Alpha Counter | 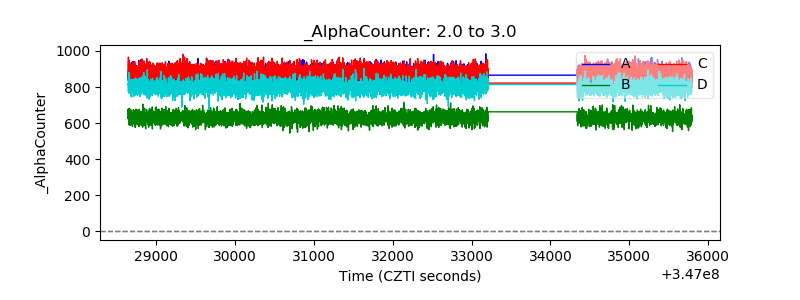 |
| _CPM_Rate | 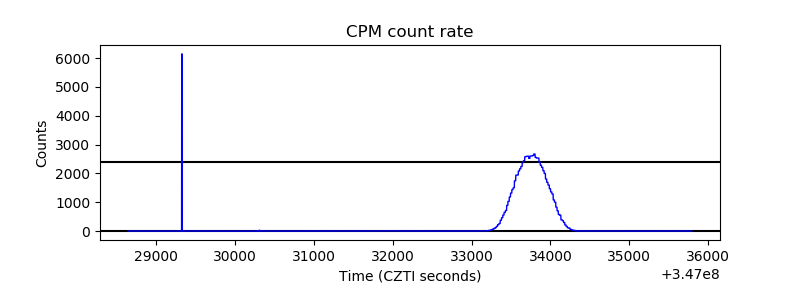 |
| CZT Counter | 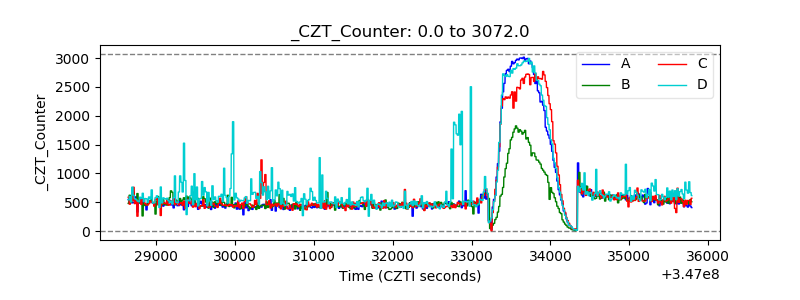 |
| +2.5 Volts monitor |  |
| +5 Volts monitor | 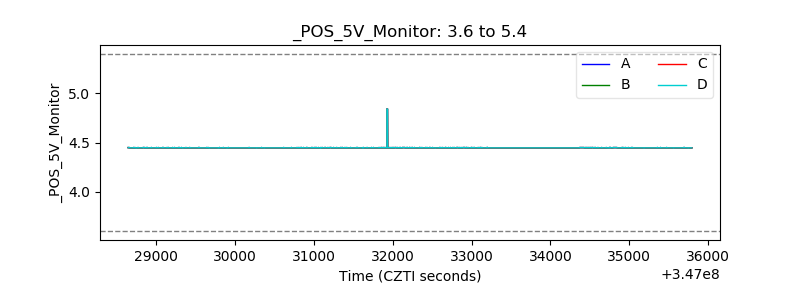 |
| _ROLL_ROT | 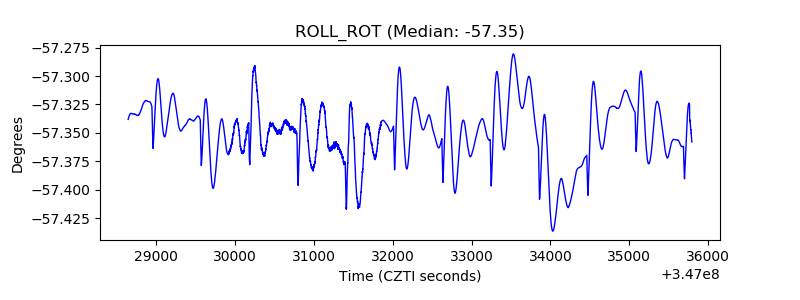 |
| _Roll_DEC | 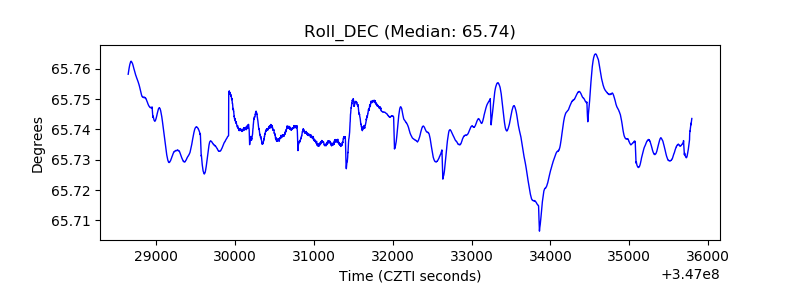 |
| _Roll_RA | 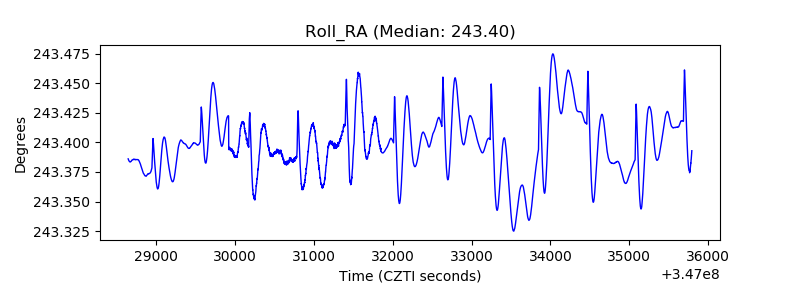 |
| Veto Counter | 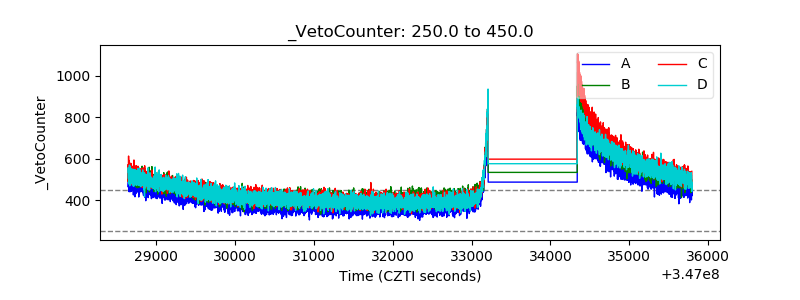 |