| Param | Original file | Final file |
|---|---|---|
| Filename | modeM0/AS1A10_101T21_9000004090_28428cztM0_level2.evt | modeM0/AS1A10_101T21_9000004090_28428cztM0_level2_quad_clean.evt |
| Size (bytes) | 811,411,200 | 185,731,200 |
| Size | 773.8 MB | 177.1 MB |
| Events in quadrant A | 5,196,756 | 1,242,490 |
| Events in quadrant B | 5,422,643 | 1,266,310 |
| Events in quadrant C | 5,353,062 | 1,232,530 |
| Events in quadrant D | 7,905,215 | 1,171,404 |
| Mode M0 | |||
|---|---|---|---|
| Quadrant | BADHDUFLAG | Total packets | Discarded packets |
| A | 0 | 22391 | 0 |
| B | 0 | 22794 | 0 |
| C | 0 | 22549 | 0 |
| D | 0 | 30512 | 0 |
| Mode M9 | |||
|---|---|---|---|
| Quadrant | BADHDUFLAG | Total packets | Discarded packets |
| A | 0 | 26 | 0 |
| B | 0 | 26 | 0 |
| C | 0 | 26 | 0 |
| D | 0 | 26 | 0 |
| Quadrant | Total seconds | Saturated seconds | Saturation percentage |
|---|---|---|---|
| A | 10296 | 119 | 1.155789% |
| B | 10297 | 162 | 1.573274% |
| C | 10297 | 185 | 1.796640% |
| D | 10295 | 587 | 5.701797% |
Noise dominated data is calculated using 1-second bins in cleaned event files. If a bin has >2000 counts, and if more than 50% of those come from <1% of pixels, then it is considered to be noise-dominated and hence unusable.
| Quadrant | # 1 sec bins | Bins with >0 counts | Bins with >2000 counts | High rate bins dominated by noise | Noise dominated (total time) | Noise dominated (detector-on time) | Marked lightcurve |
|---|---|---|---|---|---|---|---|
| A | 12881 | 10297 | 0 | 0 | 0.00% | 0.00% | 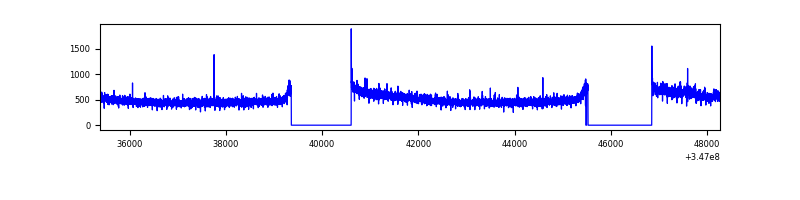 |
| B | 12882 | 10298 | 28 | 28 | 0.22% | 0.27% | 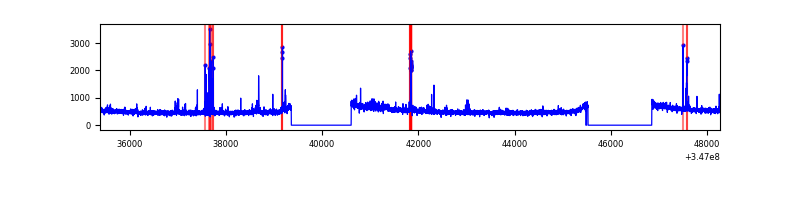 |
| C | 12882 | 10298 | 2 | 2 | 0.02% | 0.02% | 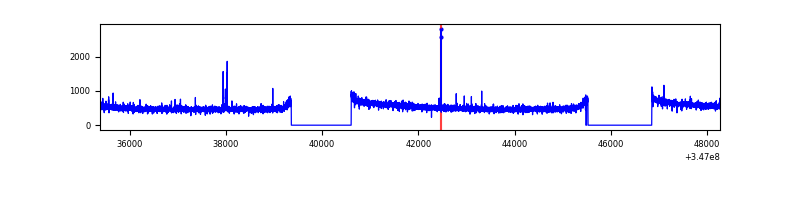 |
| D | 12881 | 10295 | 442 | 442 | 3.43% | 4.29% | 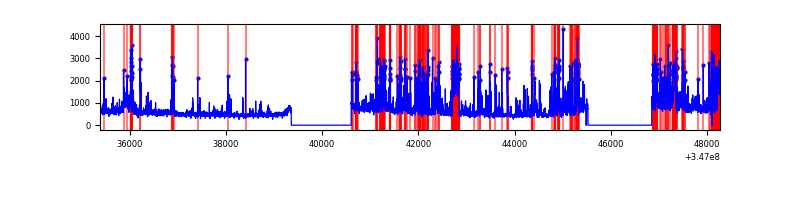 |
Top three noisy pixels from each quadrant. If the there are fewer than three noisy pixels in the level2.evt file, extra rows are filled as -1
| Pixel properties | Quadrant properties | ||||||
|---|---|---|---|---|---|---|---|
| Quadrant | DetID | PixID | Counts | Sigma | Mean | Median | Sigma |
| A | 6 | 16 | 57072 | 213.62 | 1330 | 1304 | 261.1 |
| A | 13 | 254 | 16197 | 57.05 | 1330 | 1304 | 261.1 |
| A | 3 | 137 | 11996 | 40.96 | 1330 | 1304 | 261.1 |
| B | 10 | 245 | 155227 | 642.84 | 1322 | 1291 | 239.5 |
| B | 0 | 230 | 53073 | 216.24 | 1322 | 1291 | 239.5 |
| B | 12 | 111 | 29012 | 115.76 | 1322 | 1291 | 239.5 |
| C | 14 | 238 | 213600 | 708.01 | 1305 | 1314 | 299.8 |
| C | 7 | 220 | 46157 | 149.56 | 1305 | 1314 | 299.8 |
| C | 13 | 61 | 8945 | 25.45 | 1305 | 1314 | 299.8 |
| D | 1 | 52 | 1578732 | 5230.02 | 1286 | 1253 | 301.6 |
| D | 8 | 195 | 744974 | 2465.75 | 1286 | 1253 | 301.6 |
| D | 2 | 250 | 438178 | 1448.59 | 1286 | 1253 | 301.6 |
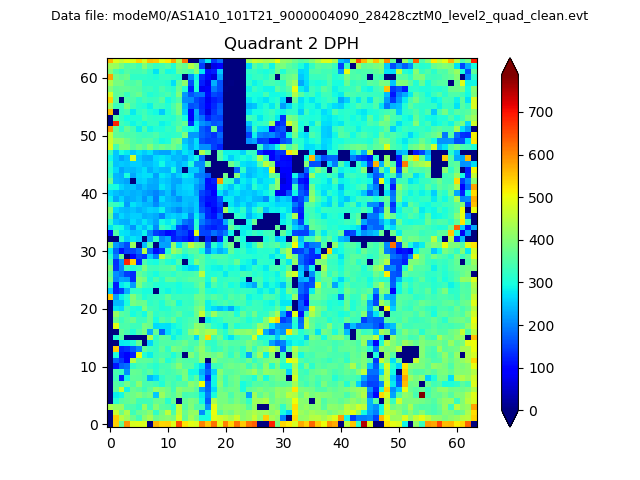
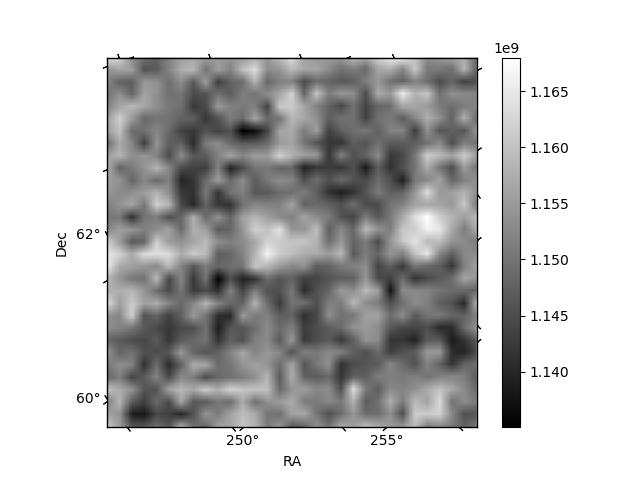
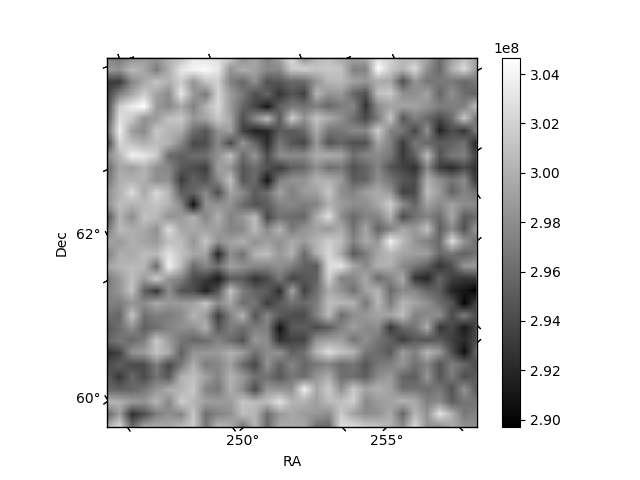
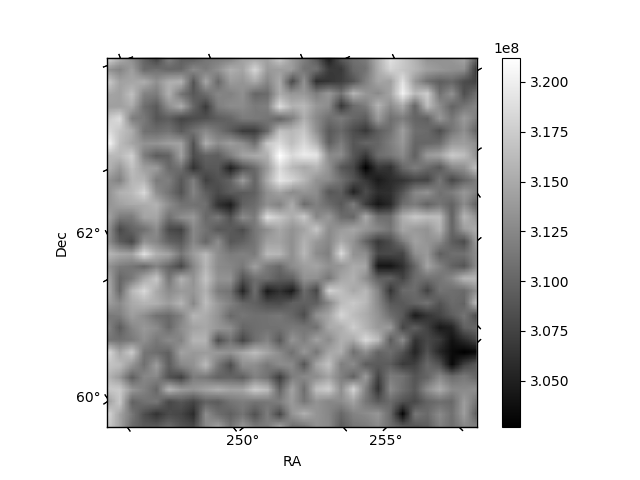
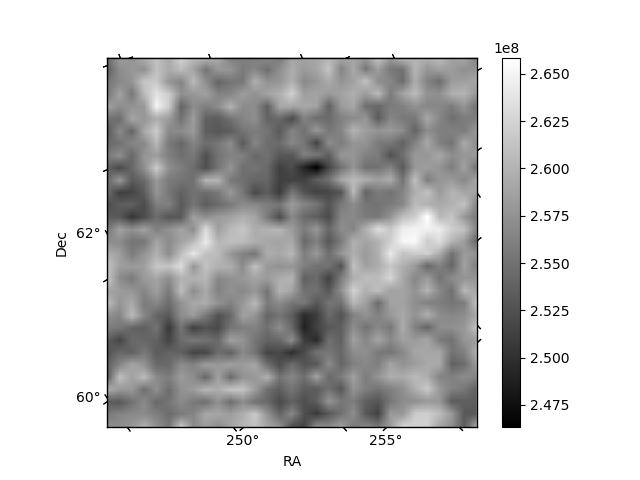
Histogram calculated using DETX and DETY for each event in the final _common_clean file
| Quadrant A | 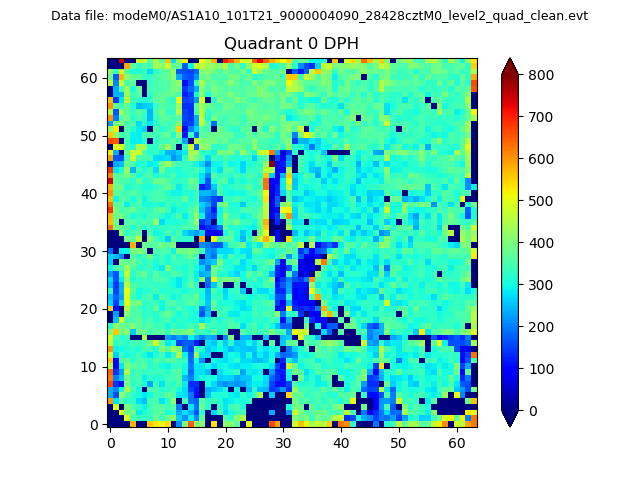 |
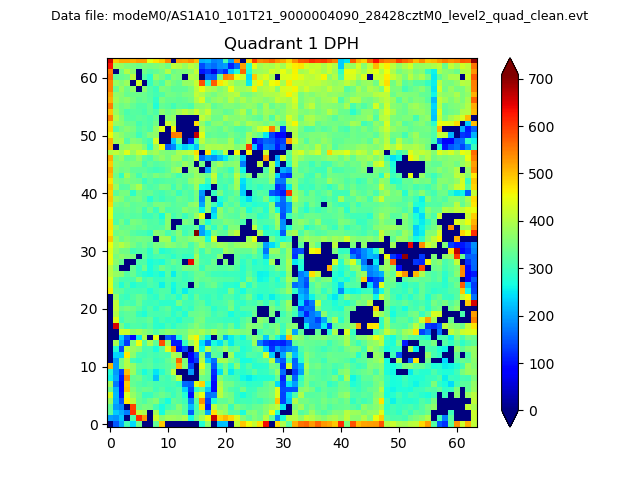 |
Quadrant B |
|---|---|---|---|
| Quadrant D | 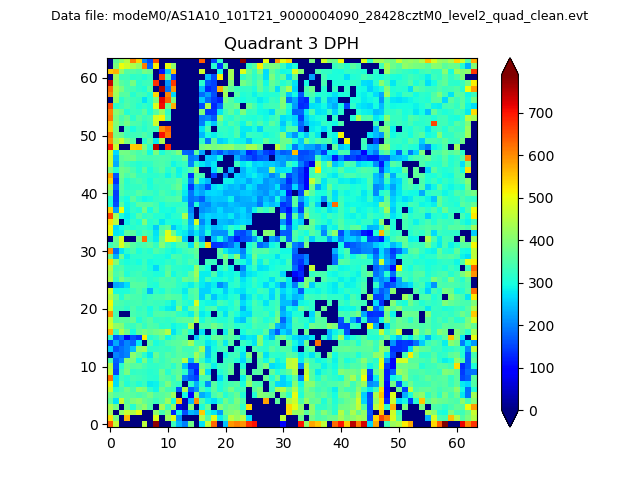 |
 |
Quadrant C |
| Plot type | Count rate plots | Images |
|---|---|---|
| Comparison with Poisson distribution Blue bars denote a histogram of data divided into 1 sec bins. Red curve is a Poisson curve with rate = median count rate of data. |
 |
 |
| Quadrant-wise count rates Data is divided into 100 sec bins |
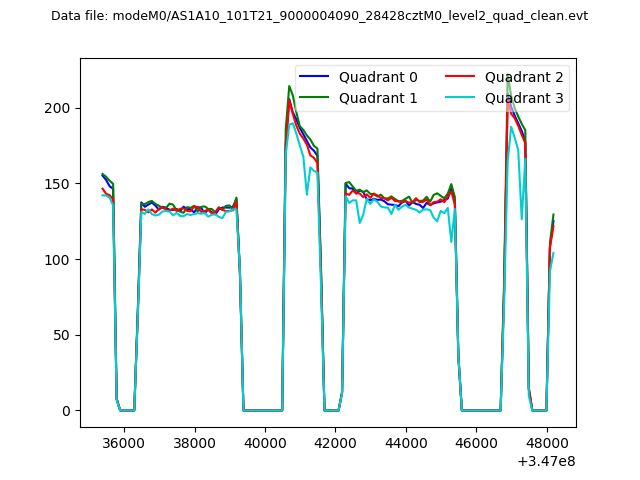 |
|
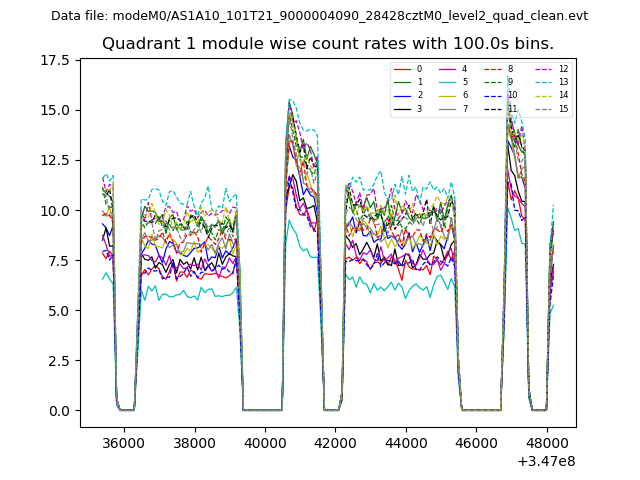
| Module-wise count rates for Quadrant A Data is divided into 100 sec bins |
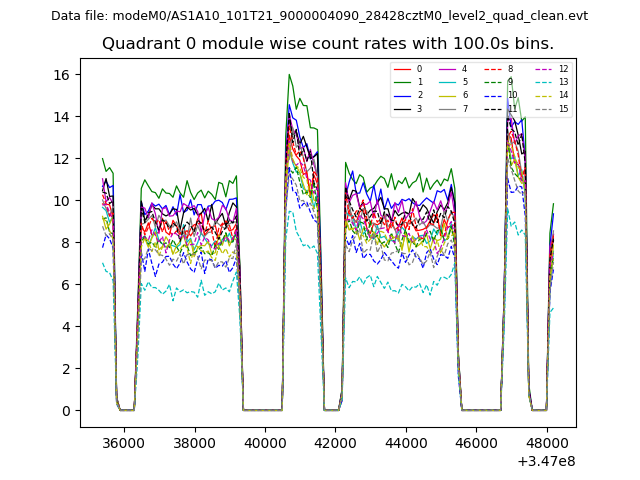 |
 |
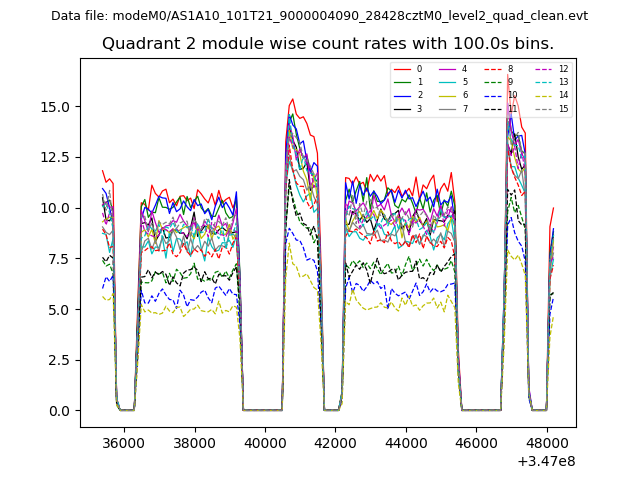
| Module-wise count rates for Quadrant B Data is divided into 100 sec bins |
 |
 |
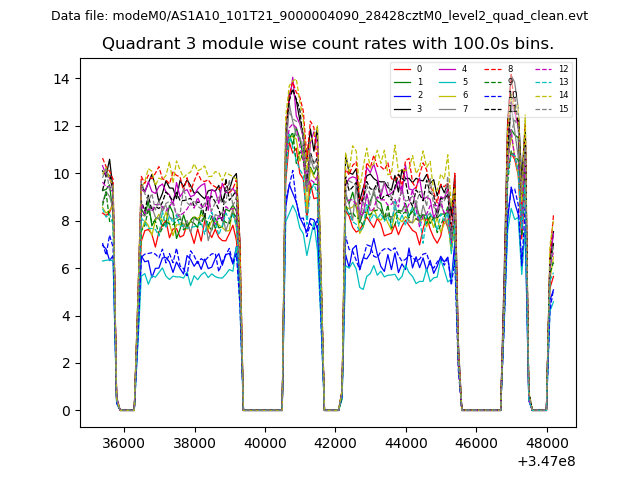
| Module-wise count rates for Quadrant C Data is divided into 100 sec bins |
 |
 |
| Module-wise count rates for Quadrant D Data is divided into 100 sec bins |
 |
 |
| Parameter | Plot |
|---|---|
| CZT HV Monitor | 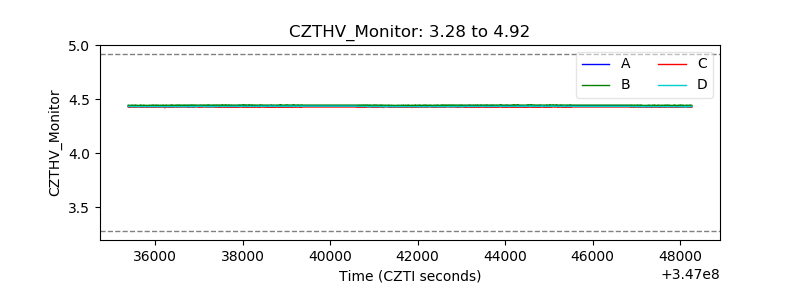 |
| D_VDD | 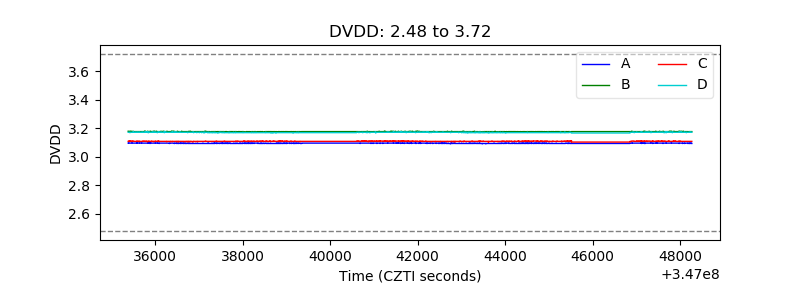 |
| Temperature 1 | 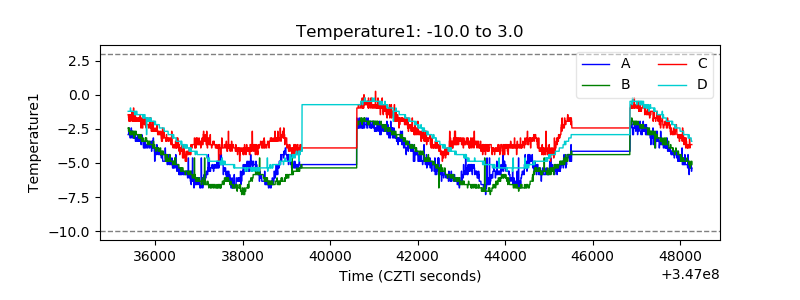 |
| Veto HV Monitor | 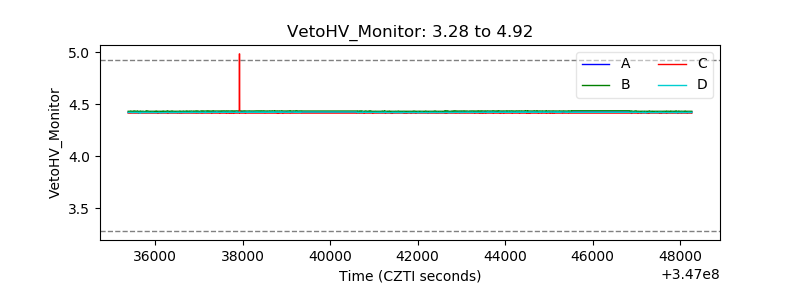 |
| Veto LLD | 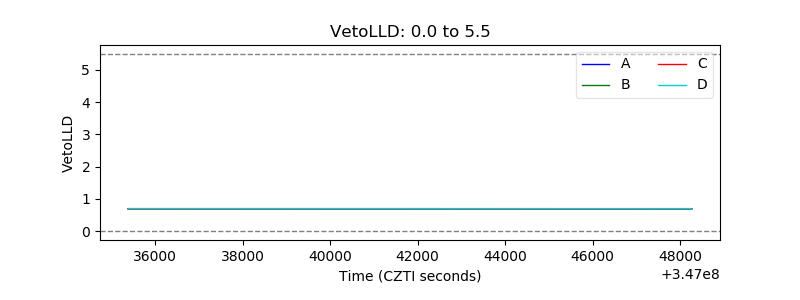 |
| Alpha Counter | 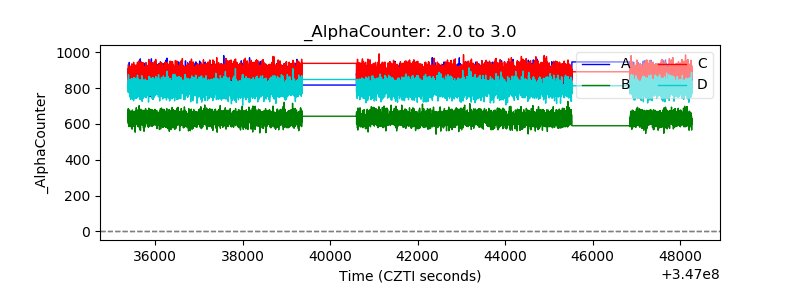 |
| _CPM_Rate | 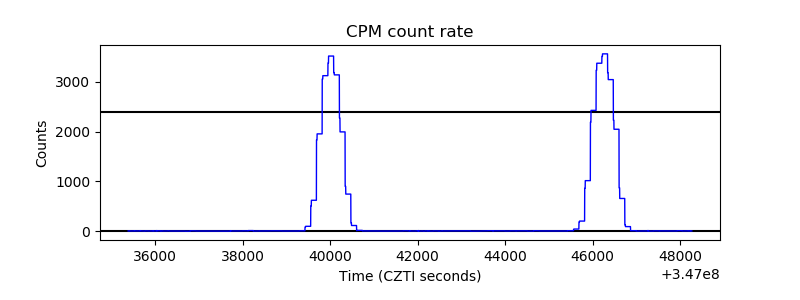 |
| CZT Counter |  |
| +2.5 Volts monitor |  |
| +5 Volts monitor | 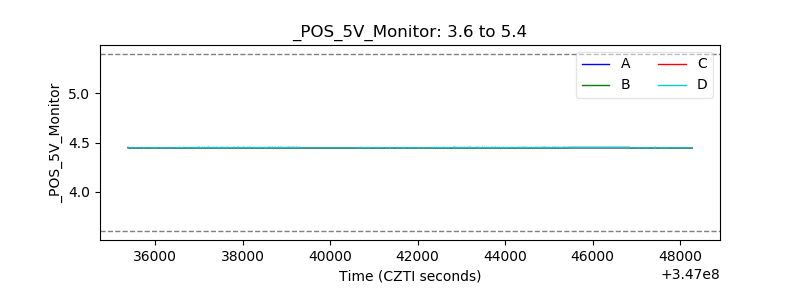 |
| _ROLL_ROT | 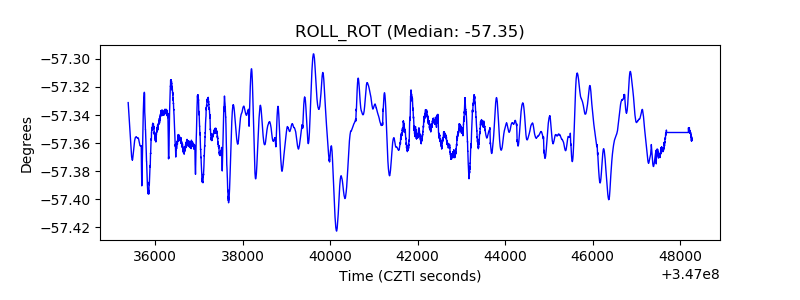 |
| _Roll_DEC | 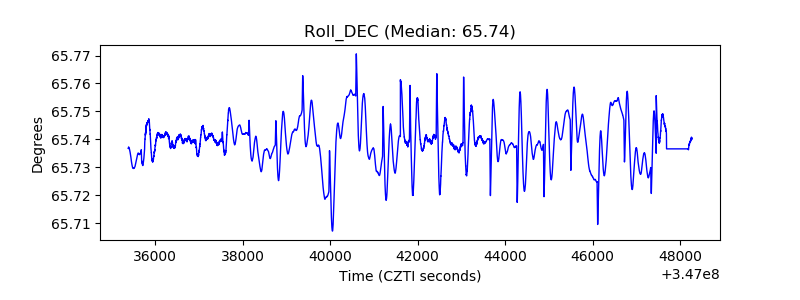 |
| _Roll_RA | 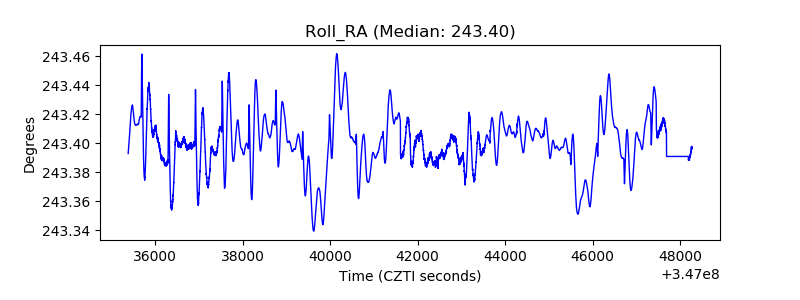 |
| Veto Counter | 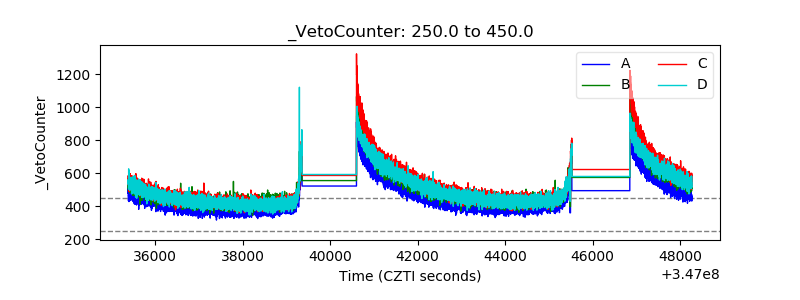 |