| Param | Original file | Final file |
|---|---|---|
| Filename | modeM0/AS1A10_101T21_9000004090_28429cztM0_level2.evt | modeM0/AS1A10_101T21_9000004090_28429cztM0_level2_quad_clean.evt |
| Size (bytes) | 563,195,520 | 110,473,920 |
| Size | 537.1 MB | 105.4 MB |
| Events in quadrant A | 3,282,538 | 744,562 |
| Events in quadrant B | 3,443,065 | 763,896 |
| Events in quadrant C | 3,328,227 | 743,488 |
| Events in quadrant D | 6,589,889 | 668,156 |
| Mode M0 | |||
|---|---|---|---|
| Quadrant | BADHDUFLAG | Total packets | Discarded packets |
| A | 0 | 13728 | 0 |
| B | 0 | 14129 | 0 |
| C | 0 | 13891 | 0 |
| D | 0 | 23783 | 0 |
| Mode M9 | |||
|---|---|---|---|
| Quadrant | BADHDUFLAG | Total packets | Discarded packets |
| A | 0 | 15 | 0 |
| B | 0 | 16 | 0 |
| C | 0 | 16 | 0 |
| D | 0 | 16 | 0 |
| Quadrant | Total seconds | Saturated seconds | Saturation percentage |
|---|---|---|---|
| A | 6093 | 89 | 1.460693% |
| B | 6093 | 123 | 2.018710% |
| C | 6092 | 162 | 2.659225% |
| D | 6092 | 892 | 14.642154% |
Noise dominated data is calculated using 1-second bins in cleaned event files. If a bin has >2000 counts, and if more than 50% of those come from <1% of pixels, then it is considered to be noise-dominated and hence unusable.
| Quadrant | # 1 sec bins | Bins with >0 counts | Bins with >2000 counts | High rate bins dominated by noise | Noise dominated (total time) | Noise dominated (detector-on time) | Marked lightcurve |
|---|---|---|---|---|---|---|---|
| A | 7428 | 6093 | 0 | 0 | 0.00% | 0.00% | 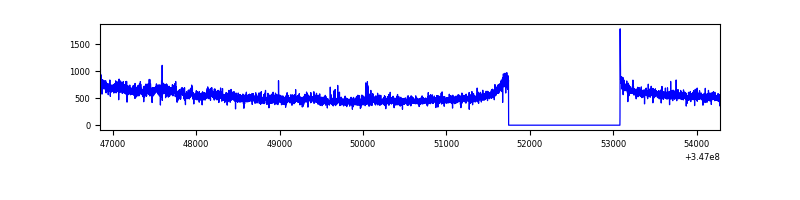 |
| B | 7428 | 6093 | 23 | 23 | 0.31% | 0.38% | 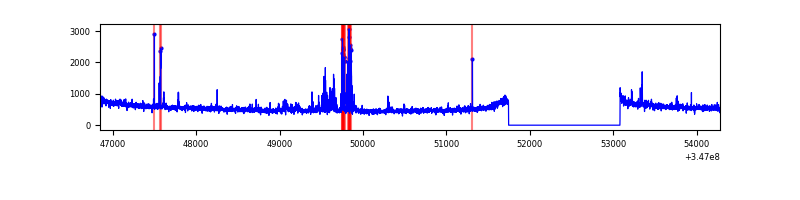 |
| C | 7427 | 6092 | 0 | 0 | 0.00% | 0.00% | 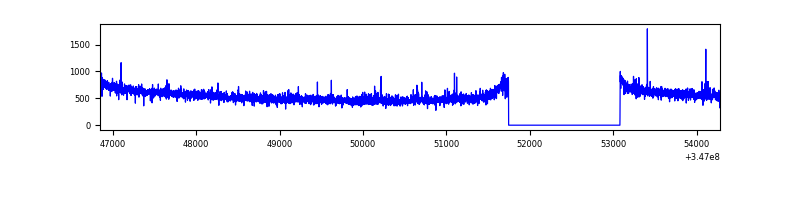 |
| D | 7427 | 6092 | 723 | 723 | 9.73% | 11.87% | 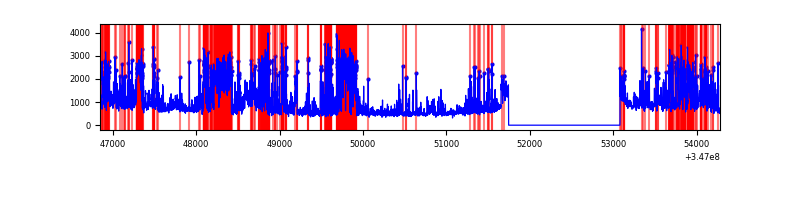 |
Top three noisy pixels from each quadrant. If the there are fewer than three noisy pixels in the level2.evt file, extra rows are filled as -1
| Pixel properties | Quadrant properties | ||||||
|---|---|---|---|---|---|---|---|
| Quadrant | DetID | PixID | Counts | Sigma | Mean | Median | Sigma |
| A | 6 | 16 | 107681 | 667.2 | 820 | 805 | 160.2 |
| A | 13 | 254 | 9559 | 54.65 | 820 | 805 | 160.2 |
| A | 8 | 192 | 7532 | 41.99 | 820 | 805 | 160.2 |
| B | 15 | 222 | 104812 | 696.45 | 818 | 800 | 149.3 |
| B | 10 | 245 | 55107 | 363.63 | 818 | 800 | 149.3 |
| B | 0 | 190 | 24118 | 156.14 | 818 | 800 | 149.3 |
| C | 14 | 238 | 134650 | 726.13 | 808 | 816 | 184.3 |
| C | 7 | 220 | 18096 | 93.75 | 808 | 816 | 184.3 |
| C | 3 | 233 | 10983 | 55.16 | 808 | 816 | 184.3 |
| D | 1 | 52 | 2141721 | 11946.81 | 768 | 750 | 179.2 |
| D | 8 | 195 | 618032 | 3444.49 | 768 | 750 | 179.2 |
| D | 7 | 238 | 493954 | 2752.12 | 768 | 750 | 179.2 |
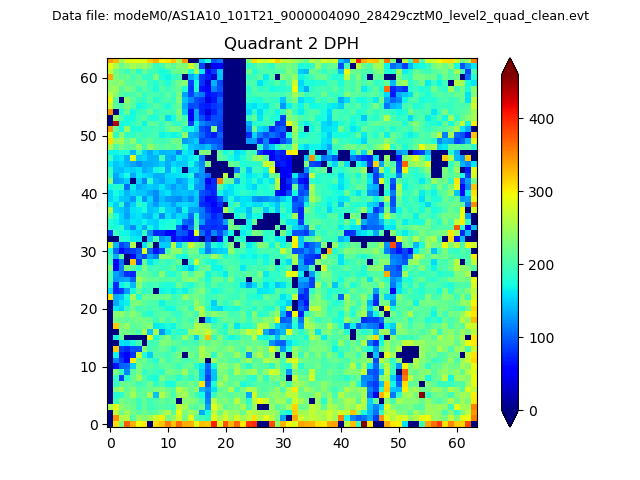
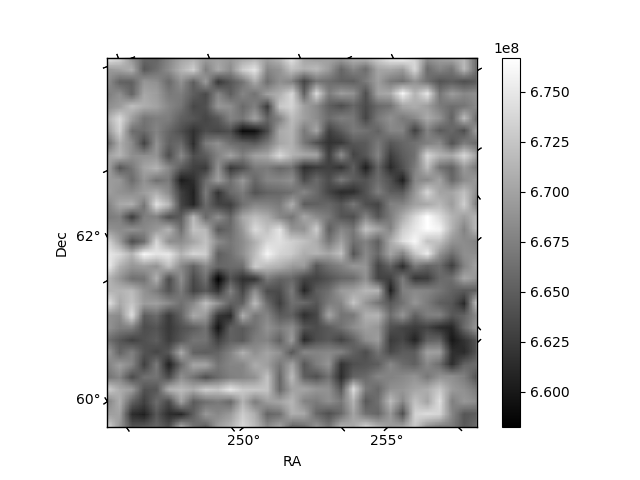
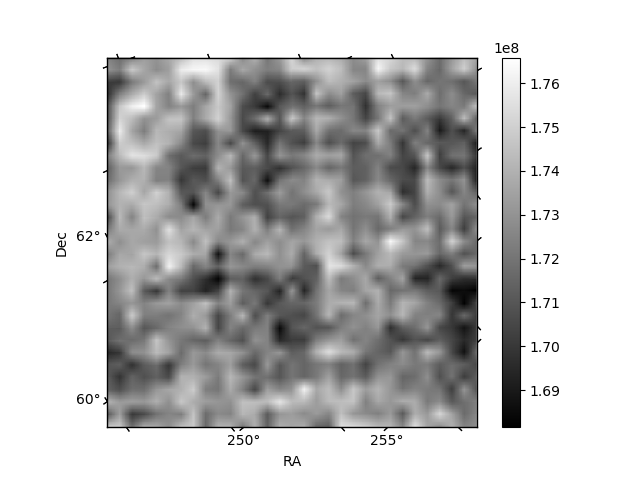
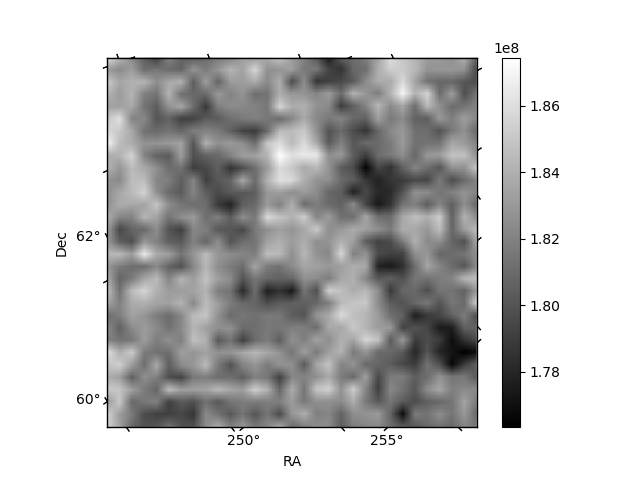
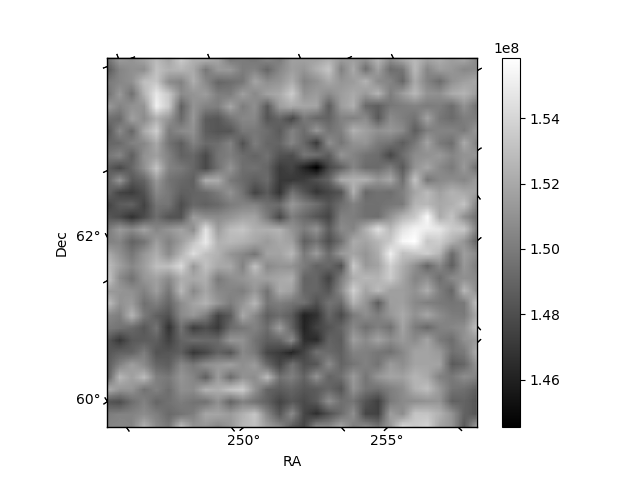
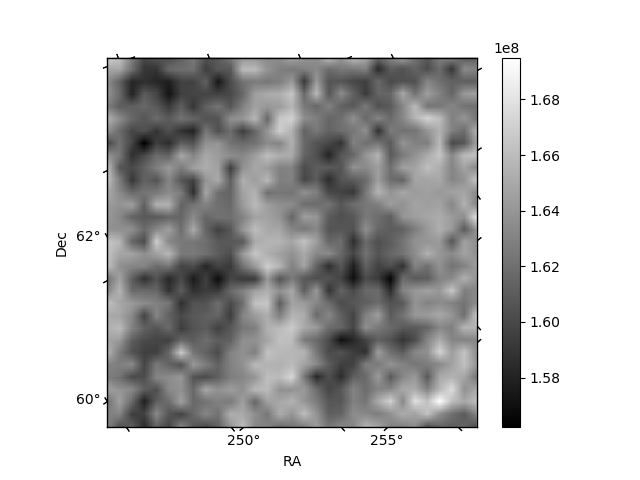
Histogram calculated using DETX and DETY for each event in the final _common_clean file
| Quadrant A | 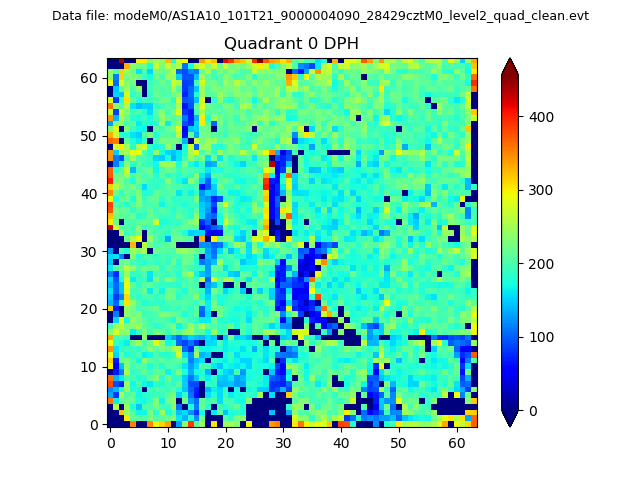 |
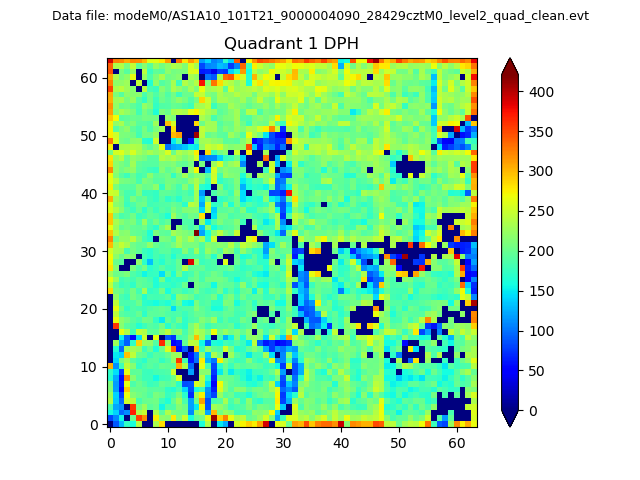 |
Quadrant B |
|---|---|---|---|
| Quadrant D | 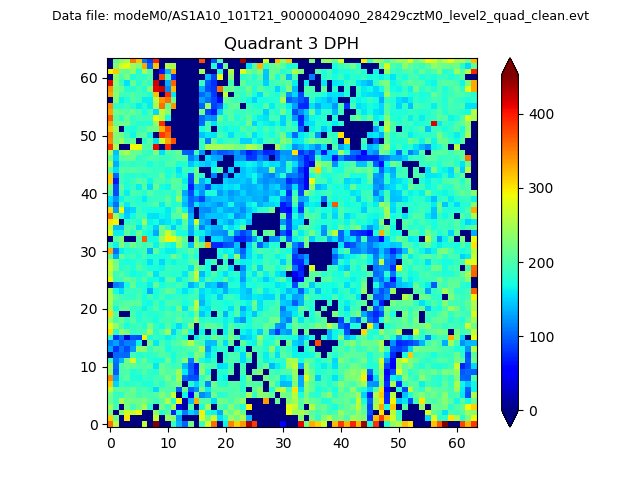 |
 |
Quadrant C |
| Plot type | Count rate plots | Images |
|---|---|---|
| Comparison with Poisson distribution Blue bars denote a histogram of data divided into 1 sec bins. Red curve is a Poisson curve with rate = median count rate of data. |
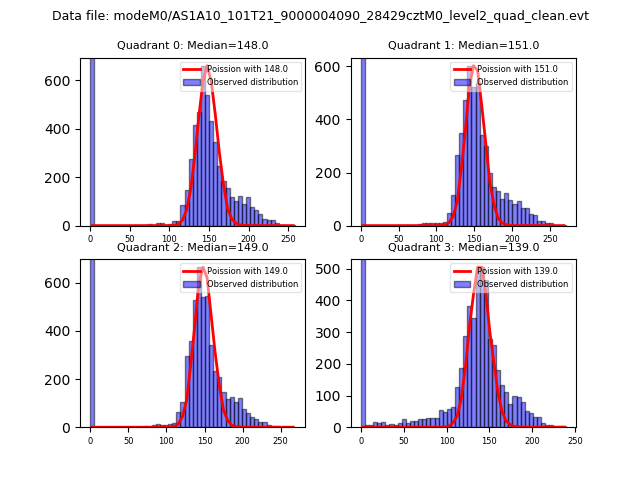 |
 |
| Quadrant-wise count rates Data is divided into 100 sec bins |
 |
|
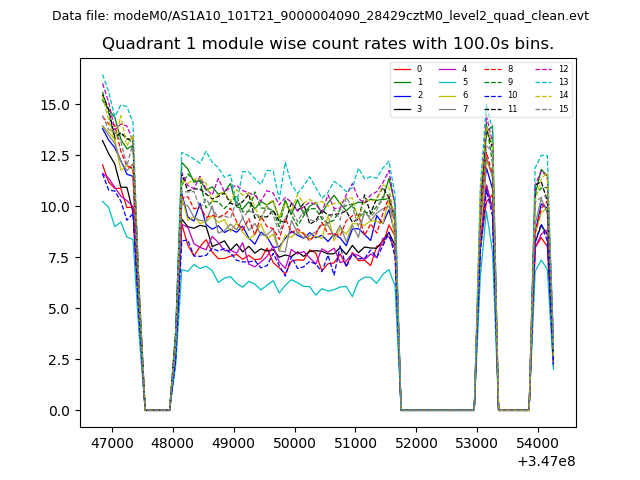
| Module-wise count rates for Quadrant A Data is divided into 100 sec bins |
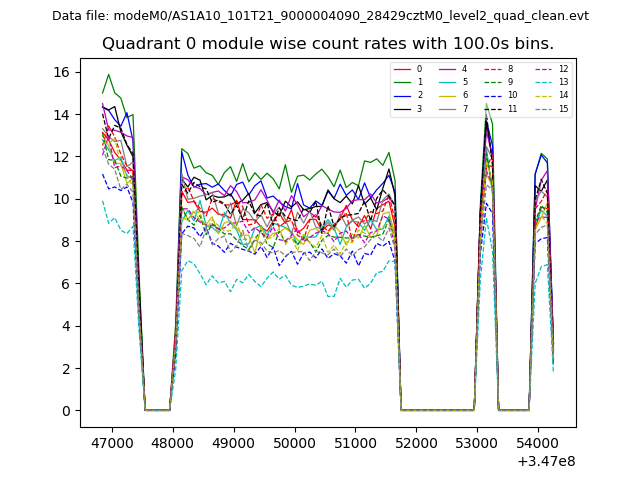 |
 |
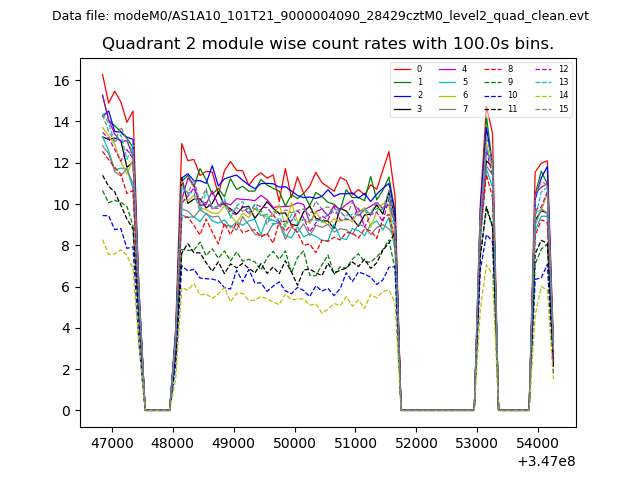
| Module-wise count rates for Quadrant B Data is divided into 100 sec bins |
 |
 |
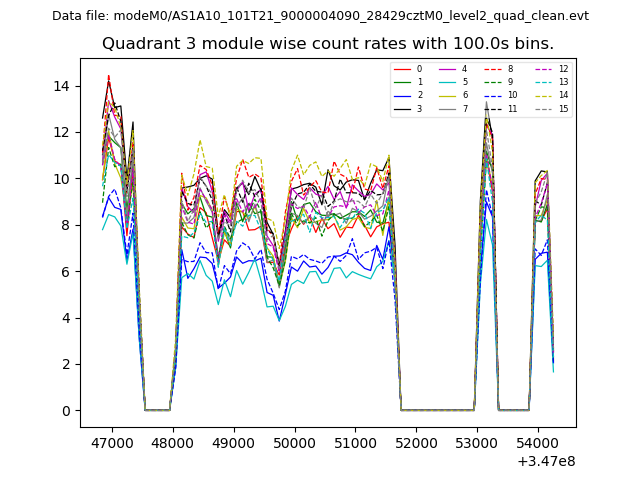
| Module-wise count rates for Quadrant C Data is divided into 100 sec bins |
 |
 |
| Module-wise count rates for Quadrant D Data is divided into 100 sec bins |
 |
 |
| Parameter | Plot |
|---|---|
| CZT HV Monitor | 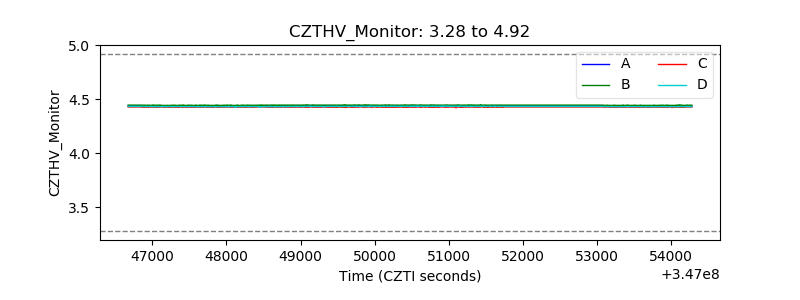 |
| D_VDD | 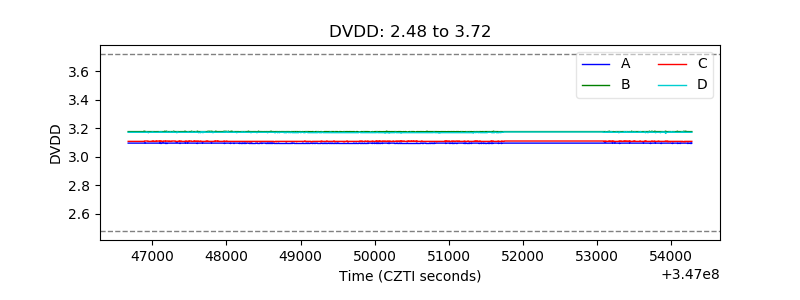 |
| Temperature 1 | 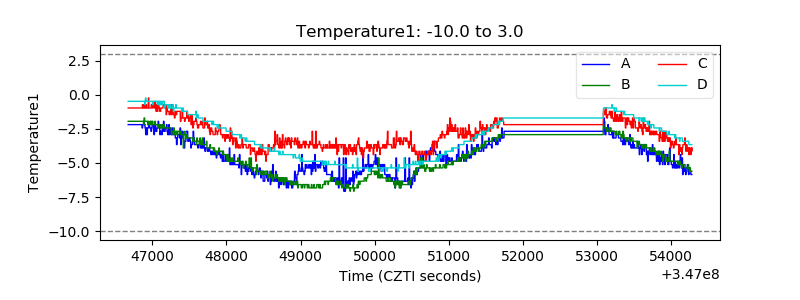 |
| Veto HV Monitor | 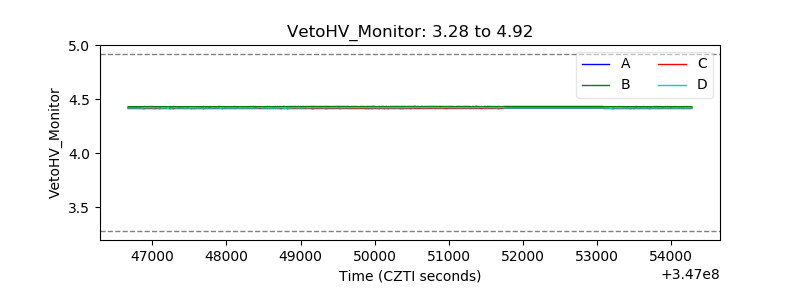 |
| Veto LLD | 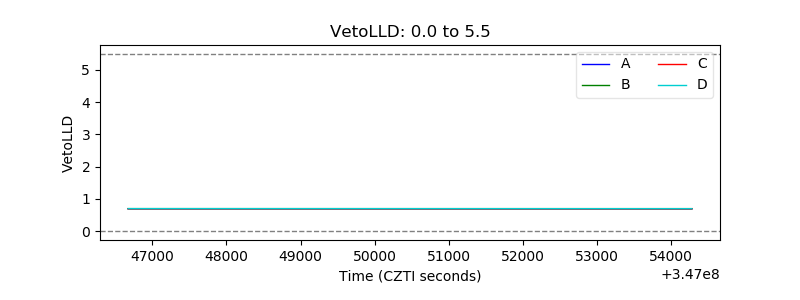 |
| Alpha Counter |  |
| _CPM_Rate | 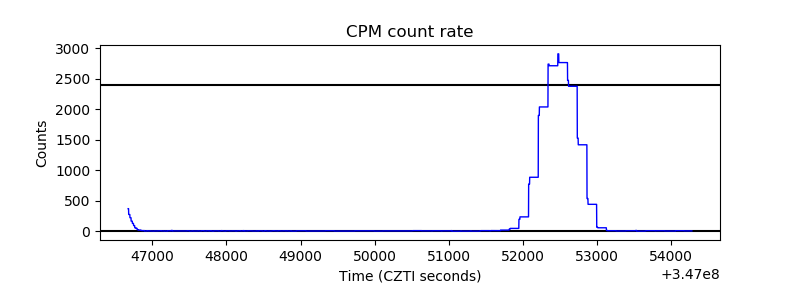 |
| CZT Counter | 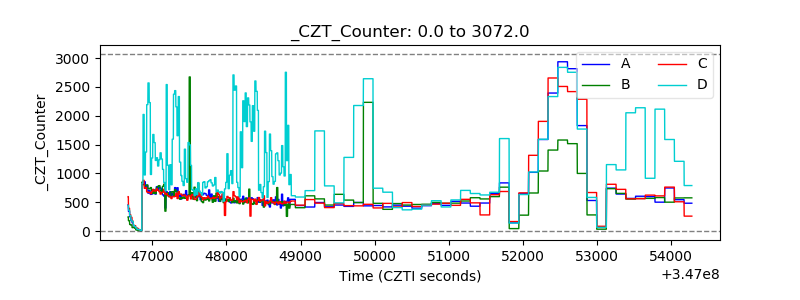 |
| +2.5 Volts monitor |  |
| +5 Volts monitor |  |
| _ROLL_ROT | 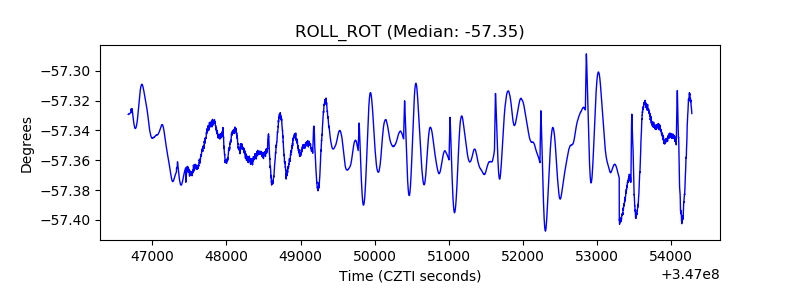 |
| _Roll_DEC | 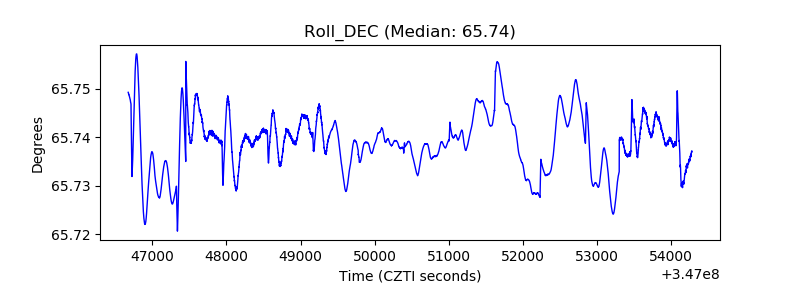 |
| _Roll_RA | 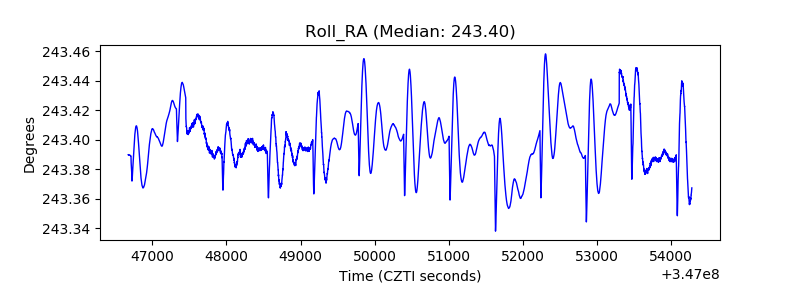 |
| Veto Counter | 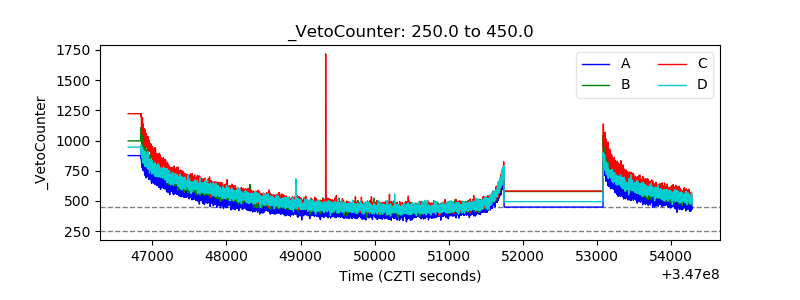 |