| Param | Original file | Final file |
|---|---|---|
| Filename | modeM0/AS1A10_101T21_9000004090_28430cztM0_level2.evt | modeM0/AS1A10_101T21_9000004090_28430cztM0_level2_quad_clean.evt |
| Size (bytes) | 529,107,840 | 112,158,720 |
| Size | 504.6 MB | 107.0 MB |
| Events in quadrant A | 3,127,779 | 753,622 |
| Events in quadrant B | 3,282,525 | 773,091 |
| Events in quadrant C | 3,286,093 | 751,758 |
| Events in quadrant D | 5,901,827 | 680,291 |
| Mode M0 | |||
|---|---|---|---|
| Quadrant | BADHDUFLAG | Total packets | Discarded packets |
| A | 0 | 13302 | 0 |
| B | 0 | 13675 | 0 |
| C | 0 | 13741 | 0 |
| D | 0 | 21745 | 0 |
| Mode M9 | |||
|---|---|---|---|
| Quadrant | BADHDUFLAG | Total packets | Discarded packets |
| A | 0 | 21 | 0 |
| B | 0 | 22 | 0 |
| C | 0 | 22 | 0 |
| D | 0 | 22 | 0 |
| Quadrant | Total seconds | Saturated seconds | Saturation percentage |
|---|---|---|---|
| A | 6275 | 63 | 1.003984% |
| B | 6275 | 85 | 1.354582% |
| C | 6275 | 147 | 2.342629% |
| D | 6275 | 848 | 13.513944% |
Noise dominated data is calculated using 1-second bins in cleaned event files. If a bin has >2000 counts, and if more than 50% of those come from <1% of pixels, then it is considered to be noise-dominated and hence unusable.
| Quadrant | # 1 sec bins | Bins with >0 counts | Bins with >2000 counts | High rate bins dominated by noise | Noise dominated (total time) | Noise dominated (detector-on time) | Marked lightcurve |
|---|---|---|---|---|---|---|---|
| A | 7595 | 6276 | 0 | 0 | 0.00% | 0.00% | 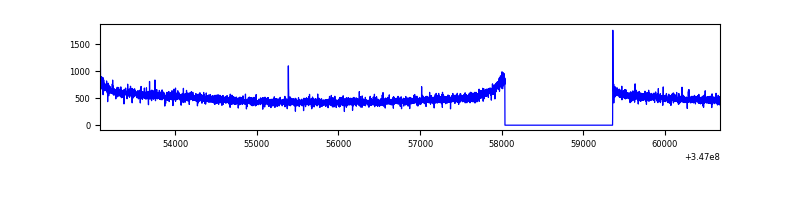 |
| B | 7595 | 6275 | 0 | 0 | 0.00% | 0.00% | 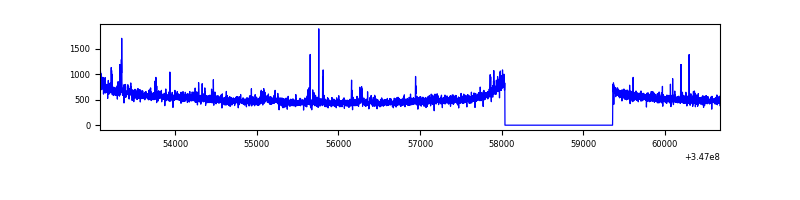 |
| C | 7595 | 6275 | 0 | 0 | 0.00% | 0.00% | 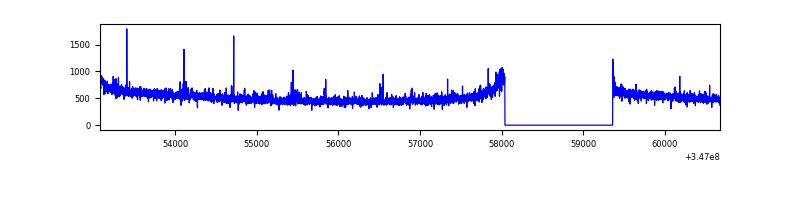 |
| D | 7594 | 6275 | 727 | 727 | 9.57% | 11.59% | 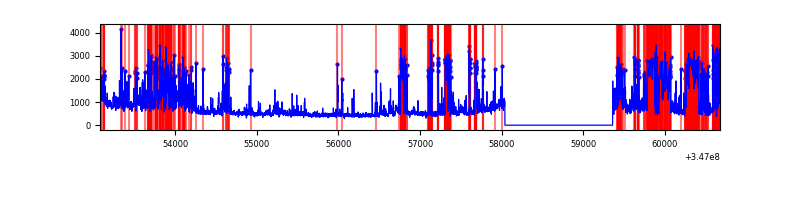 |
Top three noisy pixels from each quadrant. If the there are fewer than three noisy pixels in the level2.evt file, extra rows are filled as -1
| Pixel properties | Quadrant properties | ||||||
|---|---|---|---|---|---|---|---|
| Quadrant | DetID | PixID | Counts | Sigma | Mean | Median | Sigma |
| A | 13 | 254 | 10767 | 62.25 | 807 | 791 | 160.2 |
| A | 8 | 192 | 8744 | 49.63 | 807 | 791 | 160.2 |
| A | 3 | 137 | 7575 | 42.33 | 807 | 791 | 160.2 |
| B | 10 | 245 | 40186 | 262.85 | 809 | 789 | 149.9 |
| B | 0 | 230 | 30095 | 195.53 | 809 | 789 | 149.9 |
| B | 0 | 190 | 22424 | 144.35 | 809 | 789 | 149.9 |
| C | 14 | 238 | 130114 | 714.53 | 792 | 800 | 181.0 |
| C | 7 | 220 | 41485 | 224.81 | 792 | 800 | 181.0 |
| C | 3 | 233 | 10816 | 55.34 | 792 | 800 | 181.0 |
| D | 1 | 52 | 2134999 | 12110.99 | 750 | 731 | 176.2 |
| D | 8 | 195 | 441386 | 2500.51 | 750 | 731 | 176.2 |
| D | 2 | 250 | 207082 | 1170.95 | 750 | 731 | 176.2 |
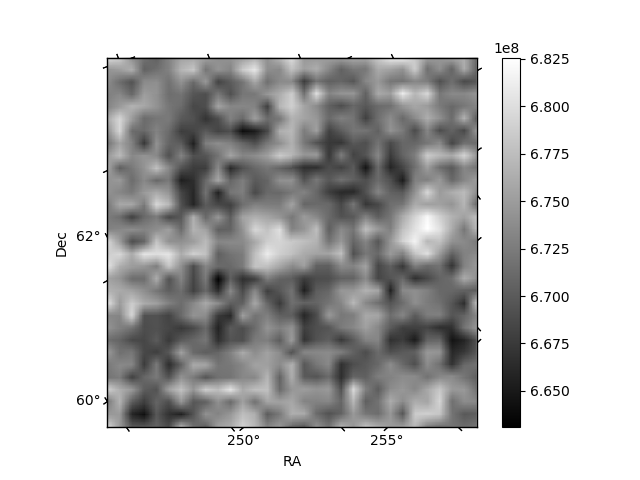
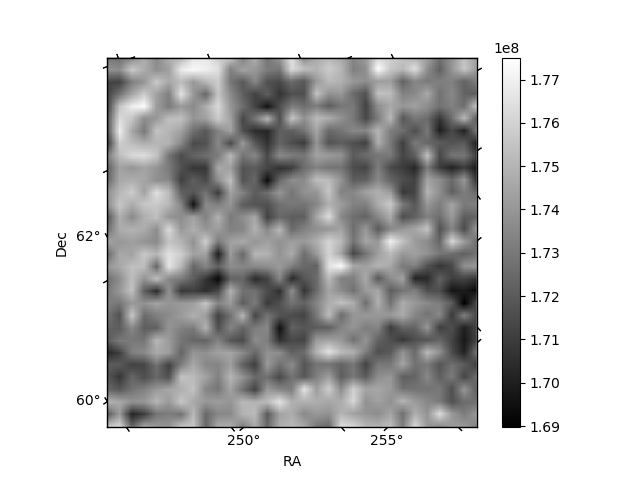
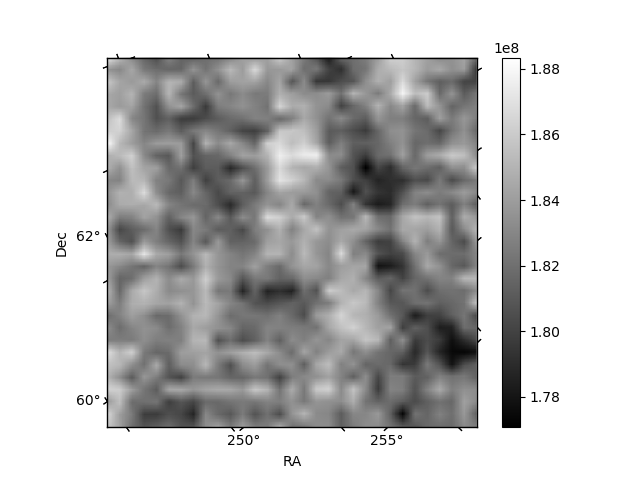
Histogram calculated using DETX and DETY for each event in the final _common_clean file
| Quadrant A | 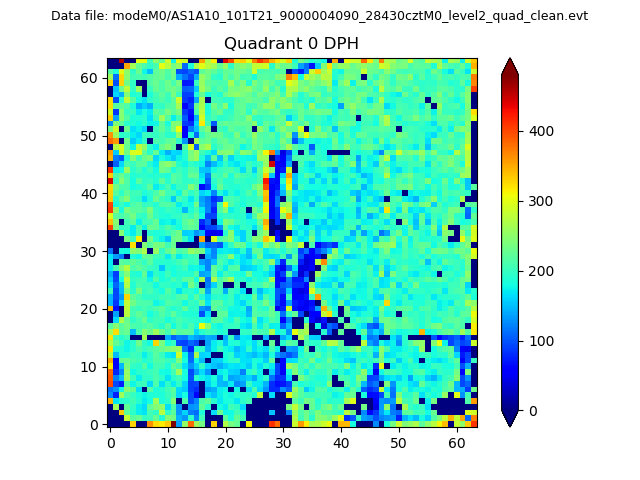 |
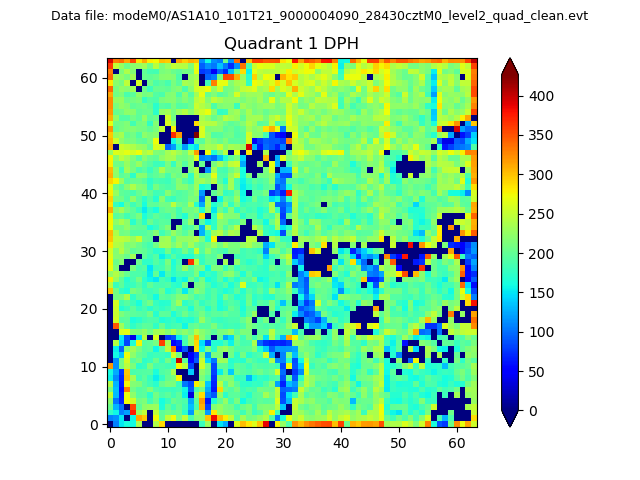 |
Quadrant B |
|---|---|---|---|
| Quadrant D | 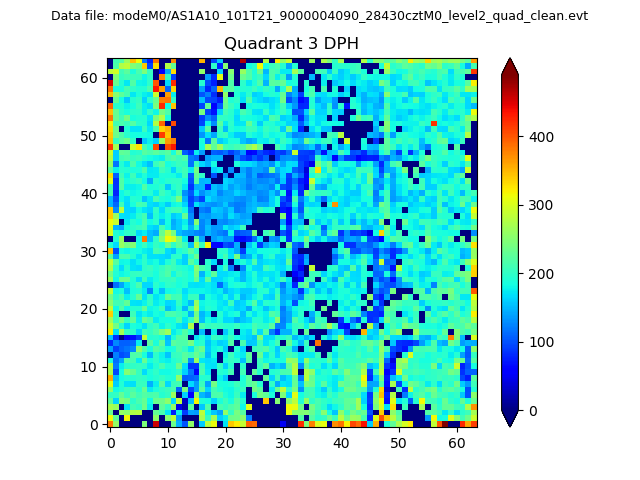 |
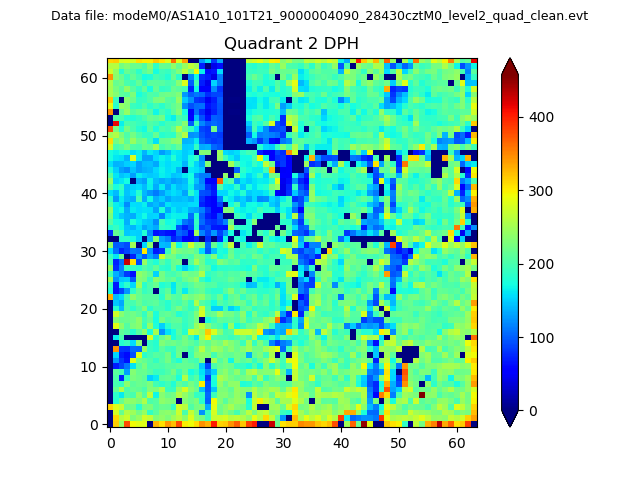 |
Quadrant C |
| Plot type | Count rate plots | Images |
|---|---|---|
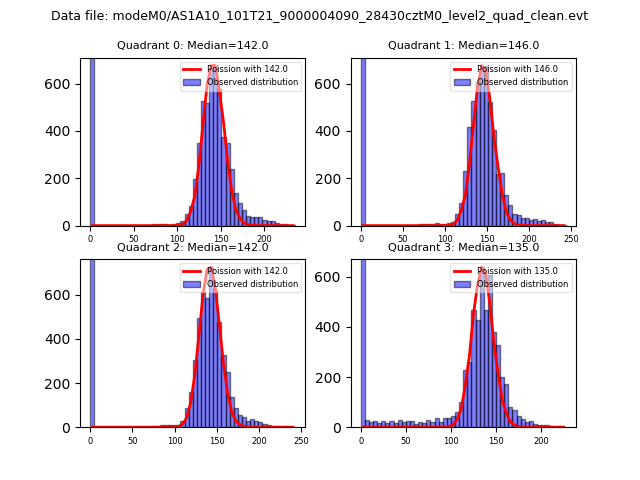
| Comparison with Poisson distribution Blue bars denote a histogram of data divided into 1 sec bins. Red curve is a Poisson curve with rate = median count rate of data. |
 |
 |
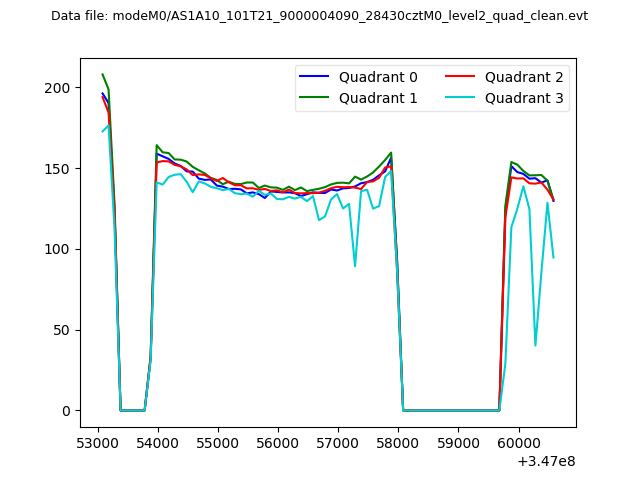
| Quadrant-wise count rates Data is divided into 100 sec bins |
 |
|
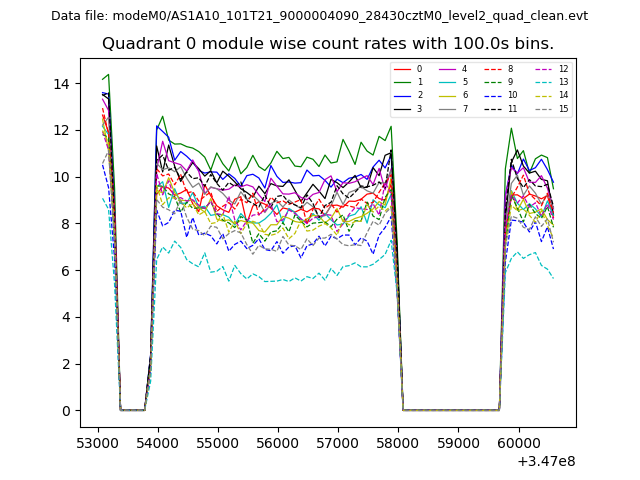
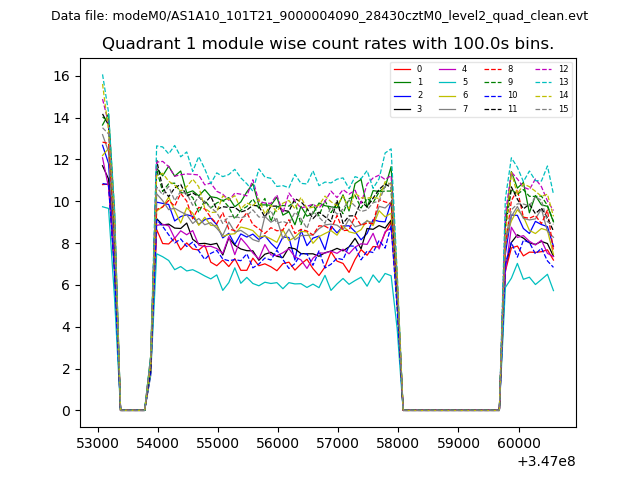
| Module-wise count rates for Quadrant A Data is divided into 100 sec bins |
 |
 |
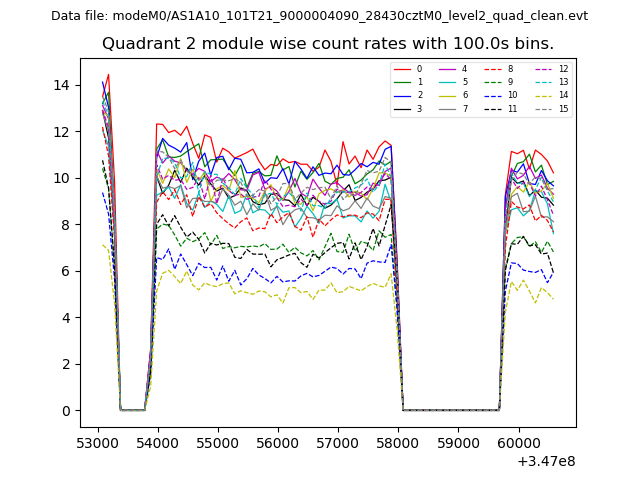
| Module-wise count rates for Quadrant B Data is divided into 100 sec bins |
 |
 |
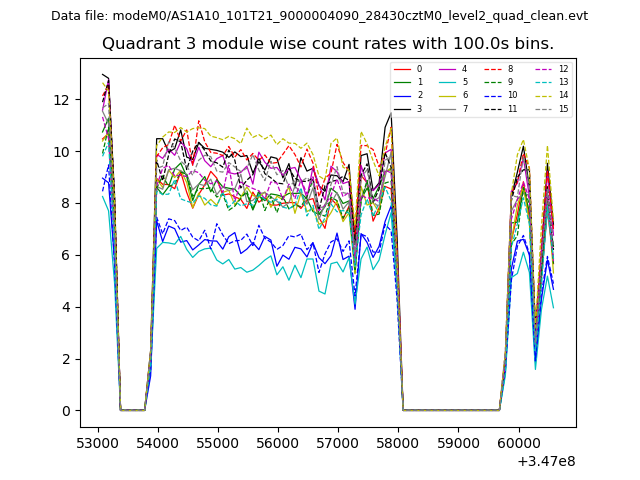
| Module-wise count rates for Quadrant C Data is divided into 100 sec bins |
 |
 |
| Module-wise count rates for Quadrant D Data is divided into 100 sec bins |
 |
 |
| Parameter | Plot |
|---|---|
| CZT HV Monitor | 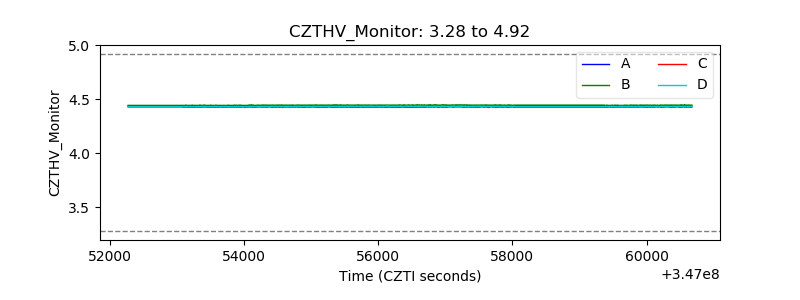 |
| D_VDD | 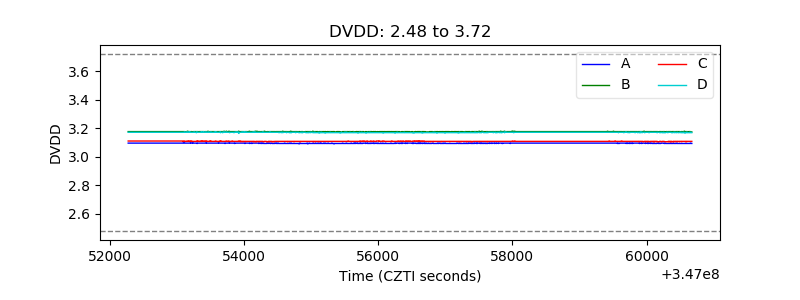 |
| Temperature 1 | 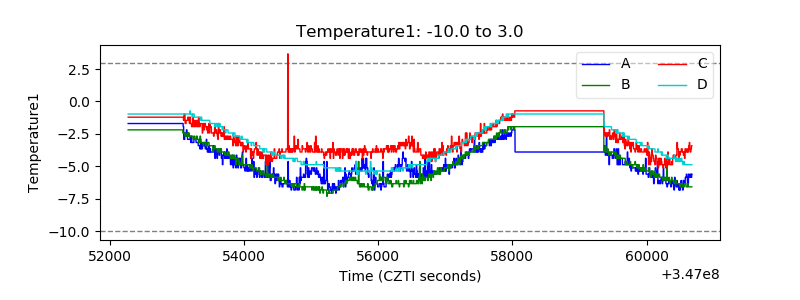 |
| Veto HV Monitor | 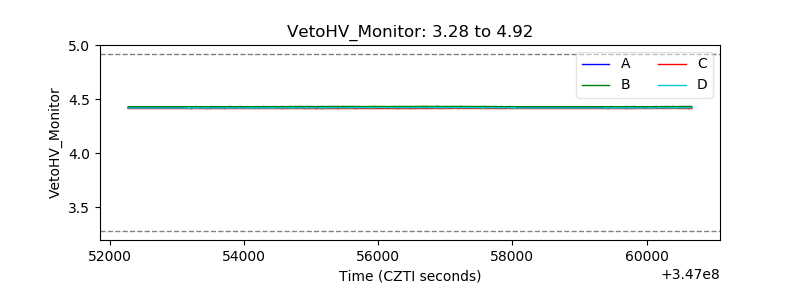 |
| Veto LLD | 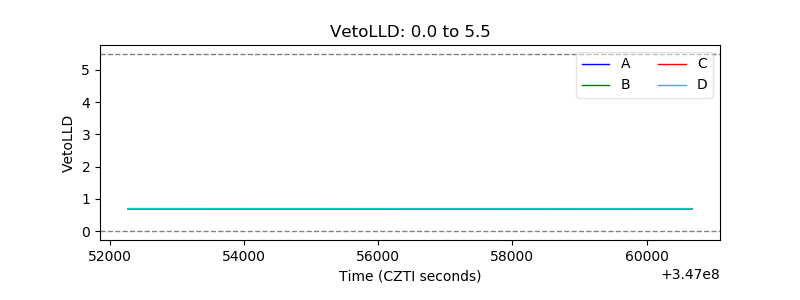 |
| Alpha Counter | 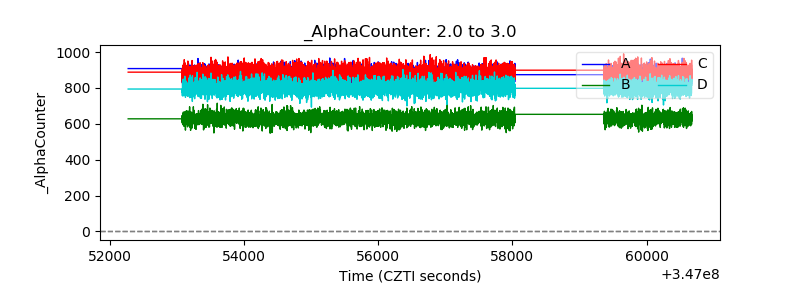 |
| _CPM_Rate | 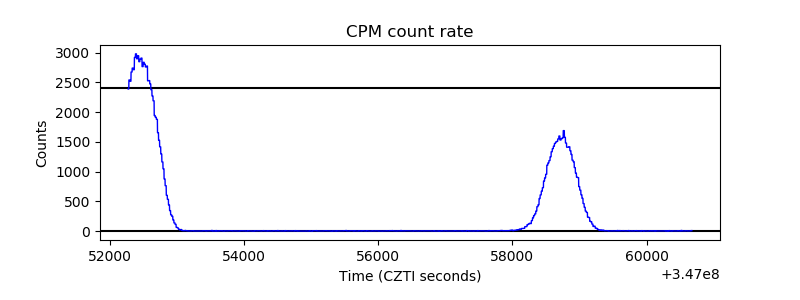 |
| CZT Counter | 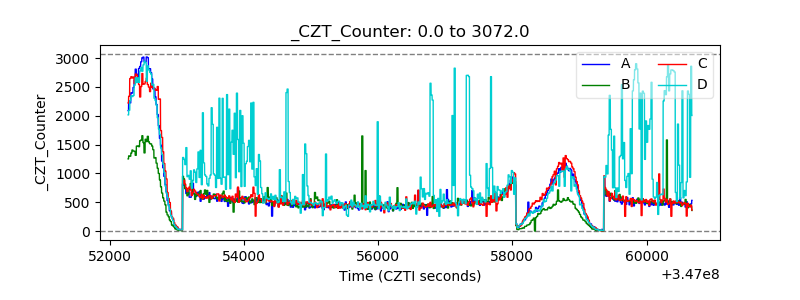 |
| +2.5 Volts monitor |  |
| +5 Volts monitor |  |
| _ROLL_ROT | 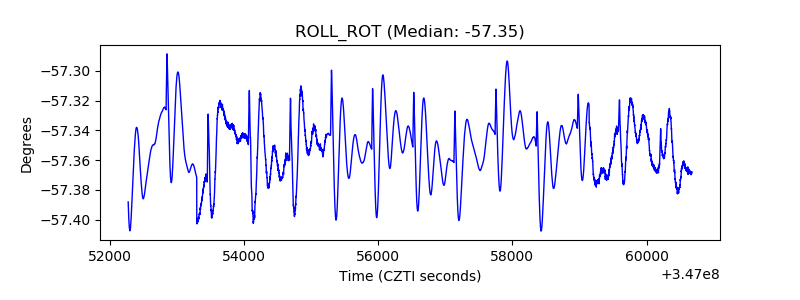 |
| _Roll_DEC | 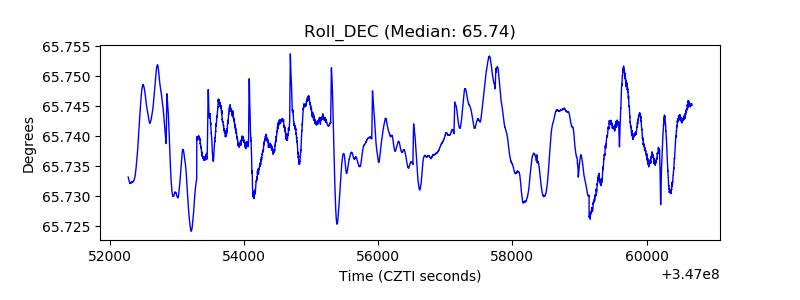 |
| _Roll_RA | 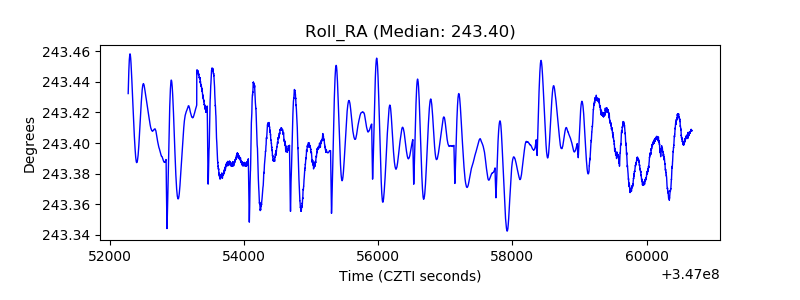 |
| Veto Counter | 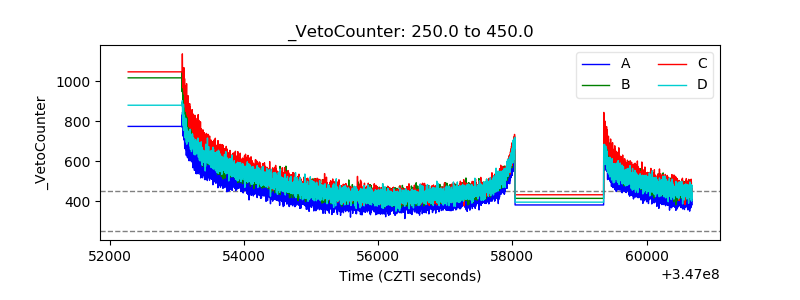 |