| Param | Original file | Final file |
|---|---|---|
| Filename | modeM0/AS1A10_101T21_9000004090_28431cztM0_level2.evt | modeM0/AS1A10_101T21_9000004090_28431cztM0_level2_quad_clean.evt |
| Size (bytes) | 735,641,280 | 121,556,160 |
| Size | 701.6 MB | 115.9 MB |
| Events in quadrant A | 3,224,058 | 852,884 |
| Events in quadrant B | 3,387,414 | 870,630 |
| Events in quadrant C | 3,448,180 | 842,502 |
| Events in quadrant D | 11,756,679 | 637,917 |
| Mode M0 | |||
|---|---|---|---|
| Quadrant | BADHDUFLAG | Total packets | Discarded packets |
| A | 0 | 14109 | 0 |
| B | 0 | 14495 | 0 |
| C | 0 | 14601 | 0 |
| D | 0 | 39600 | 0 |
| Mode M9 | |||
|---|---|---|---|
| Quadrant | BADHDUFLAG | Total packets | Discarded packets |
| A | 0 | 14 | 0 |
| B | 0 | 15 | 0 |
| C | 0 | 15 | 0 |
| D | 0 | 15 | 0 |
| Quadrant | Total seconds | Saturated seconds | Saturation percentage |
|---|---|---|---|
| A | 6834 | 60 | 0.877963% |
| B | 6834 | 80 | 1.170618% |
| C | 6833 | 140 | 2.048880% |
| D | 6833 | 3020 | 44.197278% |
Noise dominated data is calculated using 1-second bins in cleaned event files. If a bin has >2000 counts, and if more than 50% of those come from <1% of pixels, then it is considered to be noise-dominated and hence unusable.
| Quadrant | # 1 sec bins | Bins with >0 counts | Bins with >2000 counts | High rate bins dominated by noise | Noise dominated (total time) | Noise dominated (detector-on time) | Marked lightcurve |
|---|---|---|---|---|---|---|---|
| A | 7844 | 6835 | 0 | 0 | 0.00% | 0.00% | 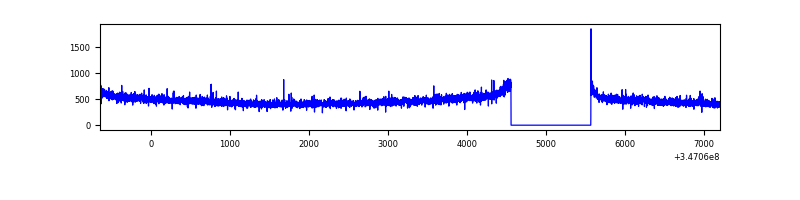 |
| B | 7844 | 6834 | 1 | 1 | 0.01% | 0.01% | 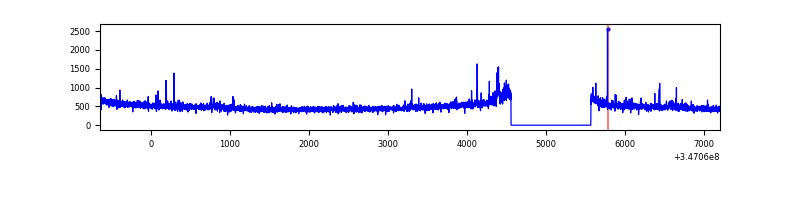 |
| C | 7843 | 6834 | 2 | 2 | 0.03% | 0.03% | 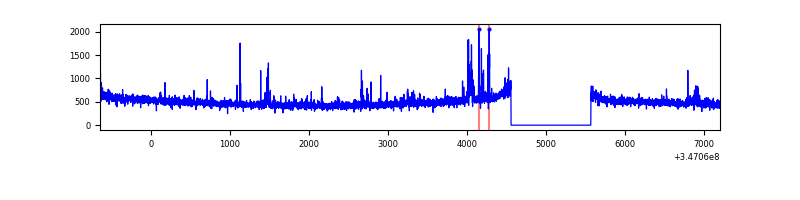 |
| D | 7843 | 6833 | 2865 | 2865 | 36.53% | 41.93% | 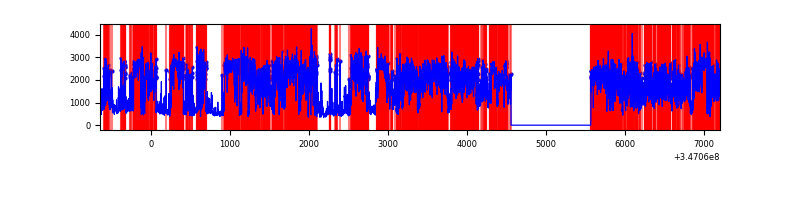 |
Top three noisy pixels from each quadrant. If the there are fewer than three noisy pixels in the level2.evt file, extra rows are filled as -1
| Pixel properties | Quadrant properties | ||||||
|---|---|---|---|---|---|---|---|
| Quadrant | DetID | PixID | Counts | Sigma | Mean | Median | Sigma |
| A | 13 | 254 | 11650 | 65.19 | 831 | 814 | 166.2 |
| A | 3 | 137 | 8098 | 43.82 | 831 | 814 | 166.2 |
| A | 8 | 192 | 7995 | 43.2 | 831 | 814 | 166.2 |
| B | 0 | 230 | 52453 | 331.0 | 829 | 809 | 156.0 |
| B | 10 | 245 | 31009 | 193.56 | 829 | 809 | 156.0 |
| B | 0 | 190 | 22594 | 139.62 | 829 | 809 | 156.0 |
| C | 14 | 238 | 131675 | 698.49 | 811 | 815 | 187.3 |
| C | 3 | 233 | 83883 | 443.39 | 811 | 815 | 187.3 |
| C | 7 | 220 | 64682 | 340.9 | 811 | 815 | 187.3 |
| D | 1 | 52 | 8265728 | 51908.08 | 668 | 649 | 159.2 |
| D | 8 | 195 | 646803 | 4058.11 | 668 | 649 | 159.2 |
| D | 2 | 250 | 108336 | 676.32 | 668 | 649 | 159.2 |
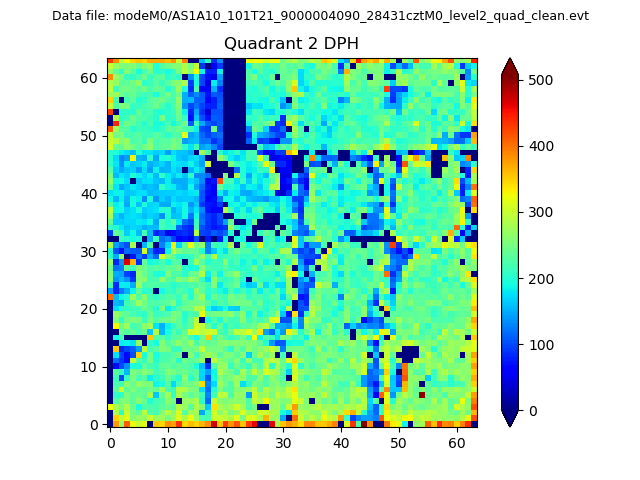
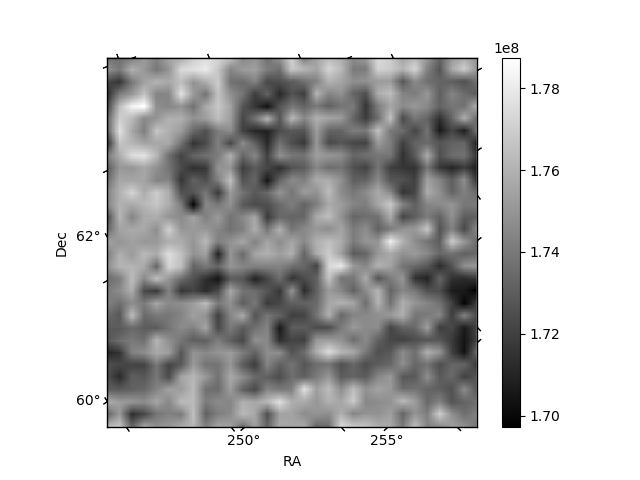
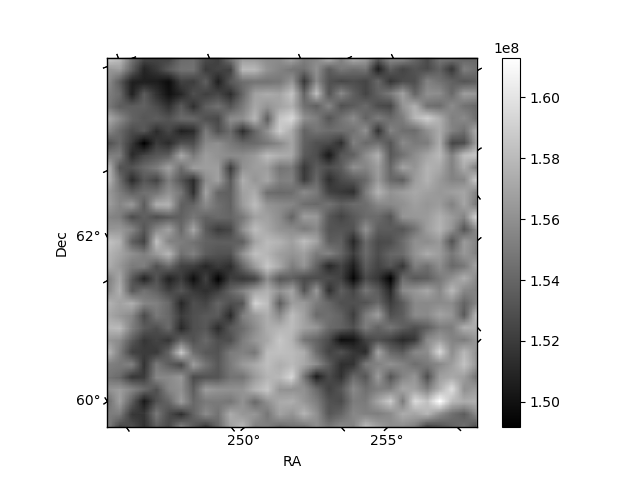
Histogram calculated using DETX and DETY for each event in the final _common_clean file
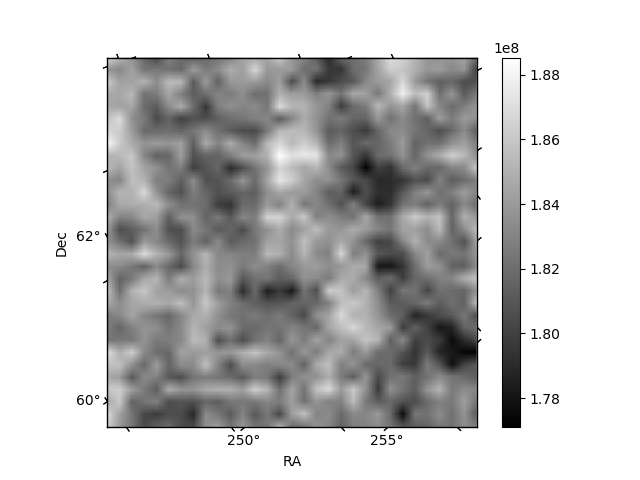
| Quadrant A | 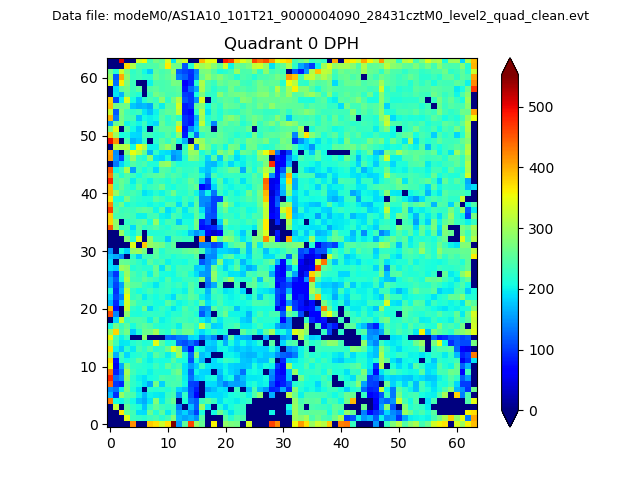 |
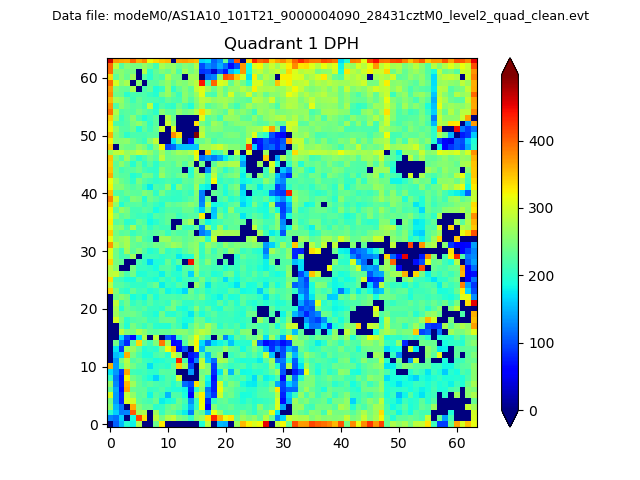 |
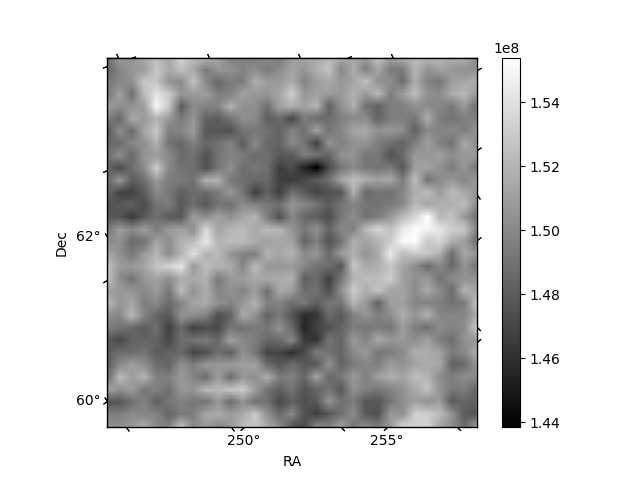
Quadrant B |
|---|---|---|---|
| Quadrant D | 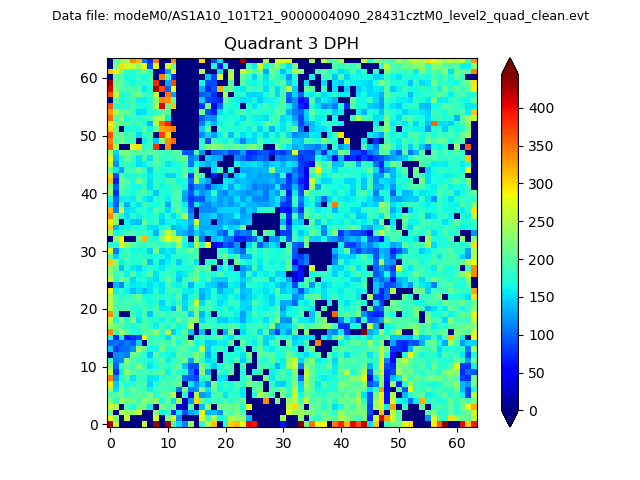 |
 |
Quadrant C |
| Plot type | Count rate plots | Images |
|---|---|---|
| Comparison with Poisson distribution Blue bars denote a histogram of data divided into 1 sec bins. Red curve is a Poisson curve with rate = median count rate of data. |
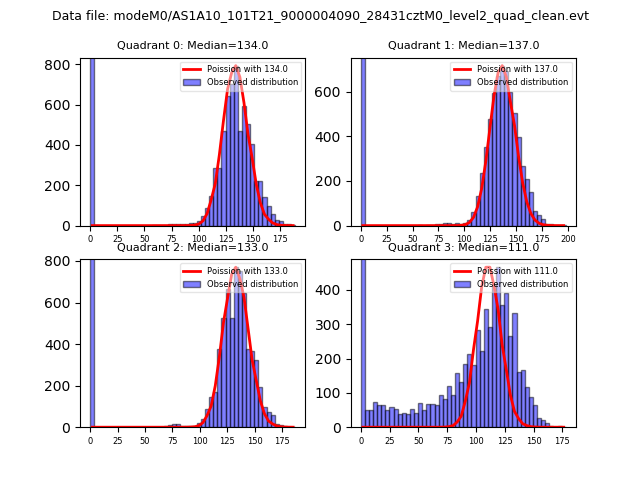 |
 |
| Quadrant-wise count rates Data is divided into 100 sec bins |
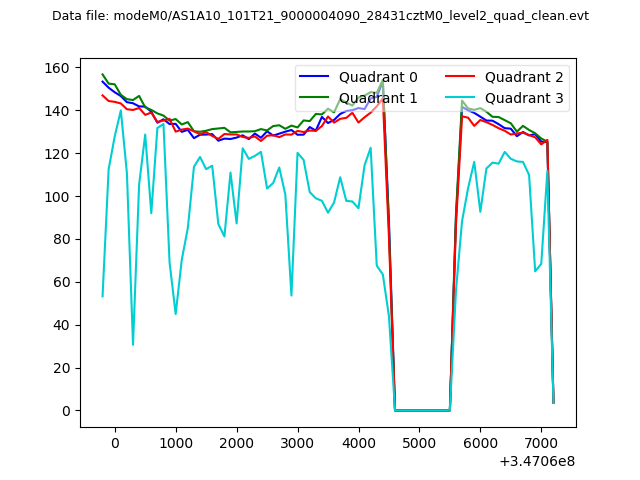 |
|
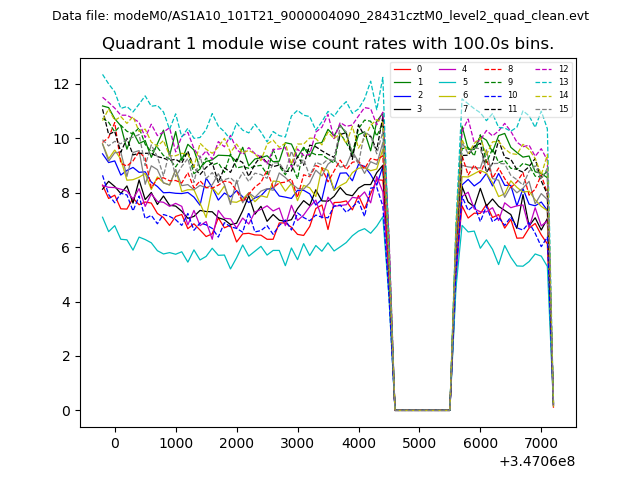
| Module-wise count rates for Quadrant A Data is divided into 100 sec bins |
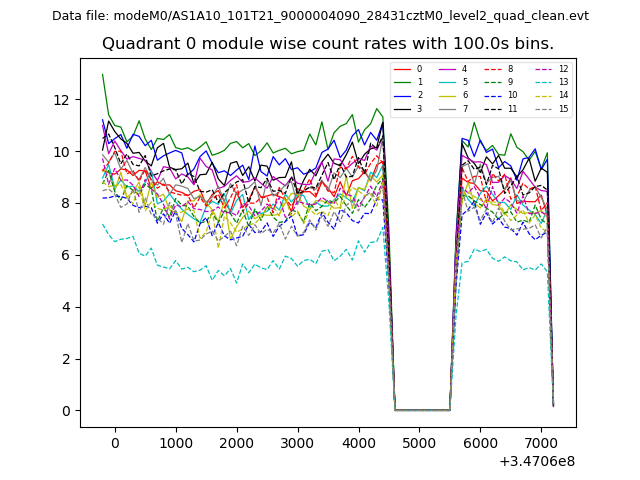 |
 |
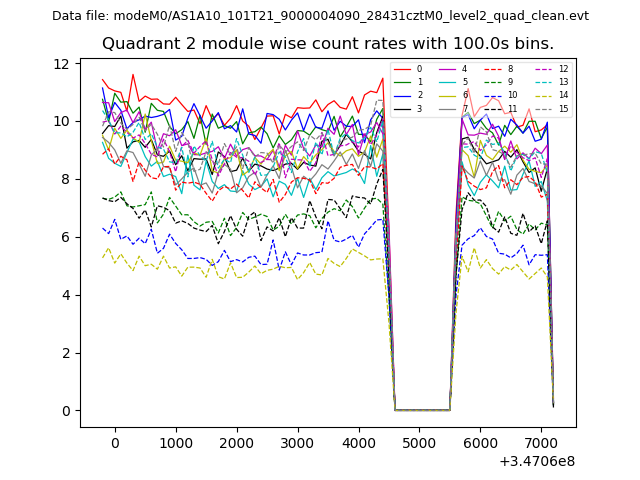
| Module-wise count rates for Quadrant B Data is divided into 100 sec bins |
 |
 |
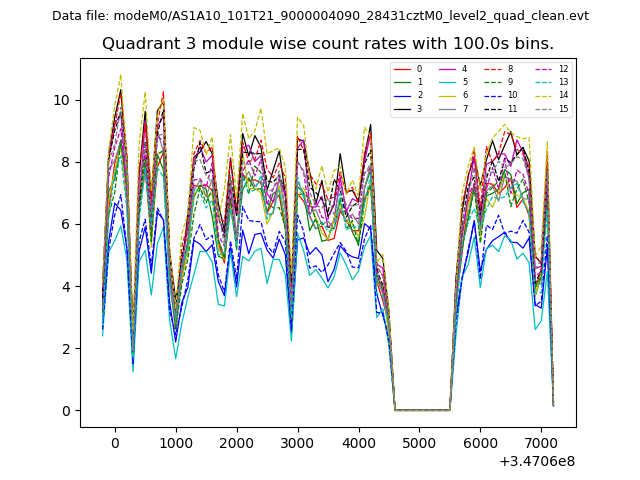
| Module-wise count rates for Quadrant C Data is divided into 100 sec bins |
 |
 |
| Module-wise count rates for Quadrant D Data is divided into 100 sec bins |
 |
 |
| Parameter | Plot |
|---|---|
| CZT HV Monitor | 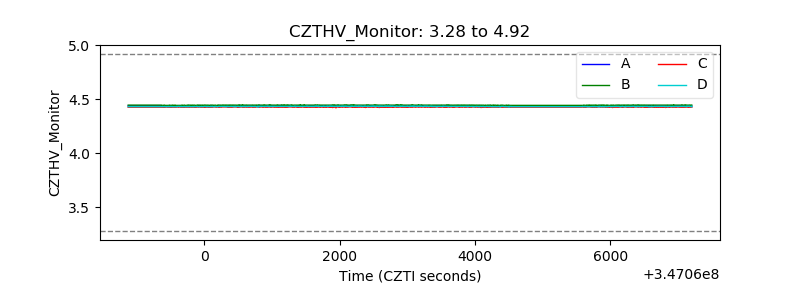 |
| D_VDD | 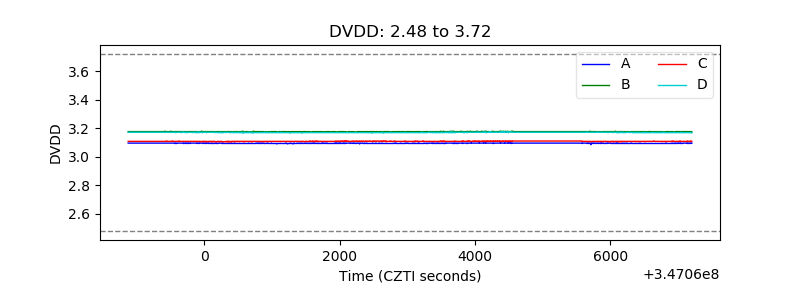 |
| Temperature 1 | 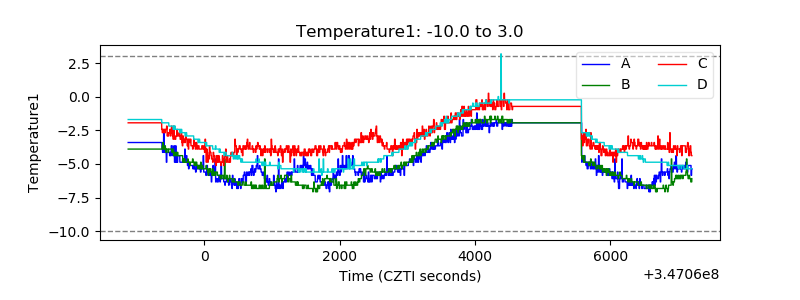 |
| Veto HV Monitor | 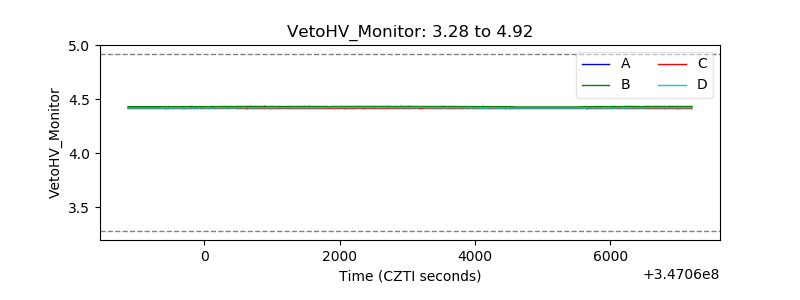 |
| Veto LLD | 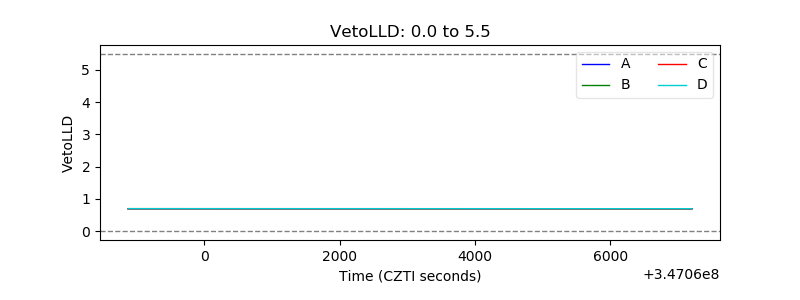 |
| Alpha Counter | 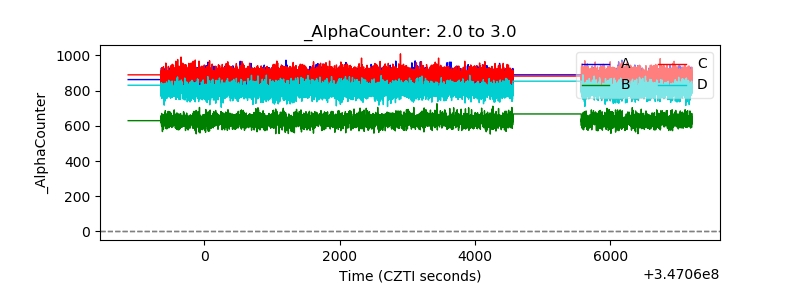 |
| _CPM_Rate | 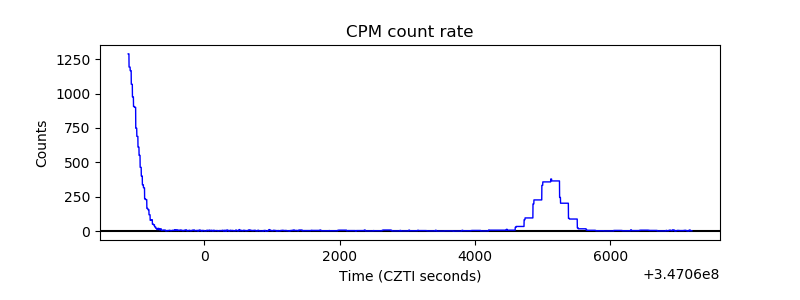 |
| CZT Counter |  |
| +2.5 Volts monitor |  |
| +5 Volts monitor |  |
| _ROLL_ROT | 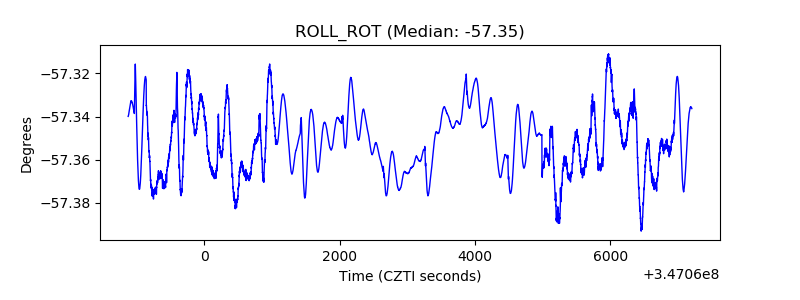 |
| _Roll_DEC | 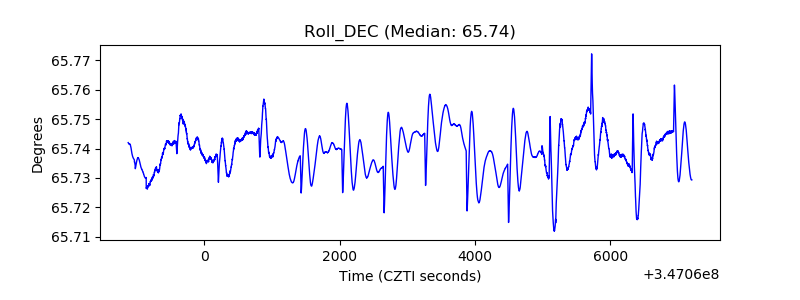 |
| _Roll_RA |  |
| Veto Counter | 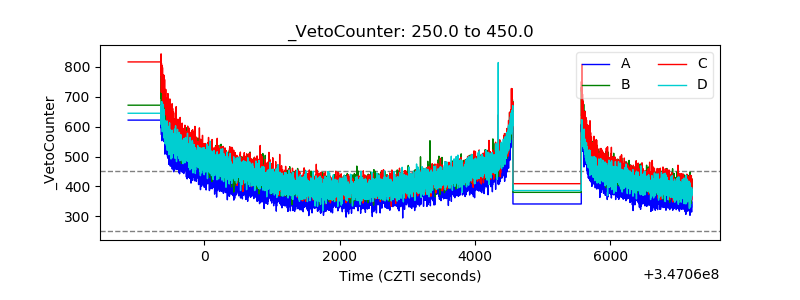 |