| Param | Original file | Final file |
|---|---|---|
| Filename | modeM0/AS1A10_101T21_9000004090_28432cztM0_level2.evt | modeM0/AS1A10_101T21_9000004090_28432cztM0_level2_quad_clean.evt |
| Size (bytes) | 633,029,760 | 132,364,800 |
| Size | 603.7 MB | 126.2 MB |
| Events in quadrant A | 3,327,236 | 898,828 |
| Events in quadrant B | 3,497,480 | 915,795 |
| Events in quadrant C | 3,594,212 | 886,700 |
| Events in quadrant D | 8,258,200 | 799,301 |
| Mode M0 | |||
|---|---|---|---|
| Quadrant | BADHDUFLAG | Total packets | Discarded packets |
| A | 0 | 14887 | 0 |
| B | 0 | 15222 | 0 |
| C | 0 | 15480 | 0 |
| D | 0 | 29520 | 0 |
| Mode M9 | |||
|---|---|---|---|
| Quadrant | BADHDUFLAG | Total packets | Discarded packets |
| A | 0 | 12 | 0 |
| B | 0 | 13 | 0 |
| C | 0 | 13 | 0 |
| D | 0 | 13 | 0 |
| Quadrant | Total seconds | Saturated seconds | Saturation percentage |
|---|---|---|---|
| A | 7290 | 27 | 0.370370% |
| B | 7290 | 35 | 0.480110% |
| C | 7290 | 98 | 1.344307% |
| D | 7290 | 1135 | 15.569273% |
Noise dominated data is calculated using 1-second bins in cleaned event files. If a bin has >2000 counts, and if more than 50% of those come from <1% of pixels, then it is considered to be noise-dominated and hence unusable.
| Quadrant | # 1 sec bins | Bins with >0 counts | Bins with >2000 counts | High rate bins dominated by noise | Noise dominated (total time) | Noise dominated (detector-on time) | Marked lightcurve |
|---|---|---|---|---|---|---|---|
| A | 7906 | 7291 | 0 | 0 | 0.00% | 0.00% | 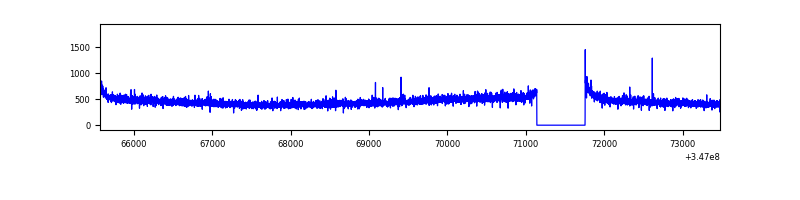 |
| B | 7906 | 7291 | 3 | 3 | 0.04% | 0.04% | 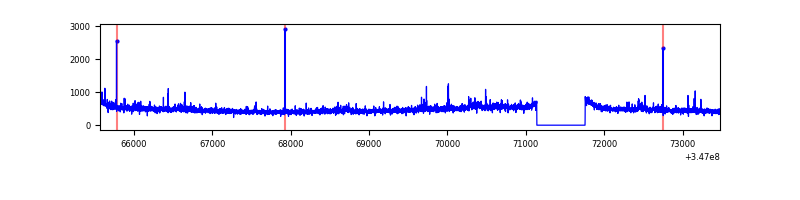 |
| C | 7906 | 7291 | 1 | 1 | 0.01% | 0.01% | 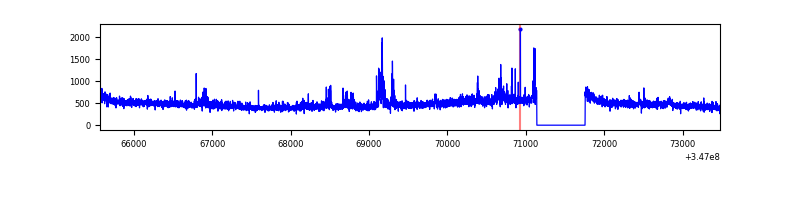 |
| D | 7906 | 7291 | 1193 | 1193 | 15.09% | 16.36% | 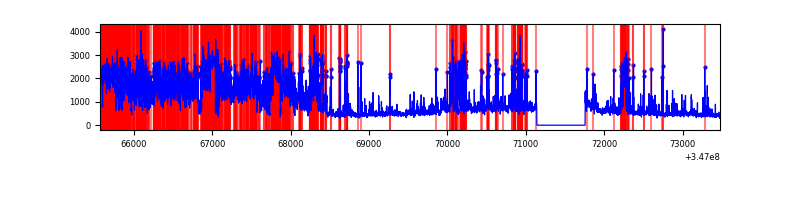 |
Top three noisy pixels from each quadrant. If the there are fewer than three noisy pixels in the level2.evt file, extra rows are filled as -1
| Pixel properties | Quadrant properties | ||||||
|---|---|---|---|---|---|---|---|
| Quadrant | DetID | PixID | Counts | Sigma | Mean | Median | Sigma |
| A | 13 | 254 | 11782 | 63.79 | 859 | 842 | 171.5 |
| A | 3 | 137 | 8428 | 44.23 | 859 | 842 | 171.5 |
| A | 0 | 226 | 7326 | 37.81 | 859 | 842 | 171.5 |
| B | 0 | 230 | 29869 | 177.91 | 860 | 836 | 163.2 |
| B | 0 | 183 | 29374 | 174.87 | 860 | 836 | 163.2 |
| B | 10 | 245 | 27951 | 166.15 | 860 | 836 | 163.2 |
| C | 7 | 220 | 159332 | 823.5 | 834 | 837 | 192.5 |
| C | 14 | 238 | 135985 | 702.2 | 834 | 837 | 192.5 |
| C | 3 | 233 | 48944 | 249.95 | 834 | 837 | 192.5 |
| D | 1 | 52 | 4349890 | 23248.99 | 788 | 766 | 187.1 |
| D | 8 | 195 | 410759 | 2191.69 | 788 | 766 | 187.1 |
| D | 2 | 250 | 305137 | 1627.07 | 788 | 766 | 187.1 |
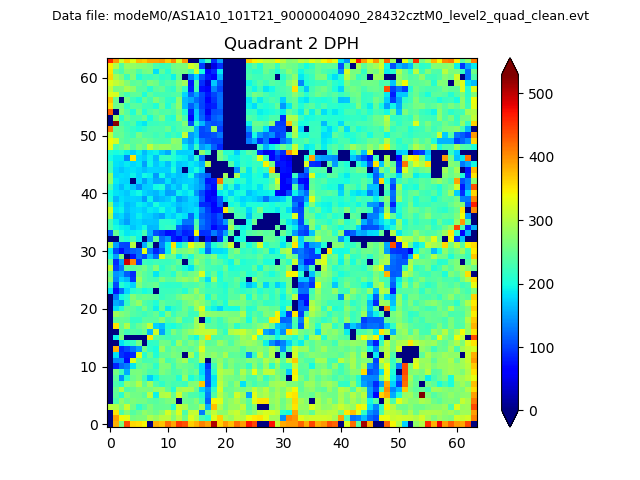
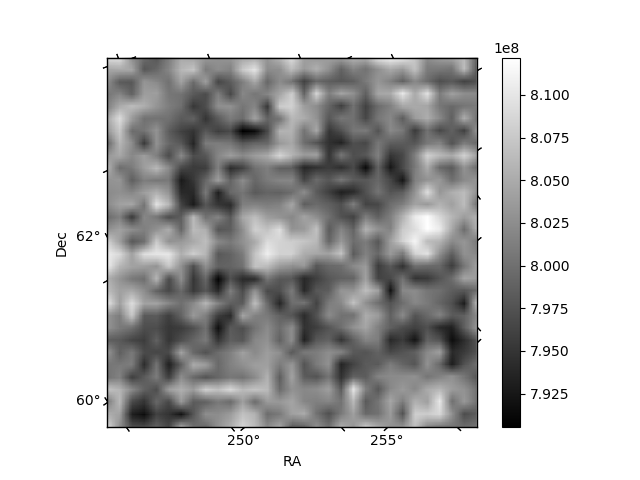
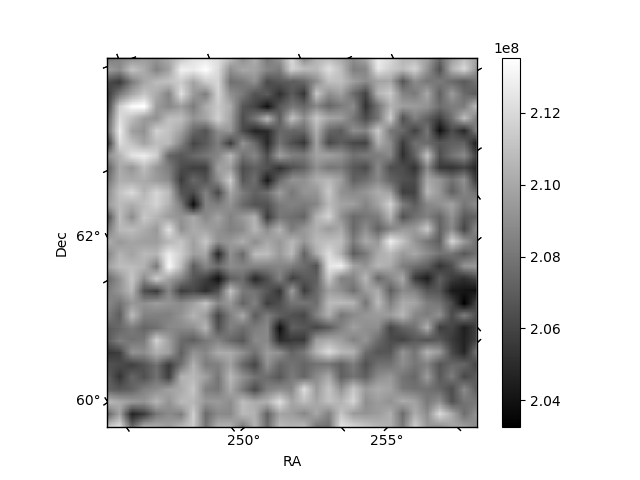
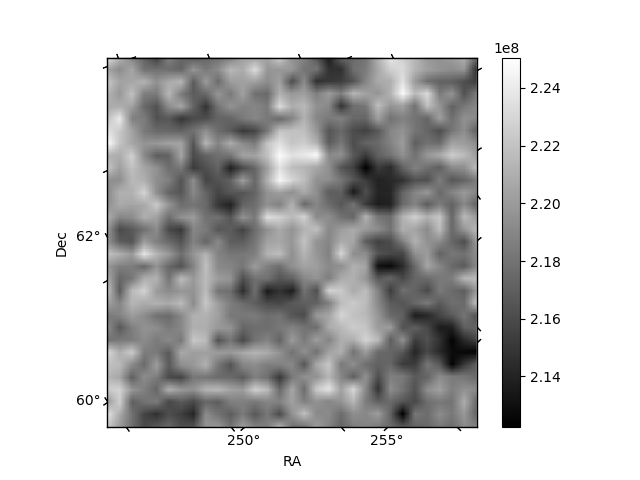
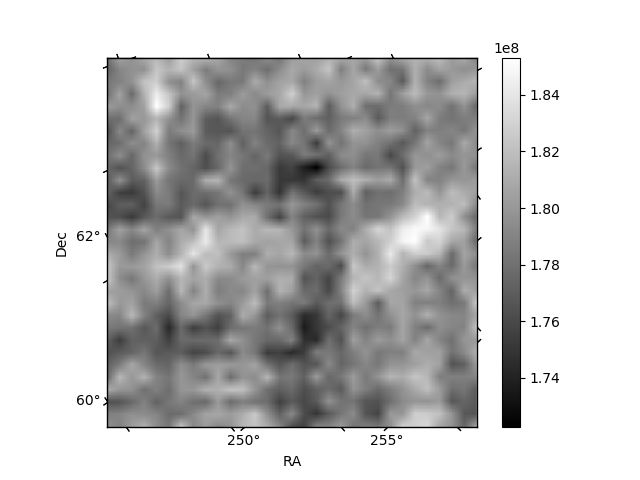
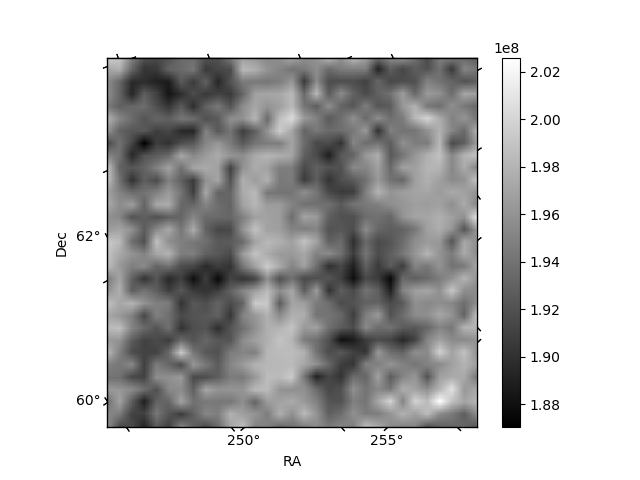
Histogram calculated using DETX and DETY for each event in the final _common_clean file
| Quadrant A | 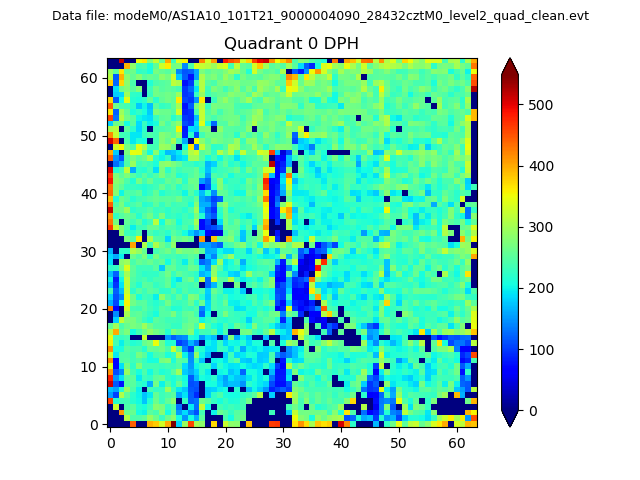 |
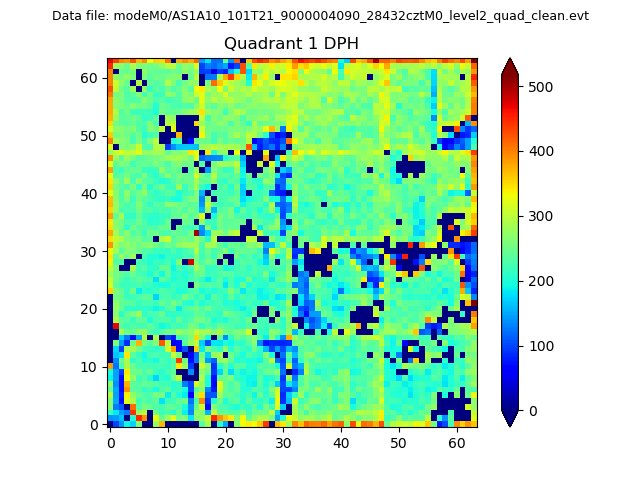 |
Quadrant B |
|---|---|---|---|
| Quadrant D | 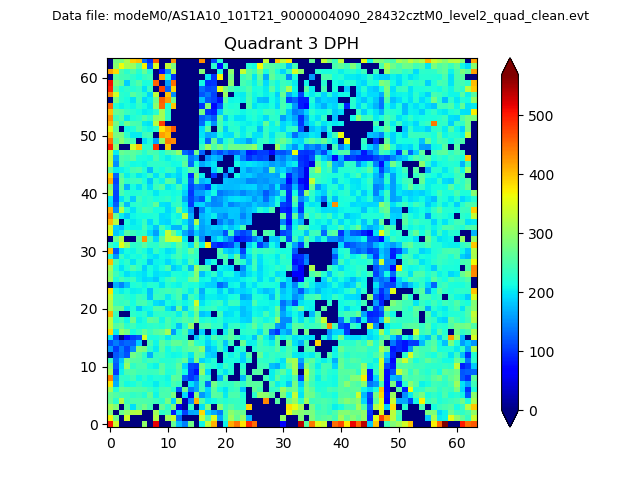 |
 |
Quadrant C |
| Plot type | Count rate plots | Images |
|---|---|---|
| Comparison with Poisson distribution Blue bars denote a histogram of data divided into 1 sec bins. Red curve is a Poisson curve with rate = median count rate of data. |
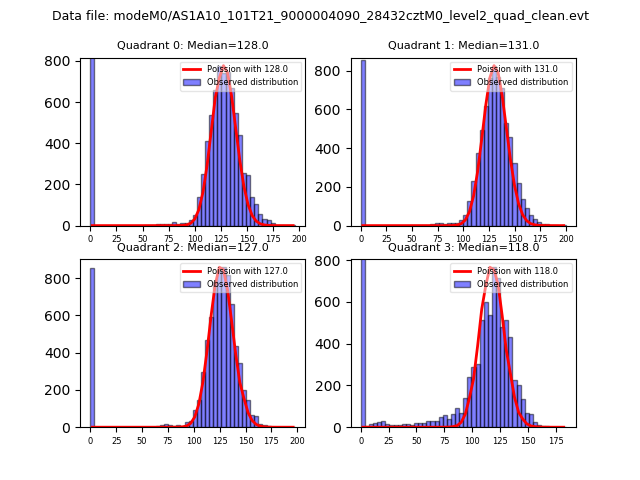 |
 |
| Quadrant-wise count rates Data is divided into 100 sec bins |
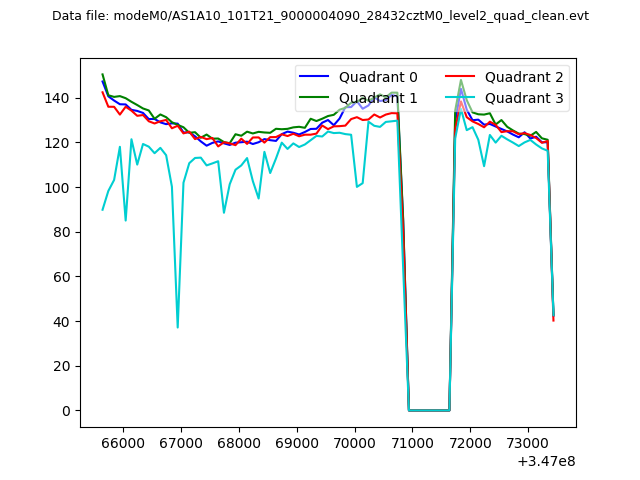 |
|
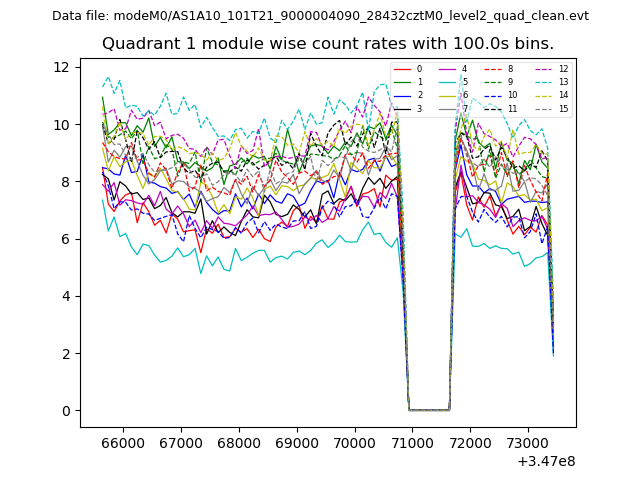
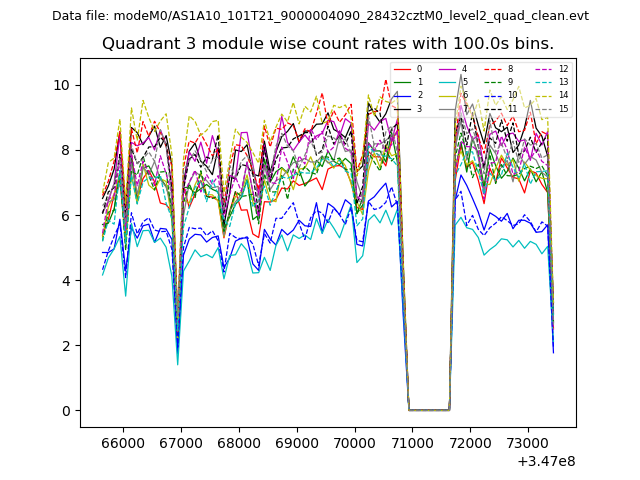
| Module-wise count rates for Quadrant A Data is divided into 100 sec bins |
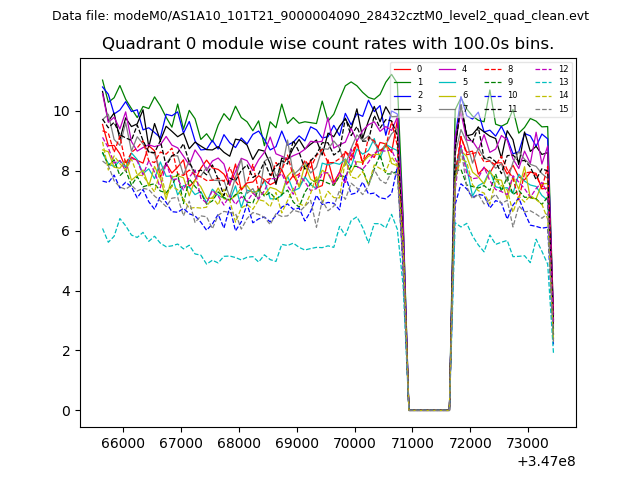 |
 |
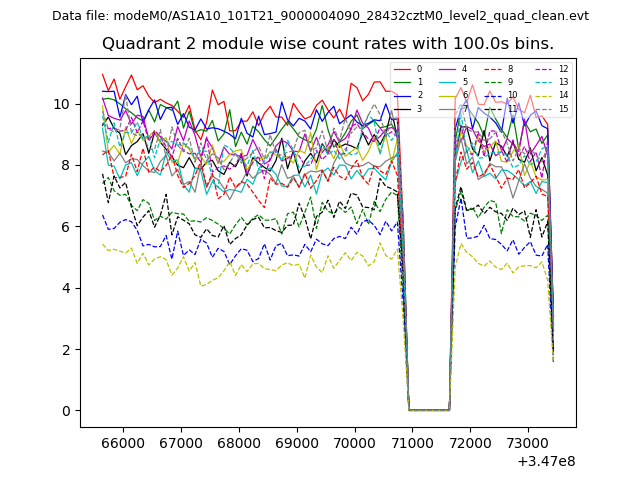
| Module-wise count rates for Quadrant B Data is divided into 100 sec bins |
 |
 |
| Module-wise count rates for Quadrant C Data is divided into 100 sec bins |
 |
 |
| Module-wise count rates for Quadrant D Data is divided into 100 sec bins |
 |
 |
| Parameter | Plot |
|---|---|
| CZT HV Monitor | 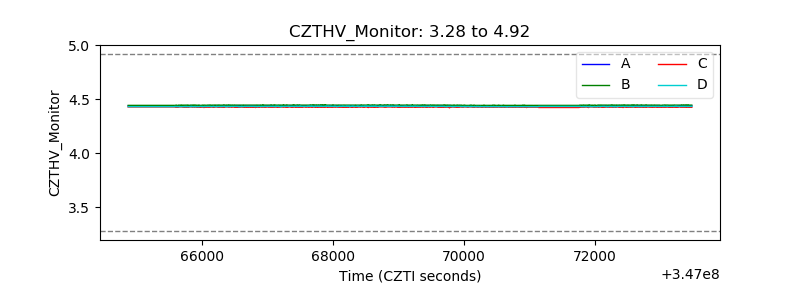 |
| D_VDD | 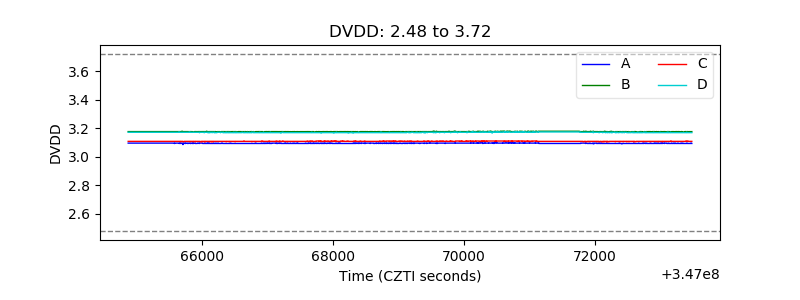 |
| Temperature 1 | 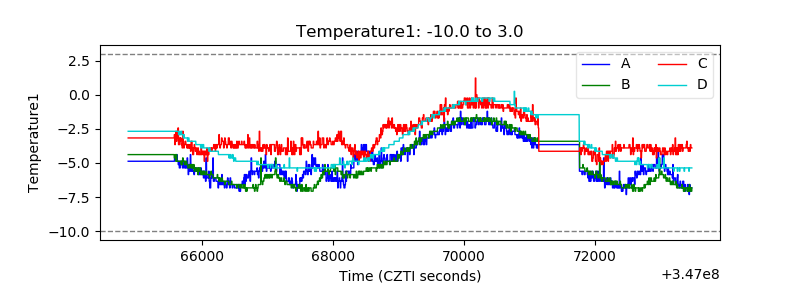 |
| Veto HV Monitor | 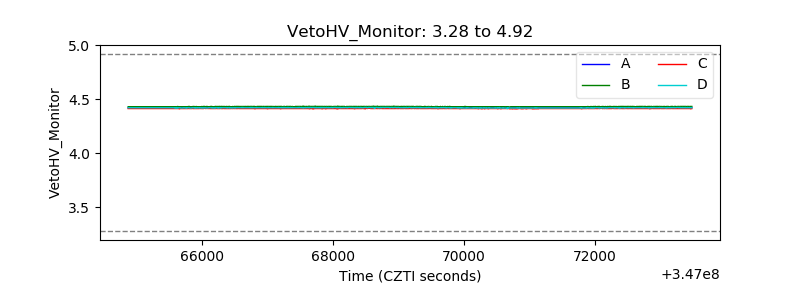 |
| Veto LLD | 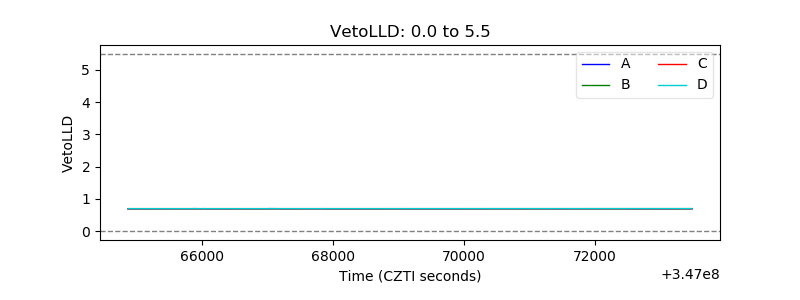 |
| Alpha Counter | 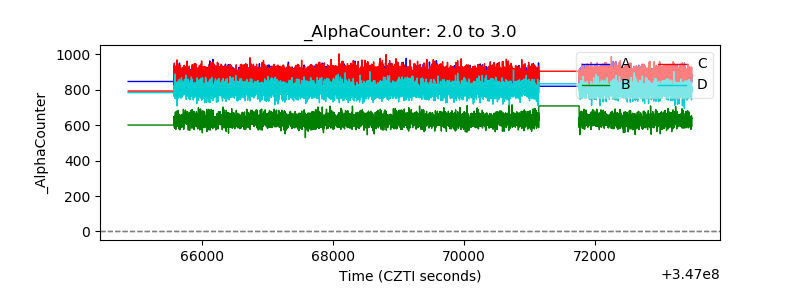 |
| _CPM_Rate | 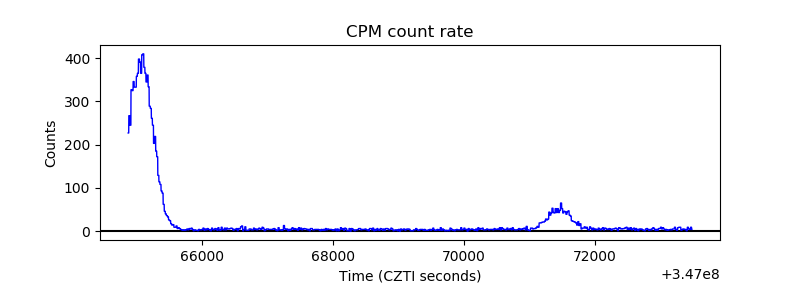 |
| CZT Counter | 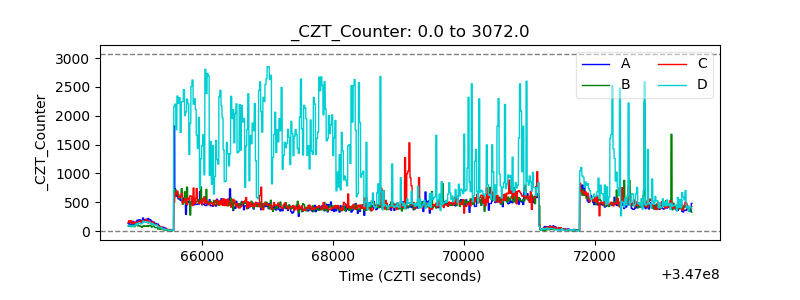 |
| +2.5 Volts monitor |  |
| +5 Volts monitor |  |
| _ROLL_ROT | 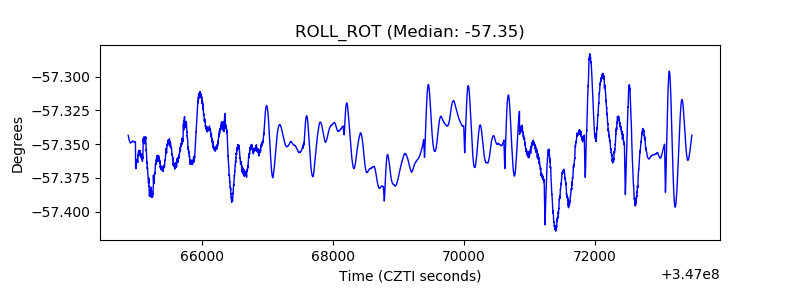 |
| _Roll_DEC | 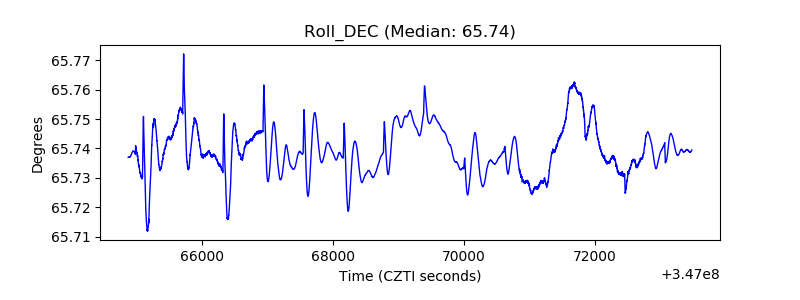 |
| _Roll_RA | 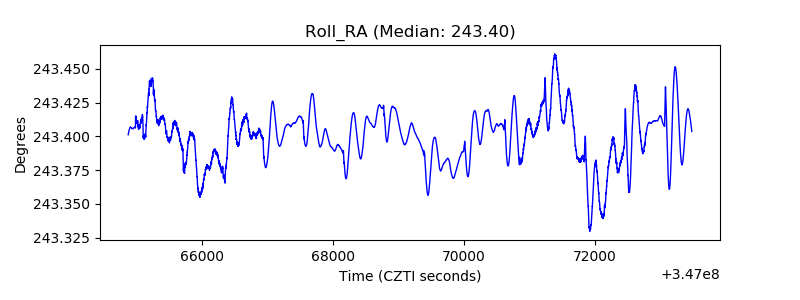 |
| Veto Counter | 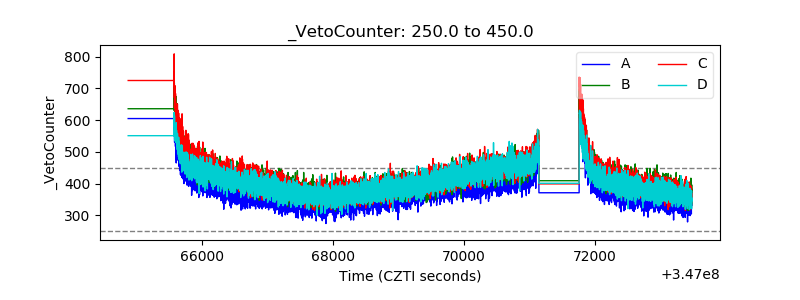 |