| Param | Original file | Final file |
|---|---|---|
| Filename | modeM0/AS1A10_101T21_9000004090_28437cztM0_level2.evt | modeM0/AS1A10_101T21_9000004090_28437cztM0_level2_quad_clean.evt |
| Size (bytes) | 1,400,261,760 | 304,657,920 |
| Size | 1.3 GB | 290.5 MB |
| Events in quadrant A | 8,187,970 | 2,035,283 |
| Events in quadrant B | 8,987,317 | 2,077,694 |
| Events in quadrant C | 8,491,612 | 1,986,386 |
| Events in quadrant D | 15,521,836 | 1,885,712 |
| Mode M0 | |||
|---|---|---|---|
| Quadrant | BADHDUFLAG | Total packets | Discarded packets |
| A | 0 | 36626 | 0 |
| B | 0 | 38654 | 0 |
| C | 0 | 37076 | 0 |
| D | 0 | 58365 | 0 |
| Mode M9 | |||
|---|---|---|---|
| Quadrant | BADHDUFLAG | Total packets | Discarded packets |
| A | 0 | 17 | 0 |
| B | 0 | 17 | 0 |
| C | 0 | 17 | 0 |
| D | 0 | 17 | 0 |
| Quadrant | Total seconds | Saturated seconds | Saturation percentage |
|---|---|---|---|
| A | 18035 | 151 | 0.837261% |
| B | 18035 | 186 | 1.031328% |
| C | 18034 | 198 | 1.097926% |
| D | 18035 | 2233 | 12.381480% |
Noise dominated data is calculated using 1-second bins in cleaned event files. If a bin has >2000 counts, and if more than 50% of those come from <1% of pixels, then it is considered to be noise-dominated and hence unusable.
| Quadrant | # 1 sec bins | Bins with >0 counts | Bins with >2000 counts | High rate bins dominated by noise | Noise dominated (total time) | Noise dominated (detector-on time) | Marked lightcurve |
|---|---|---|---|---|---|---|---|
| A | 19725 | 18035 | 0 | 0 | 0.00% | 0.00% | 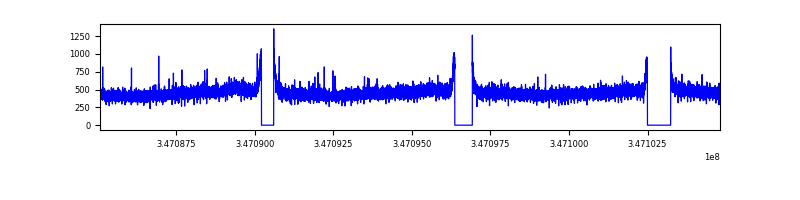 |
| B | 19725 | 18035 | 8 | 8 | 0.04% | 0.04% | 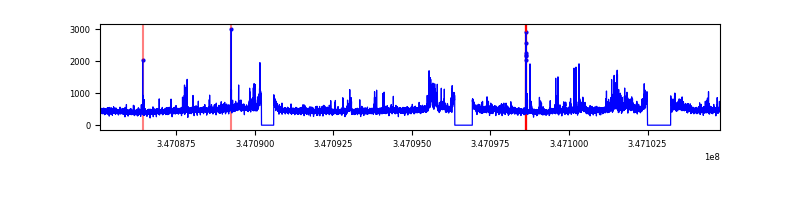 |
| C | 19724 | 18035 | 4 | 4 | 0.02% | 0.02% | 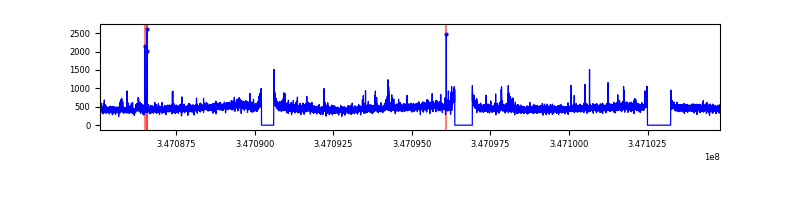 |
| D | 19725 | 18037 | 2309 | 2309 | 11.71% | 12.80% | 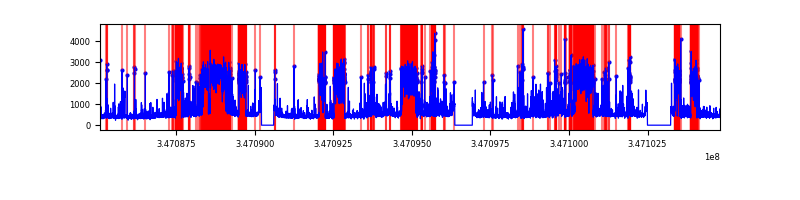 |
Top three noisy pixels from each quadrant. If the there are fewer than three noisy pixels in the level2.evt file, extra rows are filled as -1
| Pixel properties | Quadrant properties | ||||||
|---|---|---|---|---|---|---|---|
| Quadrant | DetID | PixID | Counts | Sigma | Mean | Median | Sigma |
| A | 13 | 254 | 27609 | 60.09 | 2117 | 2068 | 425.0 |
| A | 3 | 137 | 21077 | 44.72 | 2117 | 2068 | 425.0 |
| A | 0 | 226 | 17605 | 36.55 | 2117 | 2068 | 425.0 |
| B | 10 | 245 | 310550 | 779.0 | 2096 | 2043 | 396.0 |
| B | 0 | 183 | 291794 | 731.64 | 2096 | 2043 | 396.0 |
| B | 15 | 222 | 59428 | 144.9 | 2096 | 2043 | 396.0 |
| C | 14 | 238 | 323929 | 680.41 | 2027 | 2035 | 473.1 |
| C | 7 | 220 | 184896 | 386.53 | 2027 | 2035 | 473.1 |
| C | 3 | 233 | 53681 | 109.17 | 2027 | 2035 | 473.1 |
| D | 8 | 195 | 4350892 | 9352.16 | 1973 | 1917 | 465.0 |
| D | 1 | 52 | 3163509 | 6798.78 | 1973 | 1917 | 465.0 |
| D | 2 | 250 | 335725 | 717.83 | 1973 | 1917 | 465.0 |
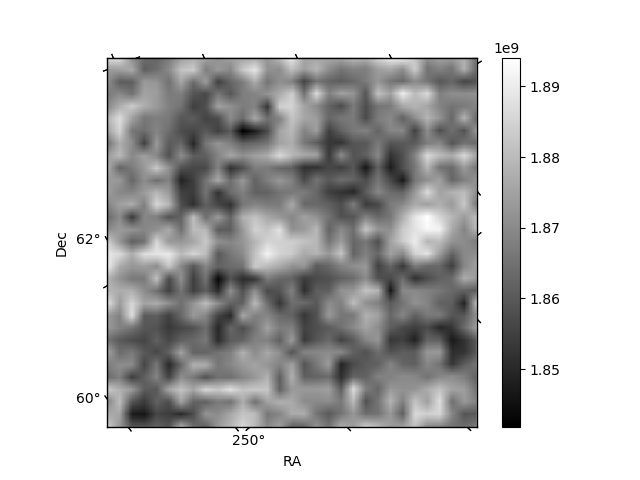
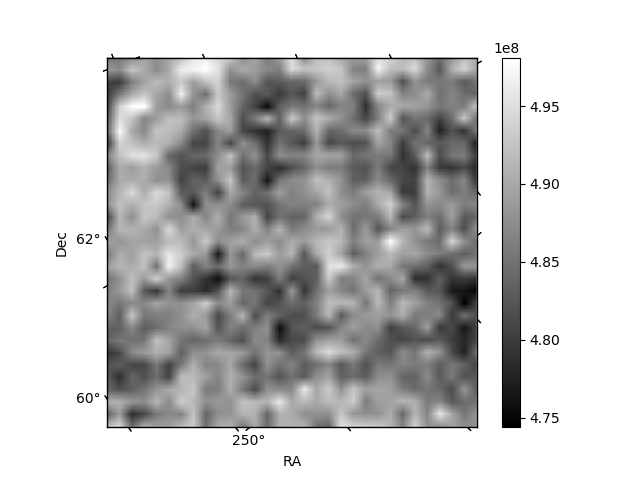
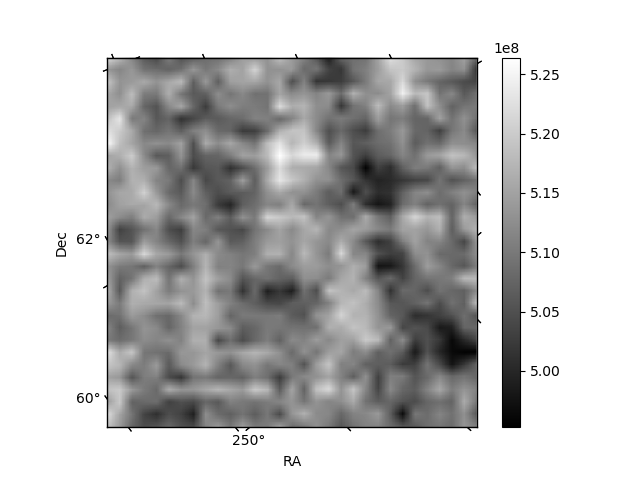
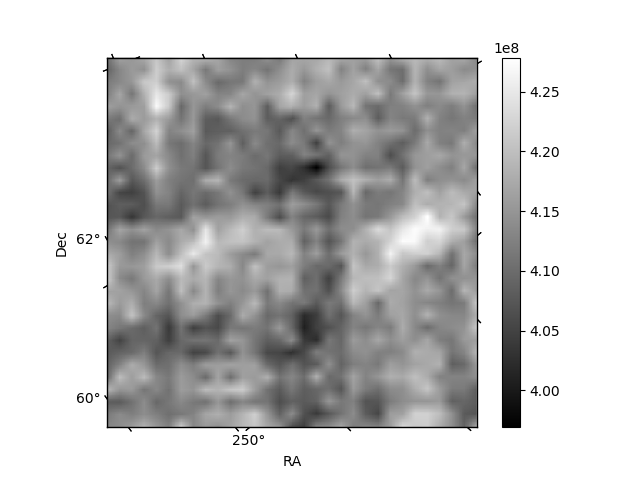
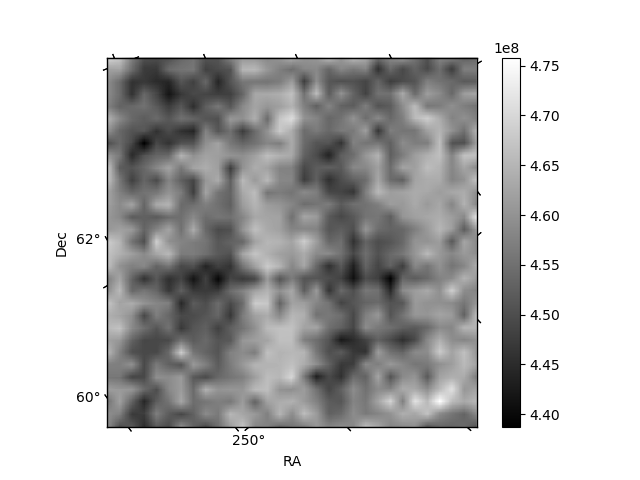
Histogram calculated using DETX and DETY for each event in the final _common_clean file
| Quadrant A | 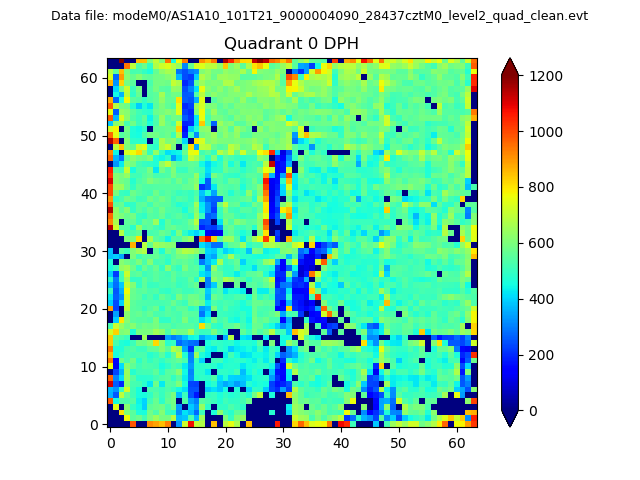 |
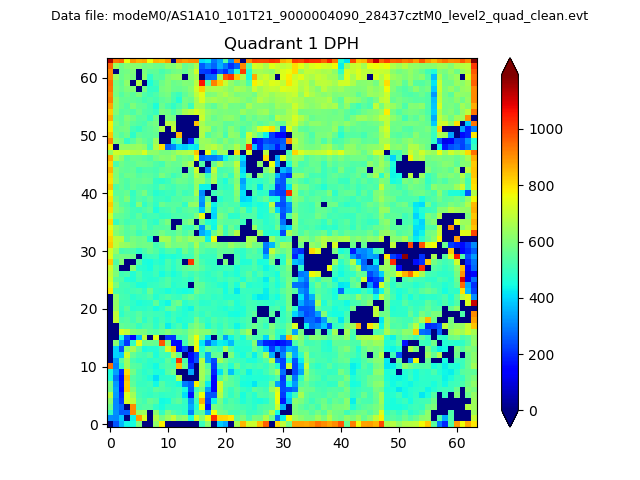 |
Quadrant B |
|---|---|---|---|
| Quadrant D | 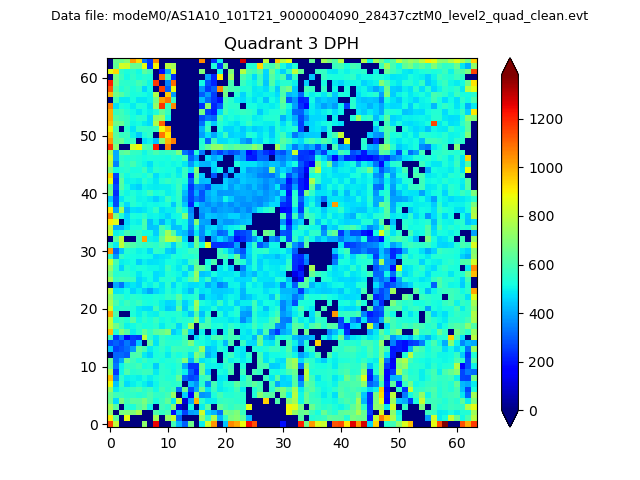 |
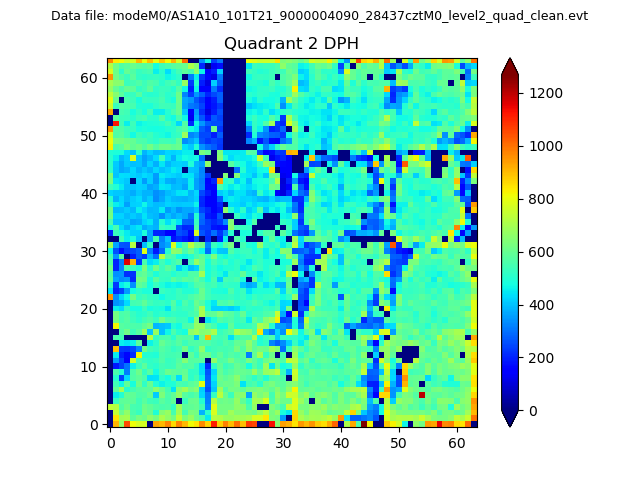 |
Quadrant C |
| Plot type | Count rate plots | Images |
|---|---|---|
| Comparison with Poisson distribution Blue bars denote a histogram of data divided into 1 sec bins. Red curve is a Poisson curve with rate = median count rate of data. |
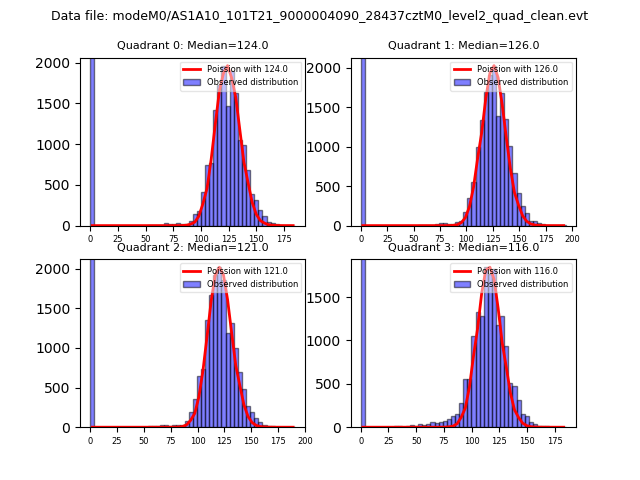 |
 |
| Quadrant-wise count rates Data is divided into 100 sec bins |
 |
|
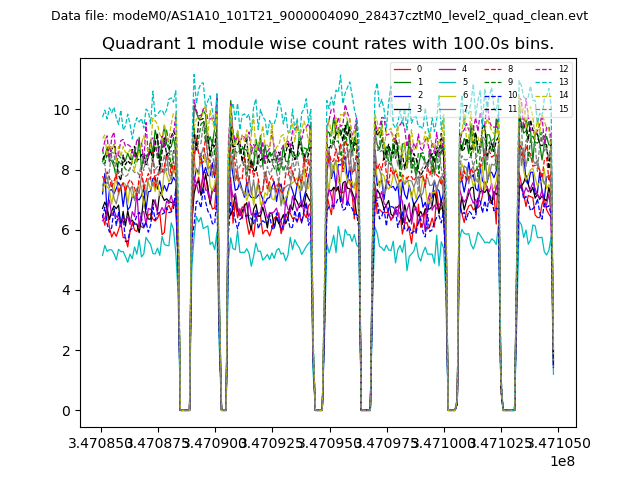
| Module-wise count rates for Quadrant A Data is divided into 100 sec bins |
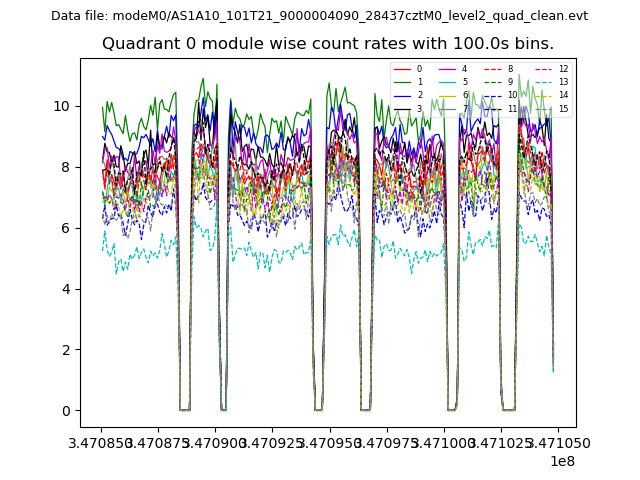 |
 |
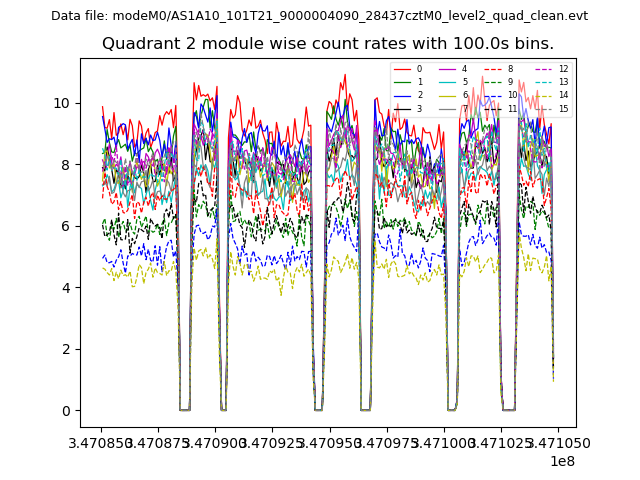
| Module-wise count rates for Quadrant B Data is divided into 100 sec bins |
 |
 |
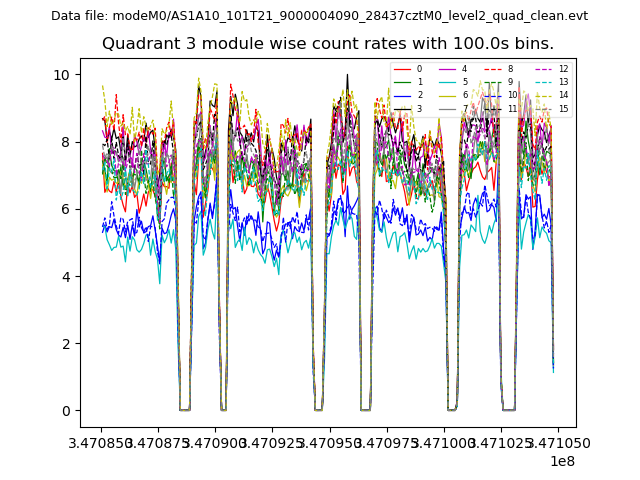
| Module-wise count rates for Quadrant C Data is divided into 100 sec bins |
 |
 |
| Module-wise count rates for Quadrant D Data is divided into 100 sec bins |
 |
 |
| Parameter | Plot |
|---|---|
| CZT HV Monitor | 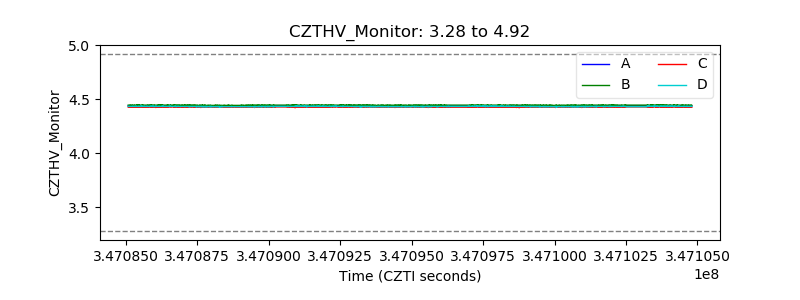 |
| D_VDD | 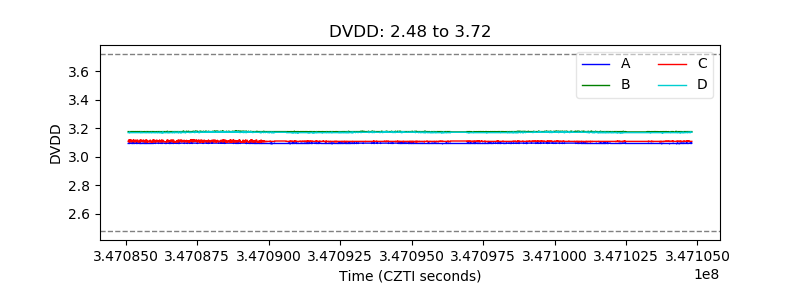 |
| Temperature 1 | 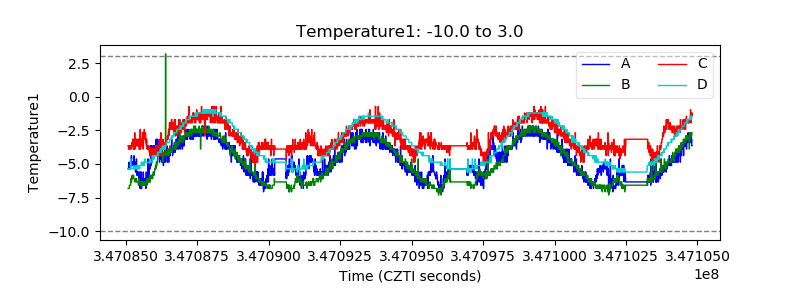 |
| Veto HV Monitor | 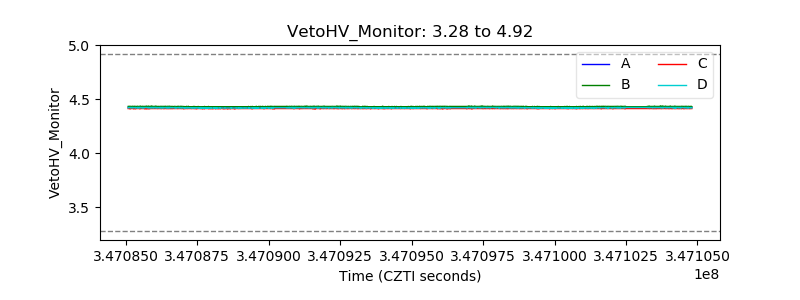 |
| Veto LLD | 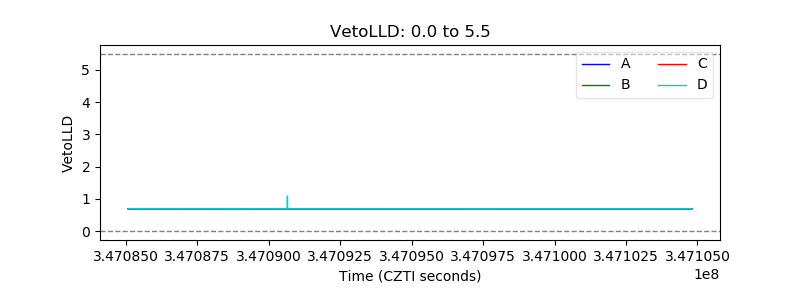 |
| Alpha Counter | 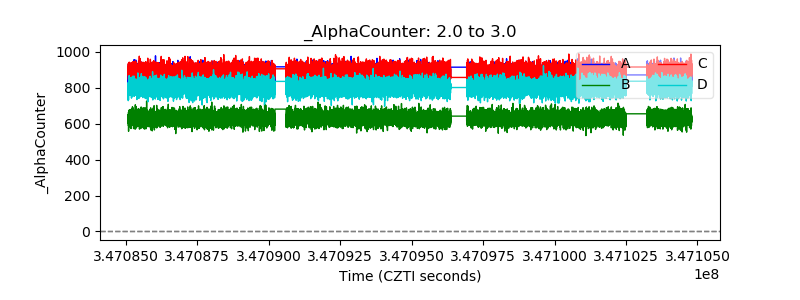 |
| _CPM_Rate | 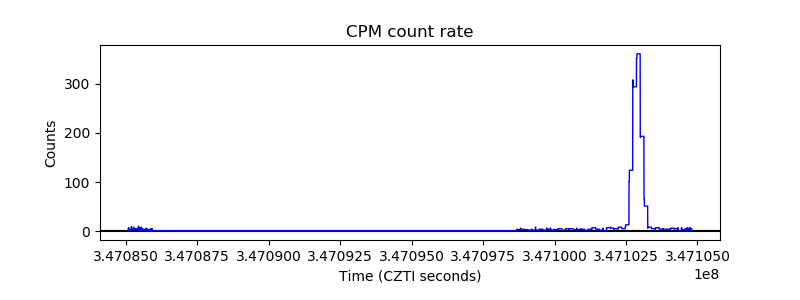 |
| CZT Counter | 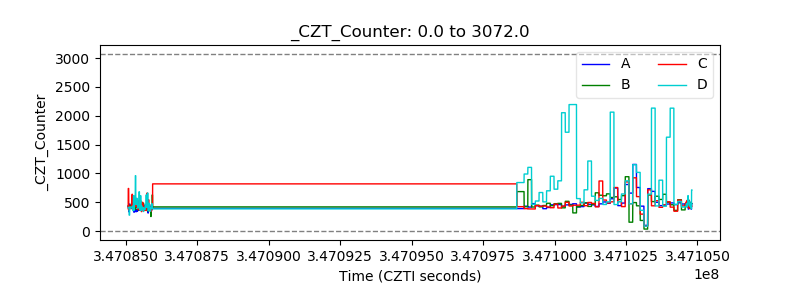 |
| +2.5 Volts monitor |  |
| +5 Volts monitor |  |
| _ROLL_ROT | 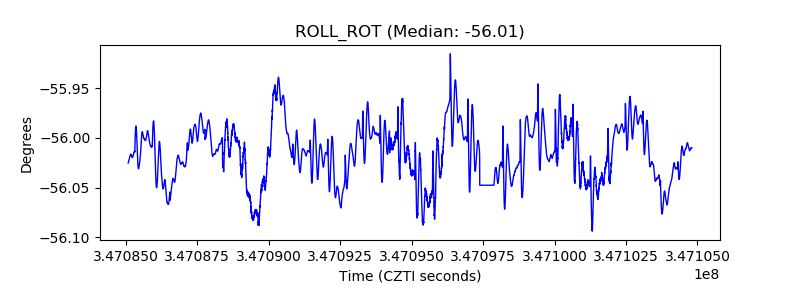 |
| _Roll_DEC | 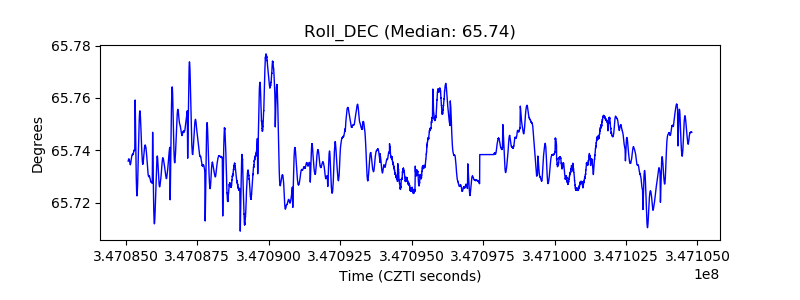 |
| _Roll_RA | 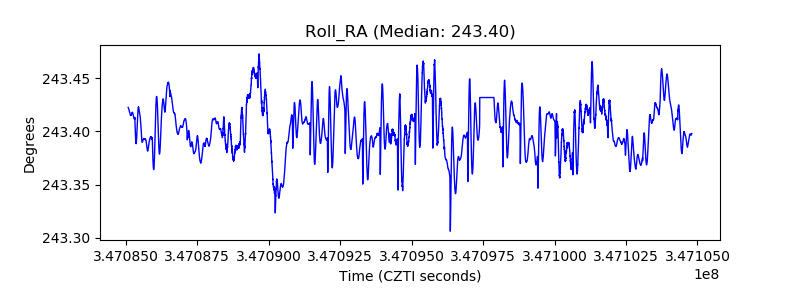 |
| Veto Counter | 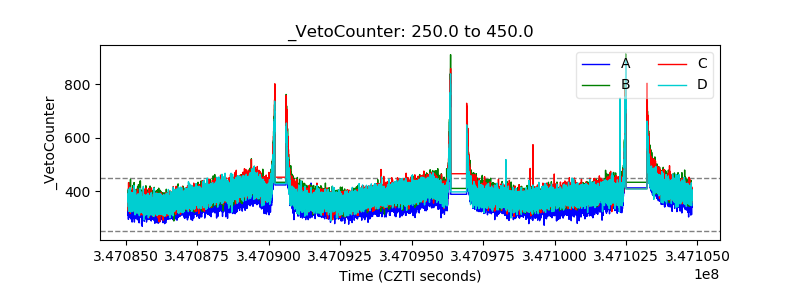 |