| Param | Original file | Final file |
|---|---|---|
| Filename | modeM0/AS1A10_101T21_9000004090_28438cztM0_level2.evt | modeM0/AS1A10_101T21_9000004090_28438cztM0_level2_quad_clean.evt |
| Size (bytes) | 478,114,560 | 110,422,080 |
| Size | 456.0 MB | 105.3 MB |
| Events in quadrant A | 2,895,234 | 746,436 |
| Events in quadrant B | 3,320,033 | 751,770 |
| Events in quadrant C | 2,912,624 | 720,803 |
| Events in quadrant D | 4,927,025 | 688,614 |
| Mode M0 | |||
|---|---|---|---|
| Quadrant | BADHDUFLAG | Total packets | Discarded packets |
| A | 0 | 12709 | 0 |
| B | 0 | 13680 | 0 |
| C | 0 | 12678 | 0 |
| D | 0 | 18527 | 0 |
| Mode M9 | |||
|---|---|---|---|
| Quadrant | BADHDUFLAG | Total packets | Discarded packets |
| A | 0 | 9 | 0 |
| B | 0 | 9 | 0 |
| C | 0 | 9 | 0 |
| D | 0 | 9 | 0 |
| Quadrant | Total seconds | Saturated seconds | Saturation percentage |
|---|---|---|---|
| A | 6257 | 48 | 0.767141% |
| B | 6257 | 41 | 0.655266% |
| C | 6257 | 52 | 0.831069% |
| D | 6257 | 605 | 9.669171% |
Noise dominated data is calculated using 1-second bins in cleaned event files. If a bin has >2000 counts, and if more than 50% of those come from <1% of pixels, then it is considered to be noise-dominated and hence unusable.
| Quadrant | # 1 sec bins | Bins with >0 counts | Bins with >2000 counts | High rate bins dominated by noise | Noise dominated (total time) | Noise dominated (detector-on time) | Marked lightcurve |
|---|---|---|---|---|---|---|---|
| A | 7182 | 6257 | 0 | 0 | 0.00% | 0.00% | 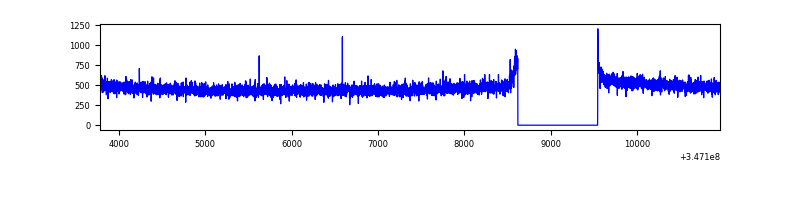 |
| B | 7182 | 6257 | 2 | 2 | 0.03% | 0.03% | 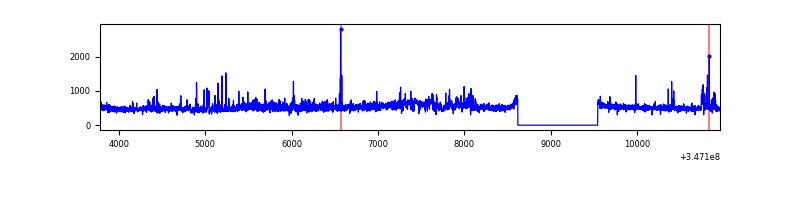 |
| C | 7182 | 6257 | 0 | 0 | 0.00% | 0.00% | 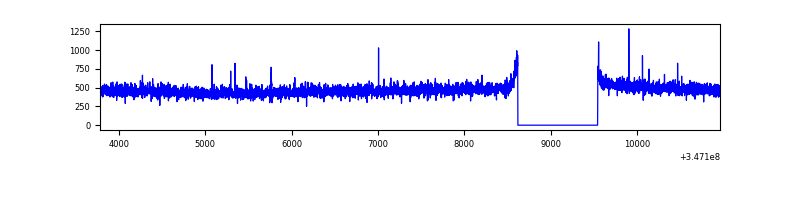 |
| D | 7182 | 6257 | 740 | 740 | 10.30% | 11.83% | 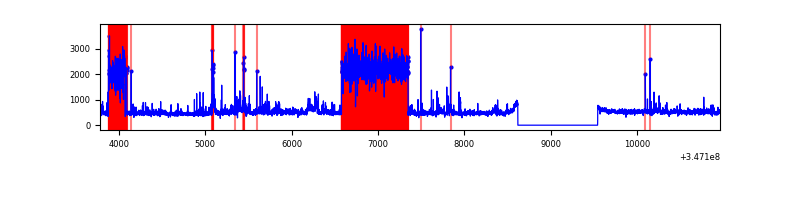 |
Top three noisy pixels from each quadrant. If the there are fewer than three noisy pixels in the level2.evt file, extra rows are filled as -1
| Pixel properties | Quadrant properties | ||||||
|---|---|---|---|---|---|---|---|
| Quadrant | DetID | PixID | Counts | Sigma | Mean | Median | Sigma |
| A | 13 | 254 | 9464 | 58.06 | 749 | 733 | 150.4 |
| A | 3 | 137 | 7293 | 43.62 | 749 | 733 | 150.4 |
| A | 0 | 226 | 6301 | 37.02 | 749 | 733 | 150.4 |
| B | 10 | 245 | 345016 | 2441.38 | 737 | 718 | 141.0 |
| B | 15 | 222 | 29767 | 205.98 | 737 | 718 | 141.0 |
| B | 0 | 190 | 22918 | 157.42 | 737 | 718 | 141.0 |
| C | 14 | 238 | 114476 | 680.3 | 713 | 715 | 167.2 |
| C | 7 | 220 | 8668 | 47.56 | 713 | 715 | 167.2 |
| C | 2 | 16 | 8103 | 44.18 | 713 | 715 | 167.2 |
| D | 8 | 195 | 1820255 | 10736.7 | 712 | 691 | 169.5 |
| D | 1 | 52 | 338368 | 1992.53 | 712 | 691 | 169.5 |
| D | 2 | 250 | 34104 | 197.16 | 712 | 691 | 169.5 |
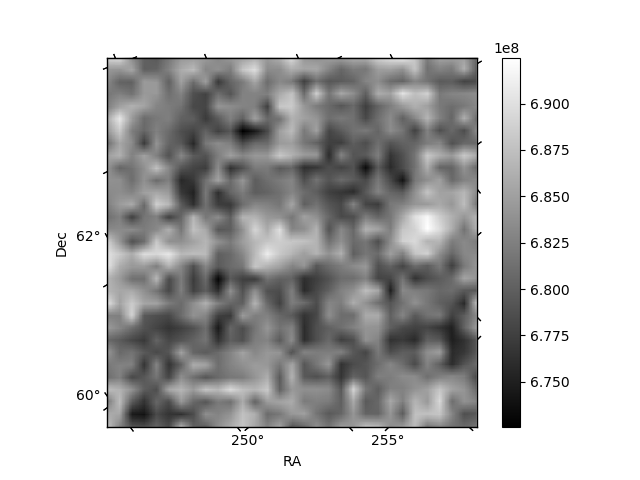
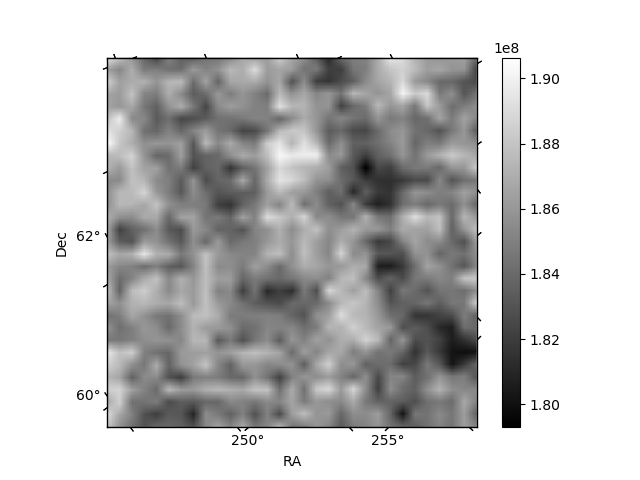
Histogram calculated using DETX and DETY for each event in the final _common_clean file
| Quadrant A | 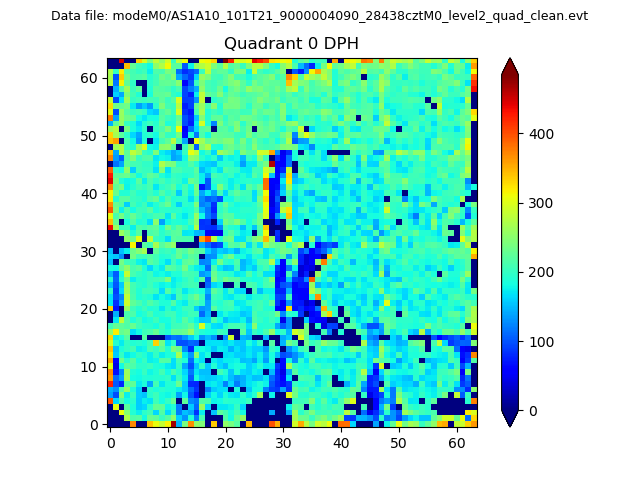 |
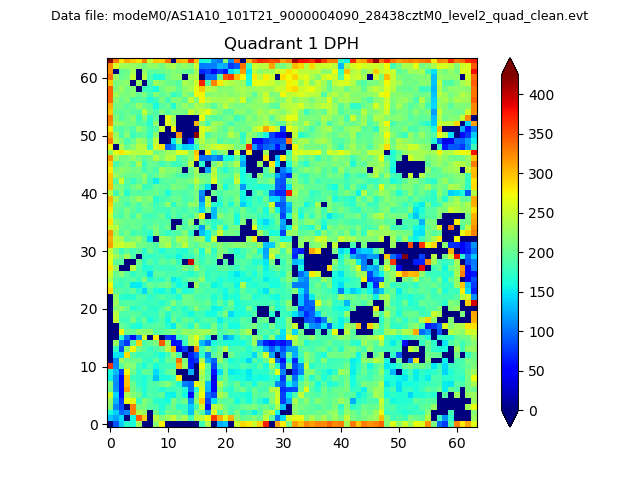 |
Quadrant B |
|---|---|---|---|
| Quadrant D |  |
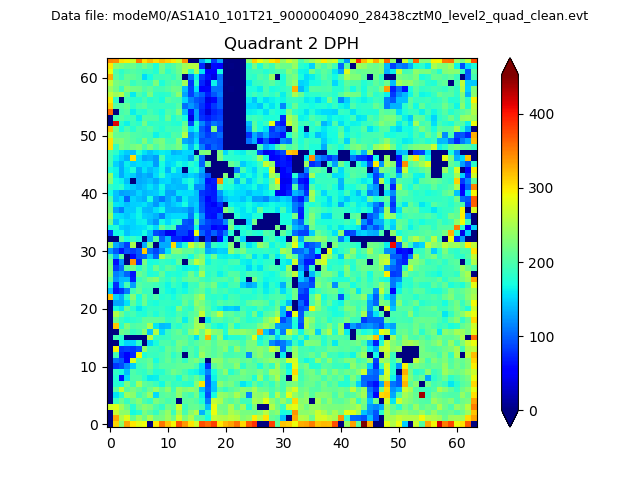 |
Quadrant C |
| Plot type | Count rate plots | Images |
|---|---|---|
| Comparison with Poisson distribution Blue bars denote a histogram of data divided into 1 sec bins. Red curve is a Poisson curve with rate = median count rate of data. |
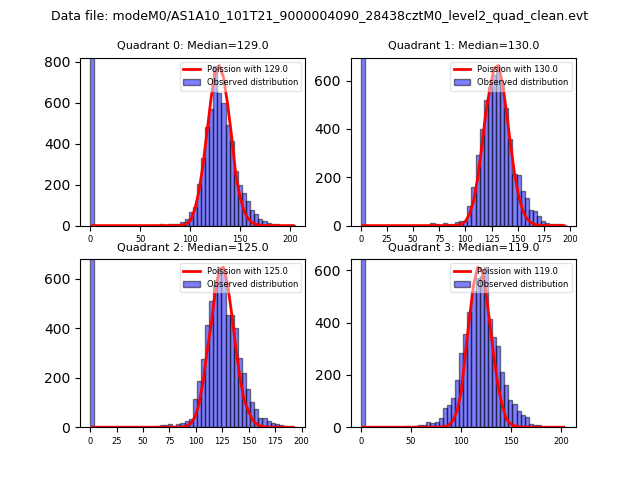 |
 |
| Quadrant-wise count rates Data is divided into 100 sec bins |
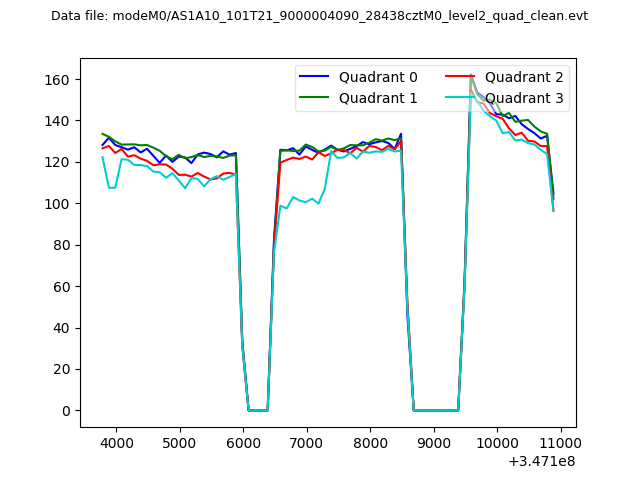 |
|
| Module-wise count rates for Quadrant A Data is divided into 100 sec bins |
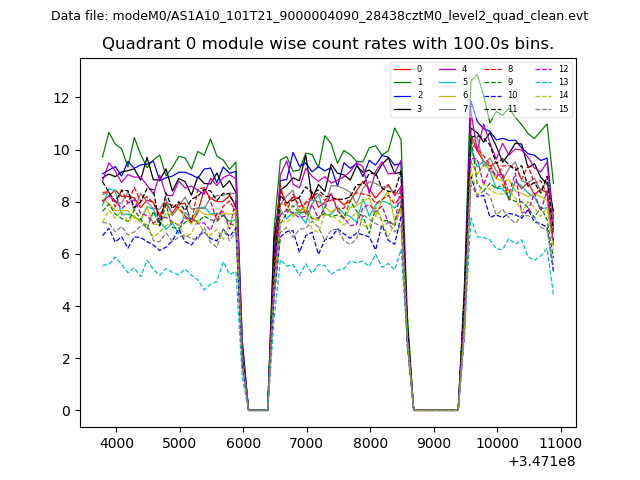 |
 |
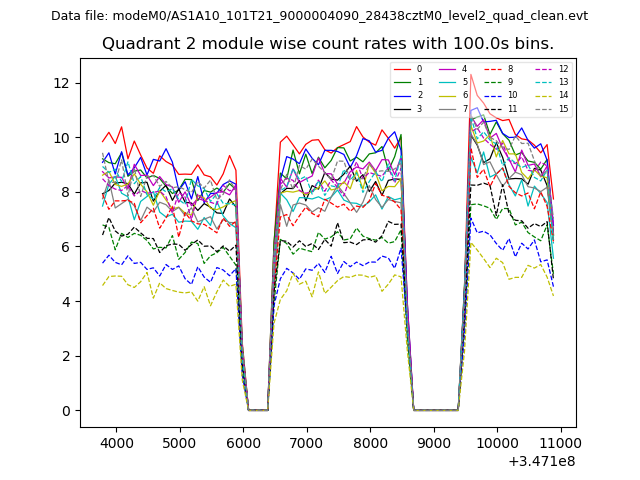
| Module-wise count rates for Quadrant B Data is divided into 100 sec bins |
 |
 |
| Module-wise count rates for Quadrant C Data is divided into 100 sec bins |
 |
 |
| Module-wise count rates for Quadrant D Data is divided into 100 sec bins |
 |
 |
| Parameter | Plot |
|---|---|
| CZT HV Monitor | 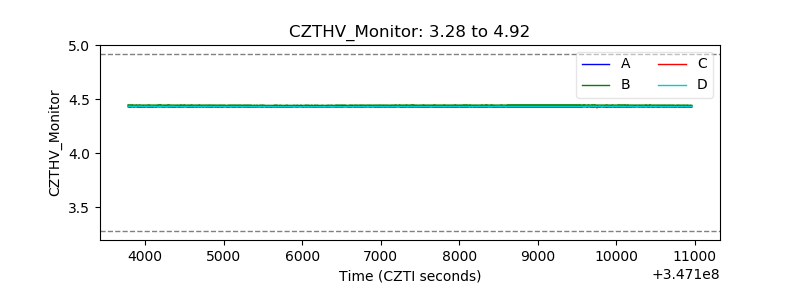 |
| D_VDD | 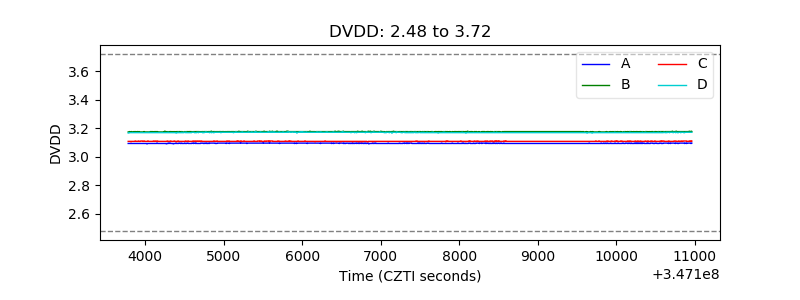 |
| Temperature 1 | 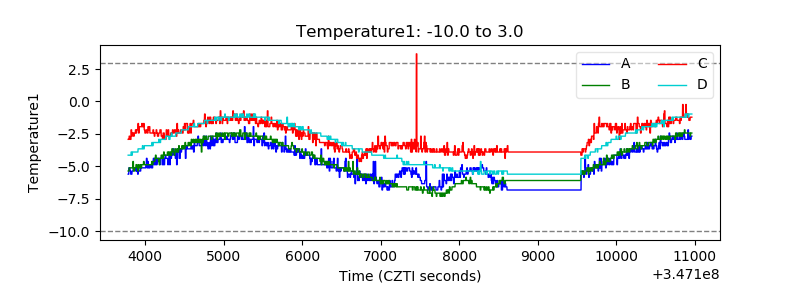 |
| Veto HV Monitor | 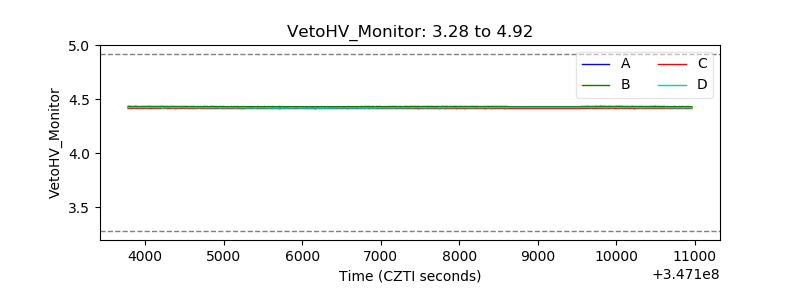 |
| Veto LLD | 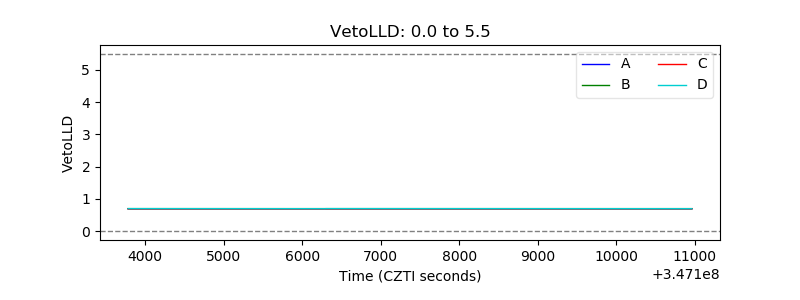 |
| Alpha Counter | 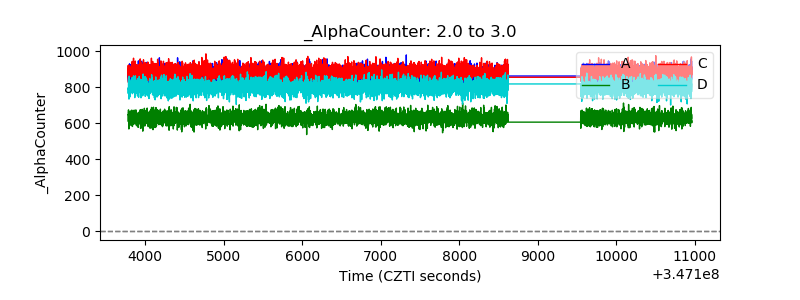 |
| _CPM_Rate | 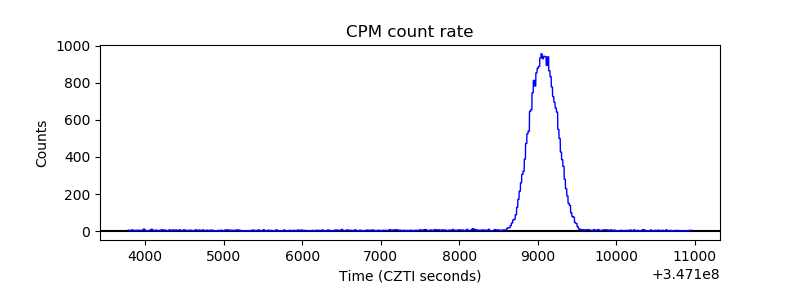 |
| CZT Counter | 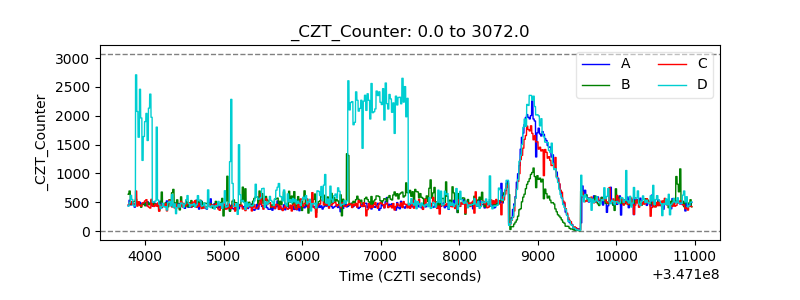 |
| +2.5 Volts monitor | 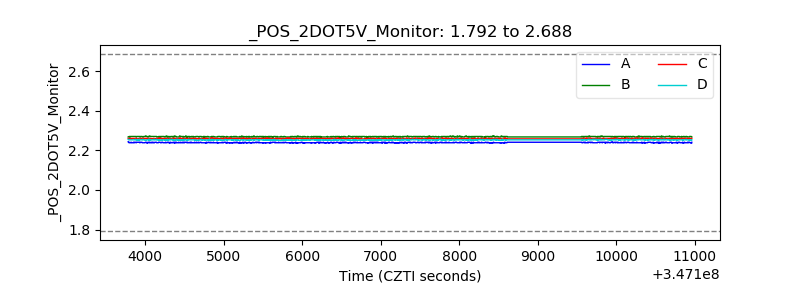 |
| +5 Volts monitor | 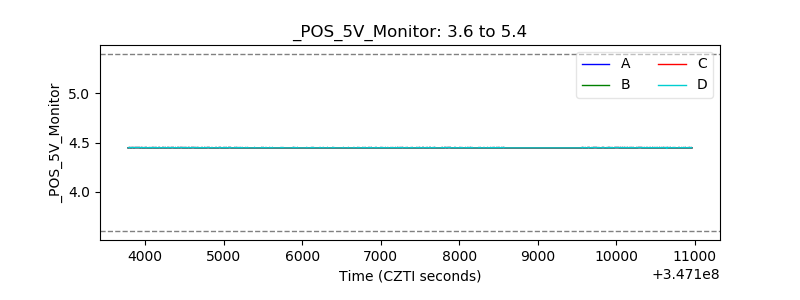 |
| _ROLL_ROT | 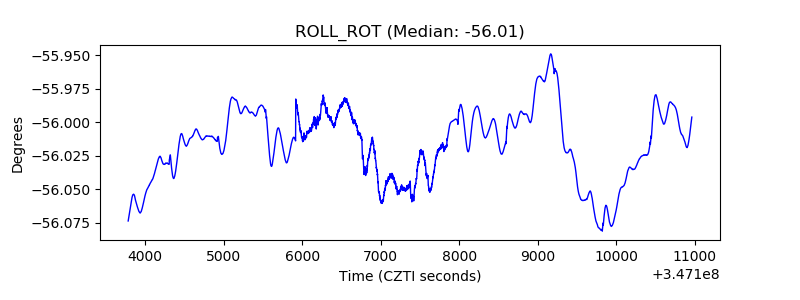 |
| _Roll_DEC | 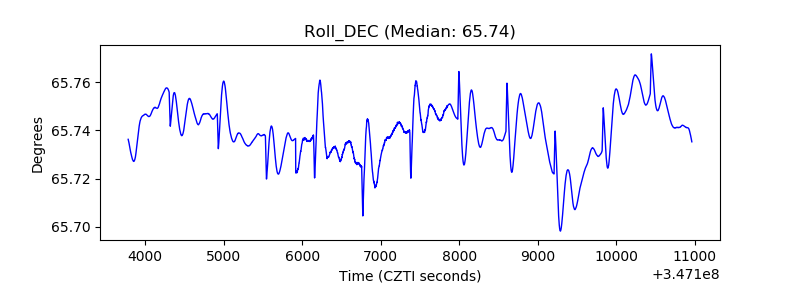 |
| _Roll_RA | 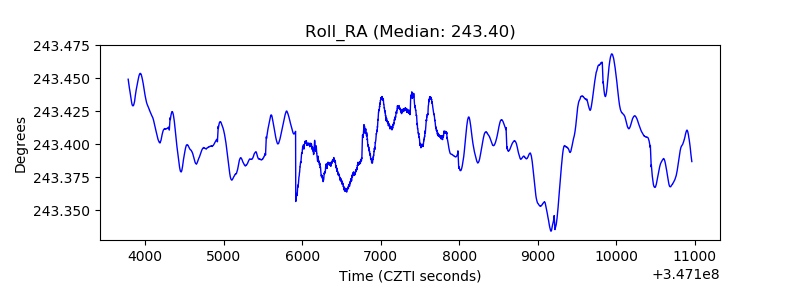 |
| Veto Counter | 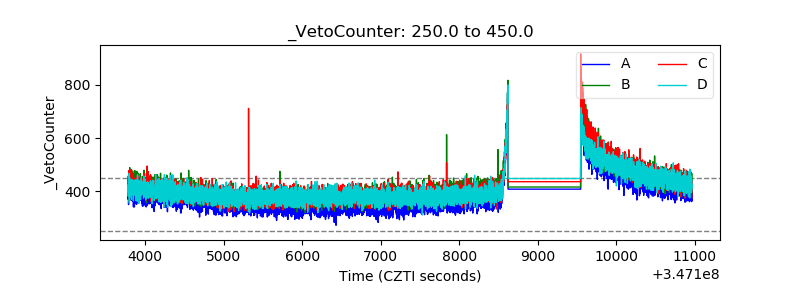 |