| Param | Original file | Final file |
|---|---|---|
| Filename | modeM0/AS1A10_101T21_9000004090_28440cztM0_level2.evt | modeM0/AS1A10_101T21_9000004090_28440cztM0_level2_quad_clean.evt |
| Size (bytes) | 505,503,360 | 111,090,240 |
| Size | 482.1 MB | 105.9 MB |
| Events in quadrant A | 2,886,428 | 757,986 |
| Events in quadrant B | 4,146,325 | 749,569 |
| Events in quadrant C | 2,910,849 | 731,090 |
| Events in quadrant D | 4,955,878 | 703,774 |
| Mode M0 | |||
|---|---|---|---|
| Quadrant | BADHDUFLAG | Total packets | Discarded packets |
| A | 0 | 12515 | 0 |
| B | 0 | 16113 | 0 |
| C | 0 | 12457 | 0 |
| D | 0 | 18625 | 0 |
| Mode M9 | |||
|---|---|---|---|
| Quadrant | BADHDUFLAG | Total packets | Discarded packets |
| A | 0 | 10 | 0 |
| B | 0 | 10 | 0 |
| C | 0 | 10 | 0 |
| D | 0 | 10 | 0 |
| Quadrant | Total seconds | Saturated seconds | Saturation percentage |
|---|---|---|---|
| A | 6035 | 56 | 0.927920% |
| B | 6036 | 363 | 6.013917% |
| C | 6036 | 91 | 1.507621% |
| D | 6036 | 413 | 6.842280% |
Noise dominated data is calculated using 1-second bins in cleaned event files. If a bin has >2000 counts, and if more than 50% of those come from <1% of pixels, then it is considered to be noise-dominated and hence unusable.
| Quadrant | # 1 sec bins | Bins with >0 counts | Bins with >2000 counts | High rate bins dominated by noise | Noise dominated (total time) | Noise dominated (detector-on time) | Marked lightcurve |
|---|---|---|---|---|---|---|---|
| A | 7105 | 6035 | 0 | 0 | 0.00% | 0.00% | 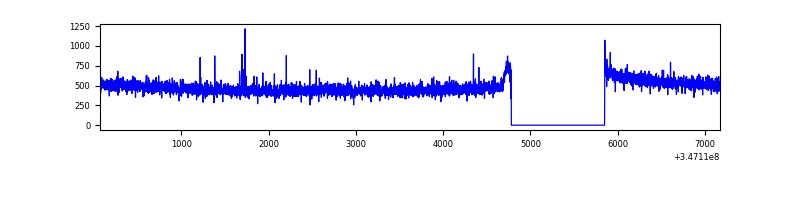 |
| B | 7106 | 6036 | 250 | 250 | 3.52% | 4.14% | 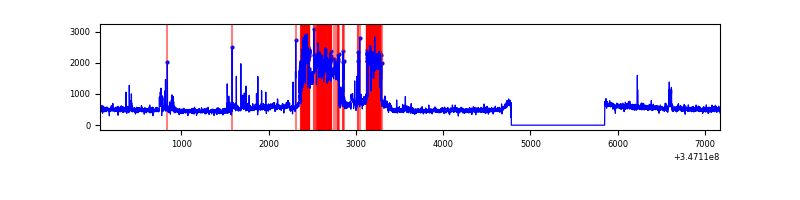 |
| C | 7106 | 6036 | 0 | 0 | 0.00% | 0.00% | 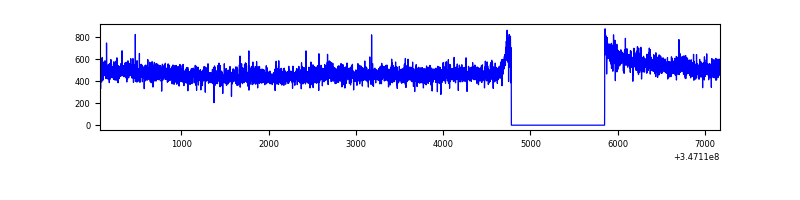 |
| D | 7106 | 6036 | 562 | 562 | 7.91% | 9.31% | 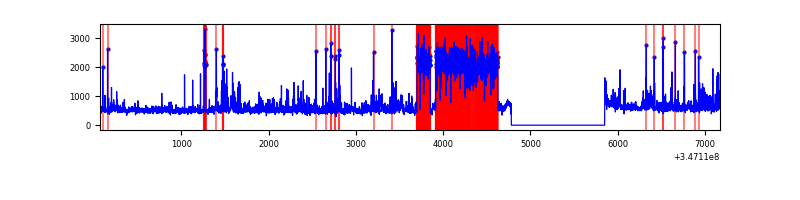 |
Top three noisy pixels from each quadrant. If the there are fewer than three noisy pixels in the level2.evt file, extra rows are filled as -1
| Pixel properties | Quadrant properties | ||||||
|---|---|---|---|---|---|---|---|
| Quadrant | DetID | PixID | Counts | Sigma | Mean | Median | Sigma |
| A | 13 | 254 | 9404 | 58.43 | 744 | 728 | 148.5 |
| A | 15 | 169 | 9192 | 57.0 | 744 | 728 | 148.5 |
| A | 3 | 137 | 7141 | 43.19 | 744 | 728 | 148.5 |
| B | 10 | 245 | 1190266 | 8790.1 | 723 | 705 | 135.3 |
| B | 0 | 183 | 56685 | 413.65 | 723 | 705 | 135.3 |
| B | 0 | 190 | 27469 | 197.77 | 723 | 705 | 135.3 |
| C | 14 | 238 | 115880 | 700.3 | 711 | 716 | 164.4 |
| C | 7 | 220 | 14348 | 82.89 | 711 | 716 | 164.4 |
| C | 2 | 16 | 5413 | 28.56 | 711 | 716 | 164.4 |
| D | 8 | 195 | 1558269 | 9269.59 | 715 | 696 | 168.0 |
| D | 1 | 52 | 597083 | 3549.28 | 715 | 696 | 168.0 |
| D | 2 | 250 | 54318 | 319.12 | 715 | 696 | 168.0 |
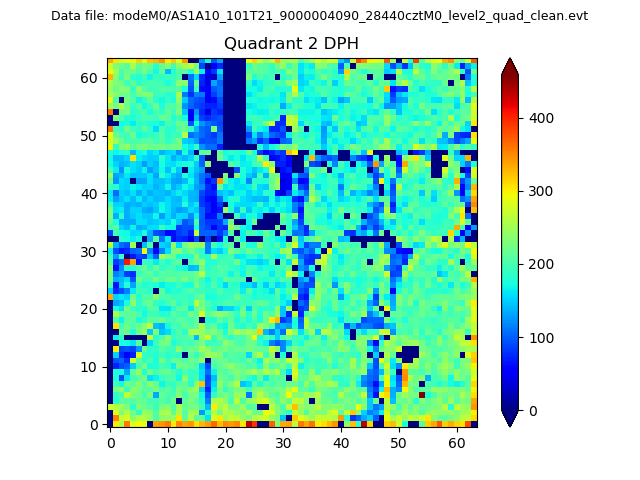
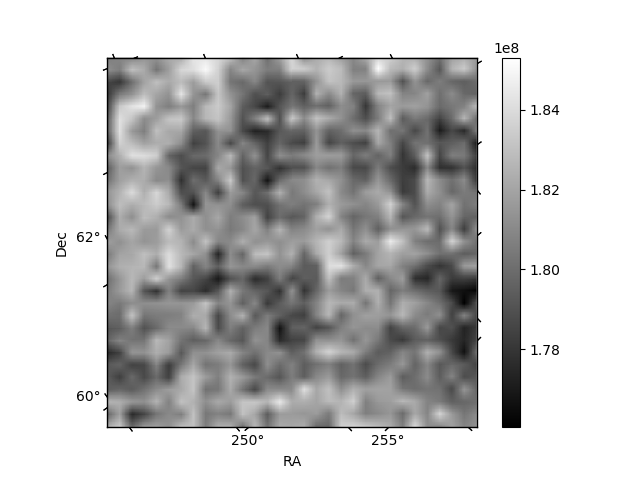
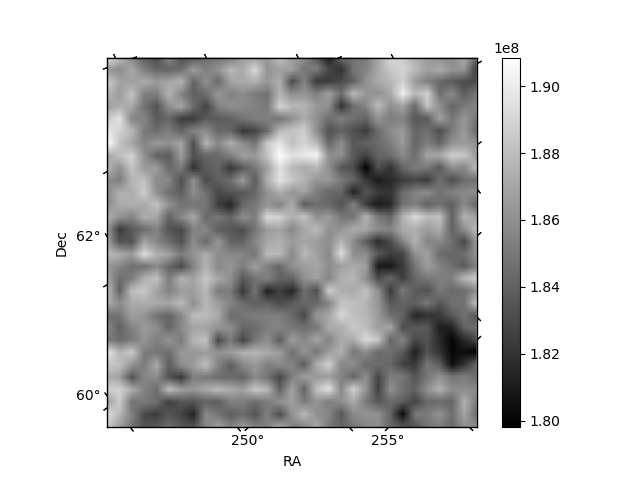
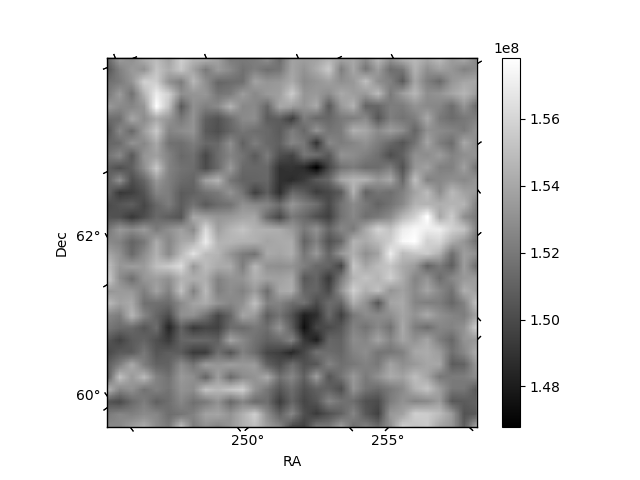
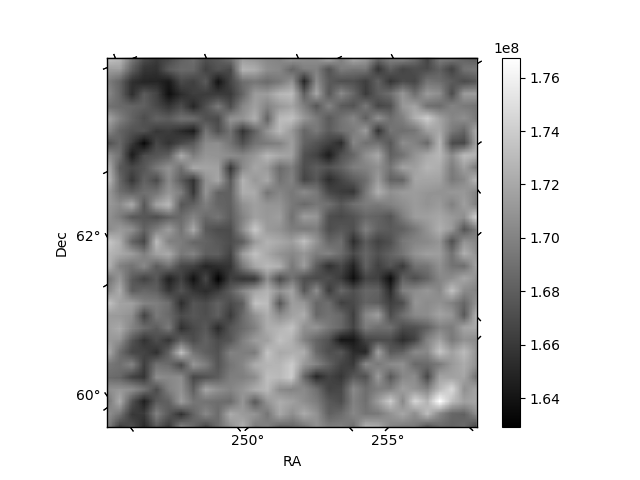
Histogram calculated using DETX and DETY for each event in the final _common_clean file
| Quadrant A | 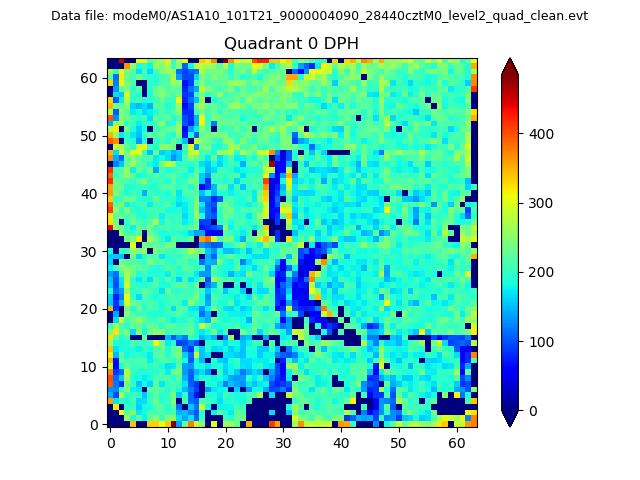 |
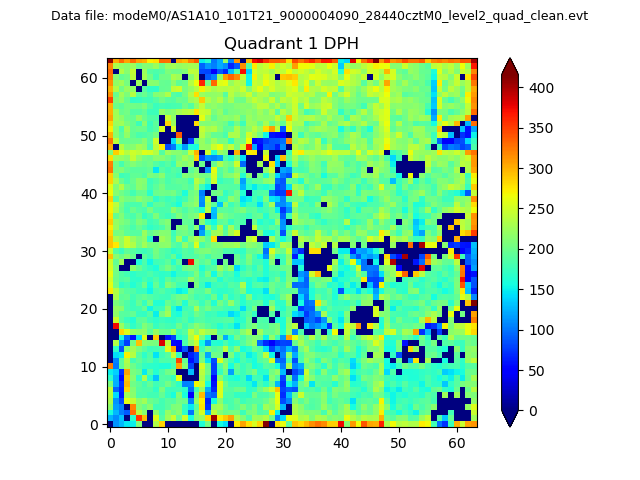 |
Quadrant B |
|---|---|---|---|
| Quadrant D | 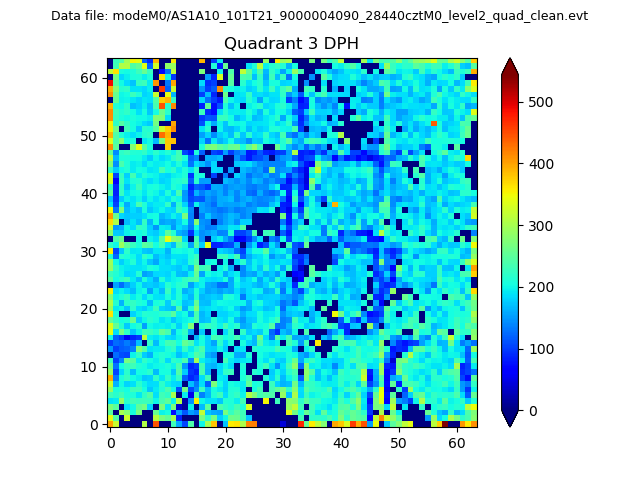 |
 |
Quadrant C |
| Plot type | Count rate plots | Images |
|---|---|---|
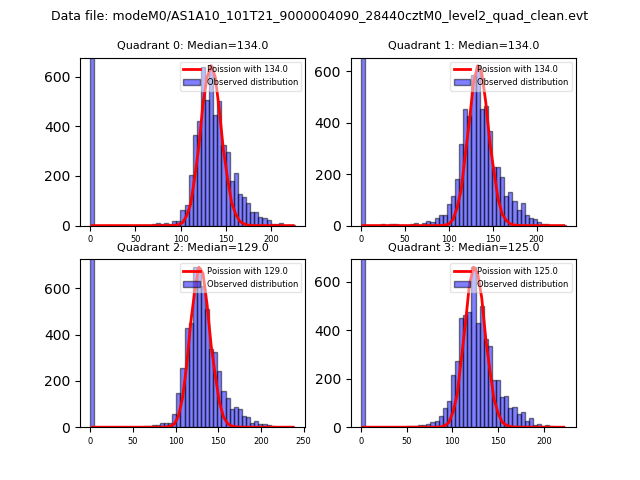
| Comparison with Poisson distribution Blue bars denote a histogram of data divided into 1 sec bins. Red curve is a Poisson curve with rate = median count rate of data. |
 |
 |
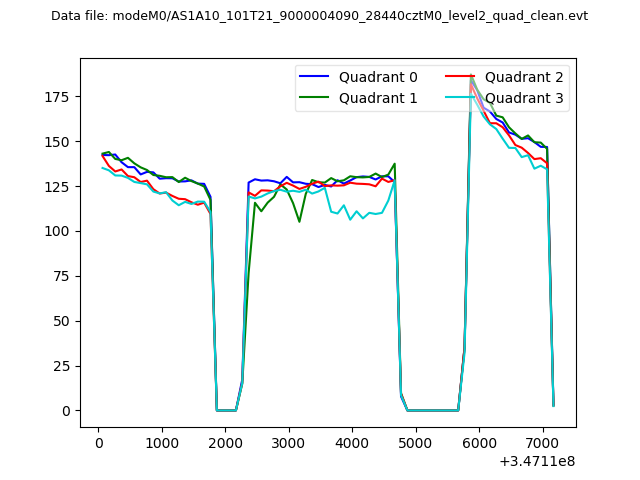
| Quadrant-wise count rates Data is divided into 100 sec bins |
 |
|
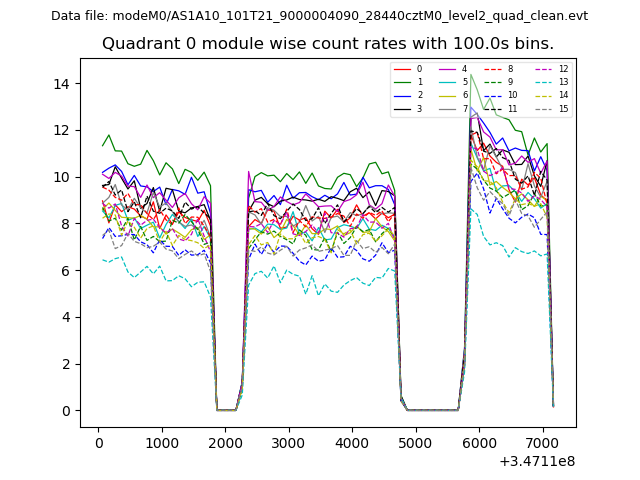
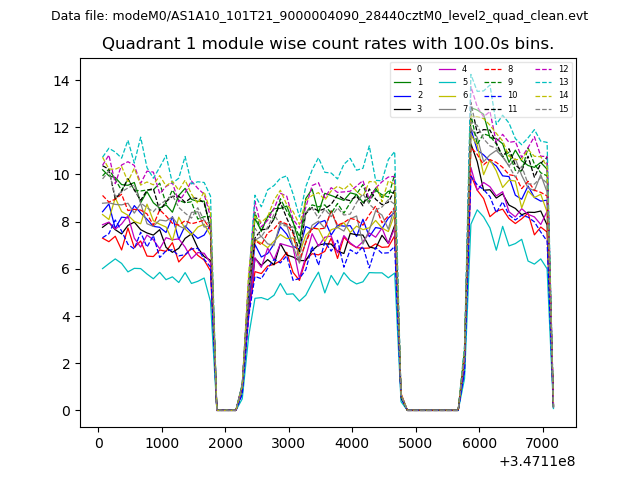
| Module-wise count rates for Quadrant A Data is divided into 100 sec bins |
 |
 |
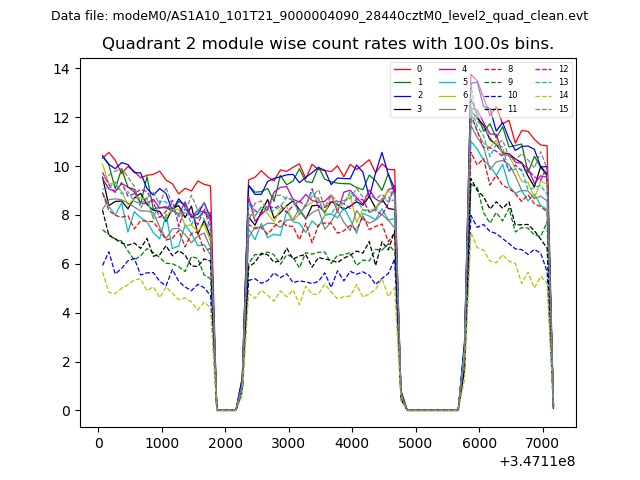
| Module-wise count rates for Quadrant B Data is divided into 100 sec bins |
 |
 |
| Module-wise count rates for Quadrant C Data is divided into 100 sec bins |
 |
 |
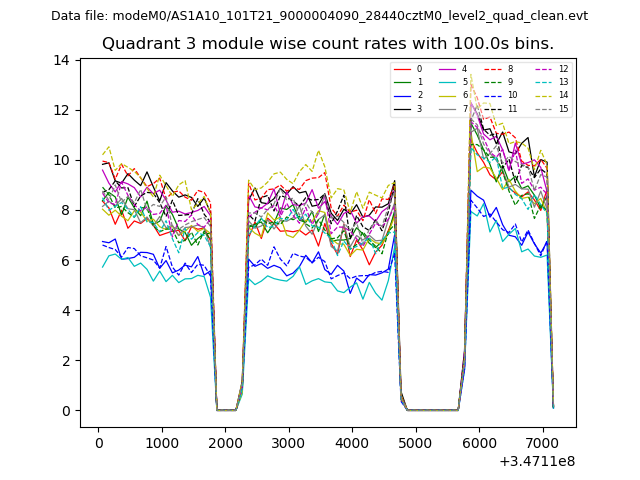
| Module-wise count rates for Quadrant D Data is divided into 100 sec bins |
 |
 |
| Parameter | Plot |
|---|---|
| CZT HV Monitor | 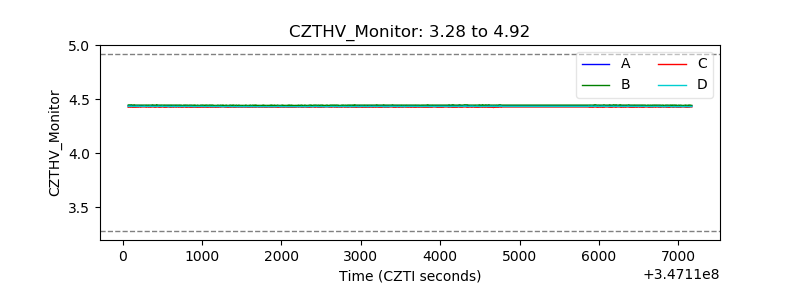 |
| D_VDD | 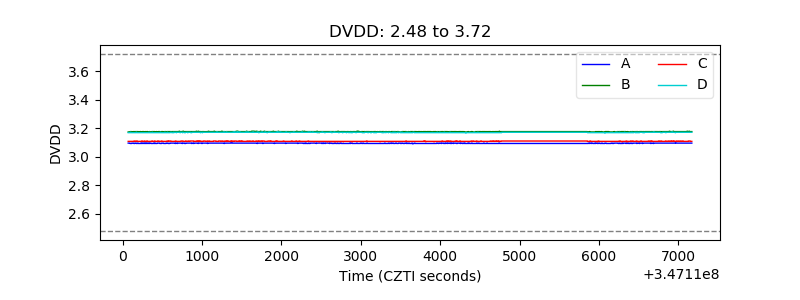 |
| Temperature 1 | 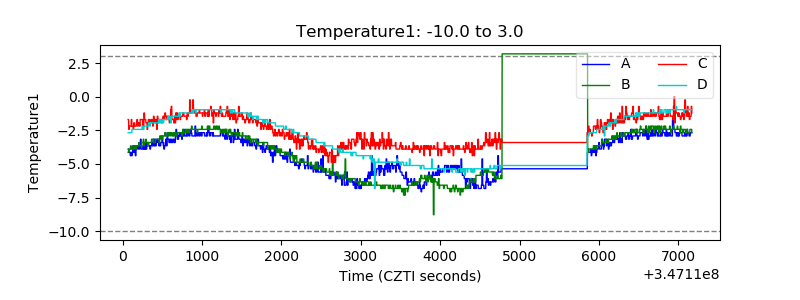 |
| Veto HV Monitor | 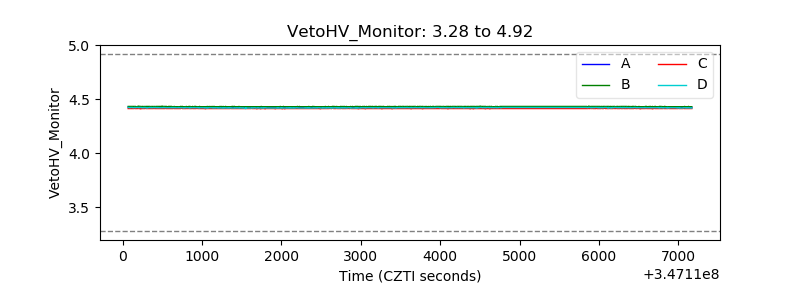 |
| Veto LLD | 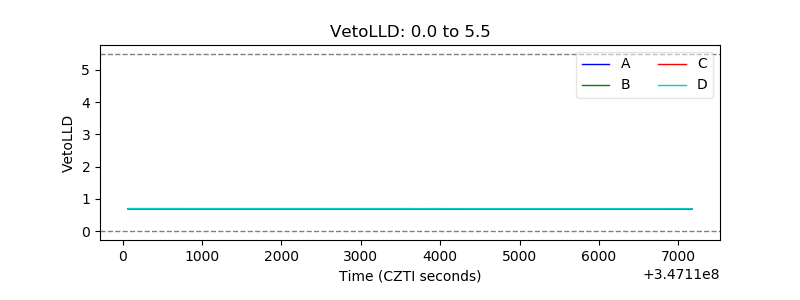 |
| Alpha Counter |  |
| _CPM_Rate |  |
| CZT Counter | 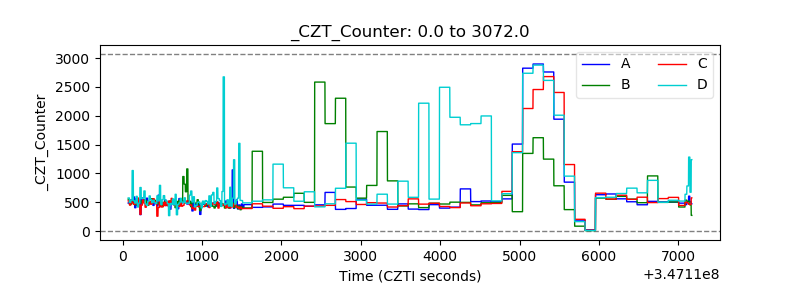 |
| +2.5 Volts monitor |  |
| +5 Volts monitor |  |
| _ROLL_ROT | 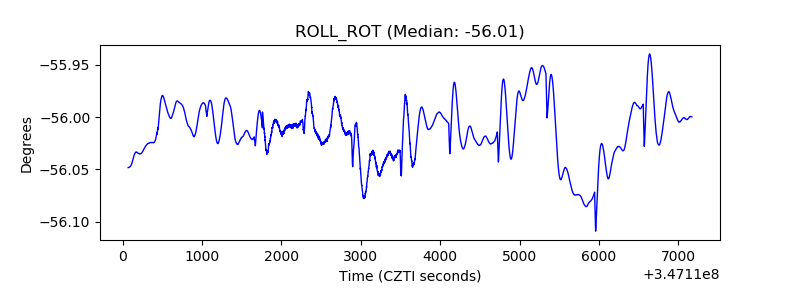 |
| _Roll_DEC | 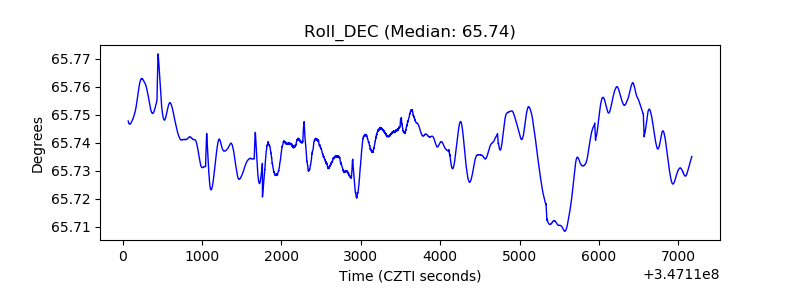 |
| _Roll_RA | 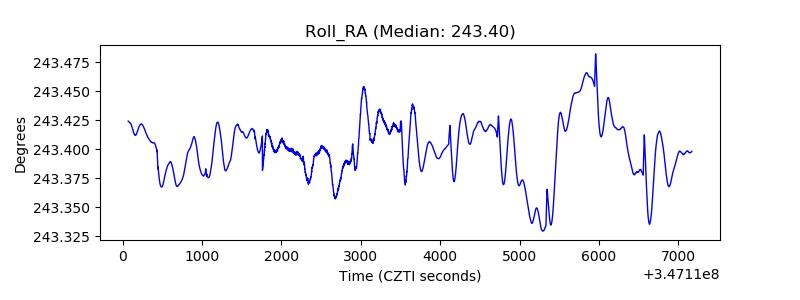 |
| Veto Counter | 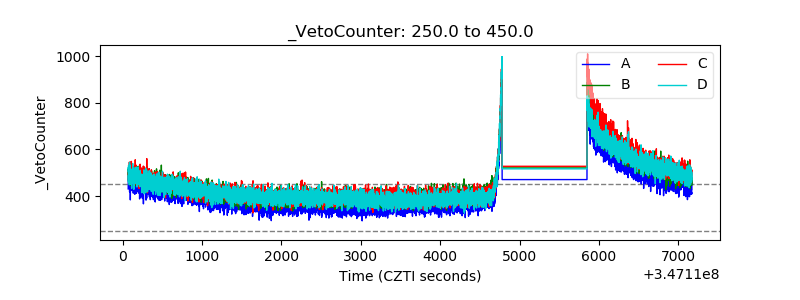 |