| Param | Original file | Final file |
|---|---|---|
| Filename | modeM0/AS1A10_101T21_9000004090_28441cztM0_level2.evt | modeM0/AS1A10_101T21_9000004090_28441cztM0_level2_quad_clean.evt |
| Size (bytes) | 464,616,000 | 117,472,320 |
| Size | 443.1 MB | 112.0 MB |
| Events in quadrant A | 2,980,902 | 798,697 |
| Events in quadrant B | 3,163,334 | 805,959 |
| Events in quadrant C | 3,029,136 | 779,259 |
| Events in quadrant D | 4,489,536 | 754,363 |
| Mode M0 | |||
|---|---|---|---|
| Quadrant | BADHDUFLAG | Total packets | Discarded packets |
| A | 0 | 12747 | 0 |
| B | 0 | 13232 | 0 |
| C | 0 | 12796 | 0 |
| D | 0 | 17424 | 0 |
| Mode M9 | |||
|---|---|---|---|
| Quadrant | BADHDUFLAG | Total packets | Discarded packets |
| A | 0 | 12 | 0 |
| B | 0 | 12 | 0 |
| C | 0 | 12 | 0 |
| D | 0 | 12 | 0 |
| Quadrant | Total seconds | Saturated seconds | Saturation percentage |
|---|---|---|---|
| A | 6009 | 67 | 1.114994% |
| B | 6010 | 81 | 1.347754% |
| C | 6010 | 90 | 1.497504% |
| D | 6010 | 340 | 5.657238% |
Noise dominated data is calculated using 1-second bins in cleaned event files. If a bin has >2000 counts, and if more than 50% of those come from <1% of pixels, then it is considered to be noise-dominated and hence unusable.
| Quadrant | # 1 sec bins | Bins with >0 counts | Bins with >2000 counts | High rate bins dominated by noise | Noise dominated (total time) | Noise dominated (detector-on time) | Marked lightcurve |
|---|---|---|---|---|---|---|---|
| A | 7204 | 6009 | 7 | 7 | 0.10% | 0.12% | 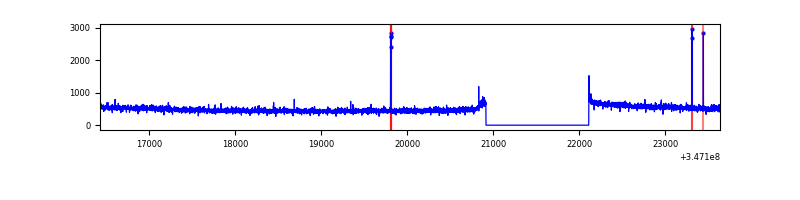 |
| B | 7205 | 6010 | 23 | 23 | 0.32% | 0.38% | 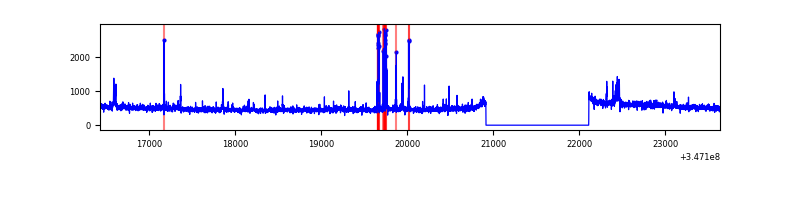 |
| C | 7205 | 6010 | 0 | 0 | 0.00% | 0.00% | 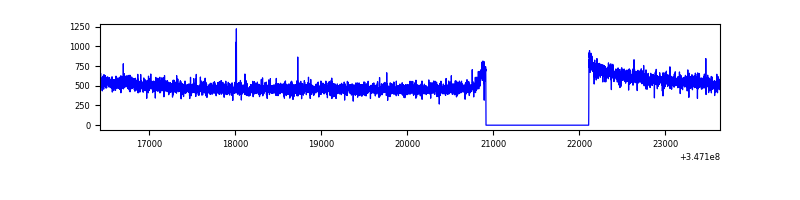 |
| D | 7205 | 6010 | 349 | 349 | 4.84% | 5.81% | 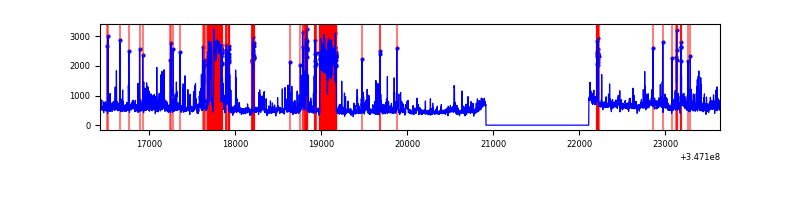 |
Top three noisy pixels from each quadrant. If the there are fewer than three noisy pixels in the level2.evt file, extra rows are filled as -1
| Pixel properties | Quadrant properties | ||||||
|---|---|---|---|---|---|---|---|
| Quadrant | DetID | PixID | Counts | Sigma | Mean | Median | Sigma |
| A | 15 | 169 | 25901 | 165.3 | 765 | 750 | 152.2 |
| A | 13 | 254 | 9952 | 60.48 | 765 | 750 | 152.2 |
| A | 3 | 137 | 7005 | 41.11 | 765 | 750 | 152.2 |
| B | 10 | 245 | 117338 | 828.56 | 753 | 734 | 140.7 |
| B | 0 | 190 | 57240 | 401.52 | 753 | 734 | 140.7 |
| B | 0 | 230 | 18467 | 126.01 | 753 | 734 | 140.7 |
| C | 14 | 238 | 120527 | 698.57 | 743 | 749 | 171.5 |
| C | 7 | 220 | 8209 | 43.51 | 743 | 749 | 171.5 |
| C | 2 | 16 | 5730 | 29.05 | 743 | 749 | 171.5 |
| D | 2 | 250 | 585549 | 3345.16 | 738 | 717 | 174.8 |
| D | 8 | 195 | 543637 | 3105.43 | 738 | 717 | 174.8 |
| D | 1 | 52 | 516046 | 2947.61 | 738 | 717 | 174.8 |
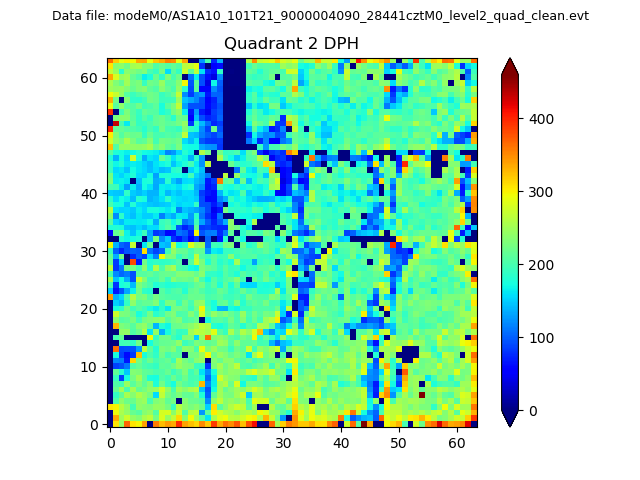
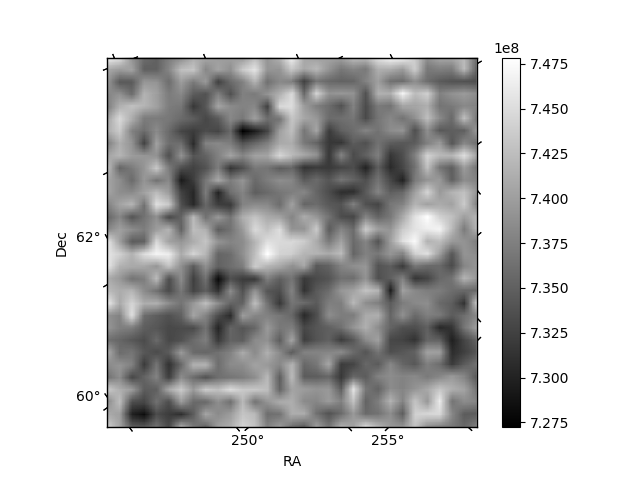
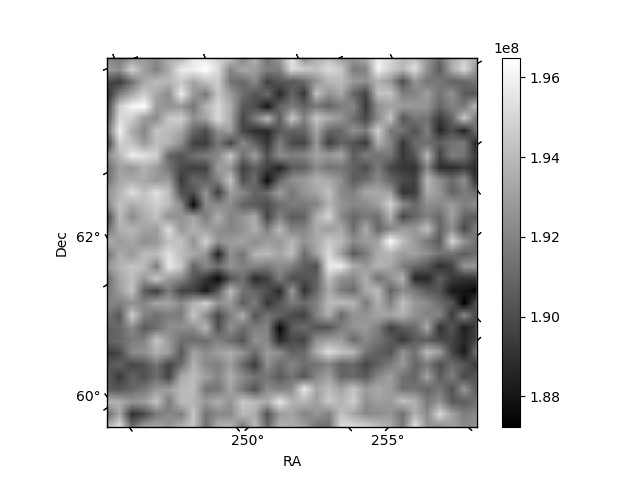
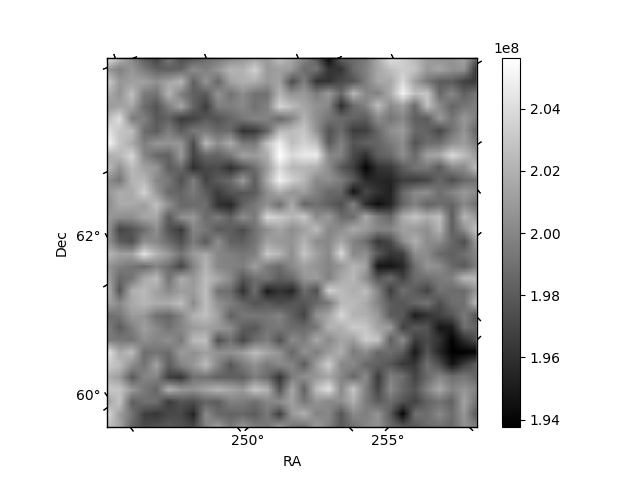
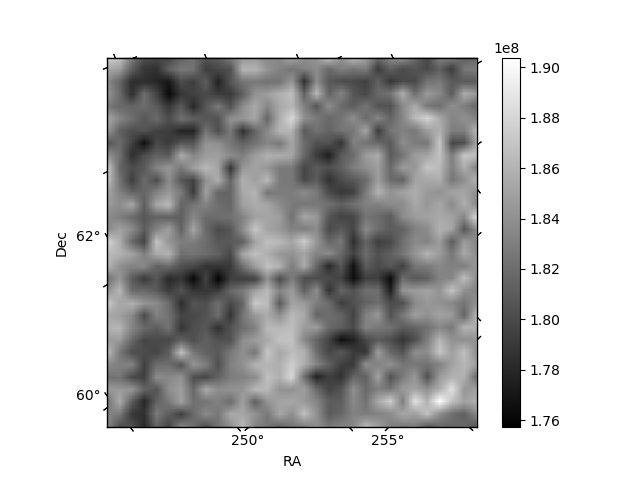
Histogram calculated using DETX and DETY for each event in the final _common_clean file
| Quadrant A | 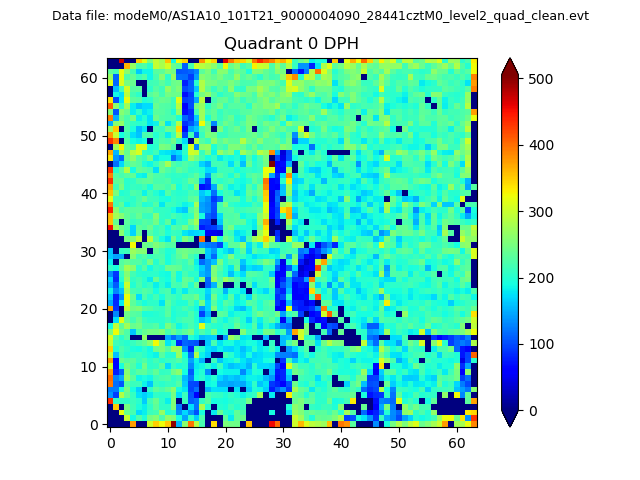 |
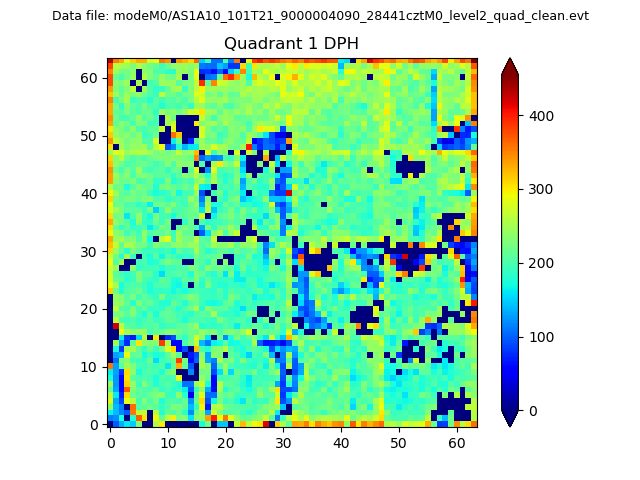 |
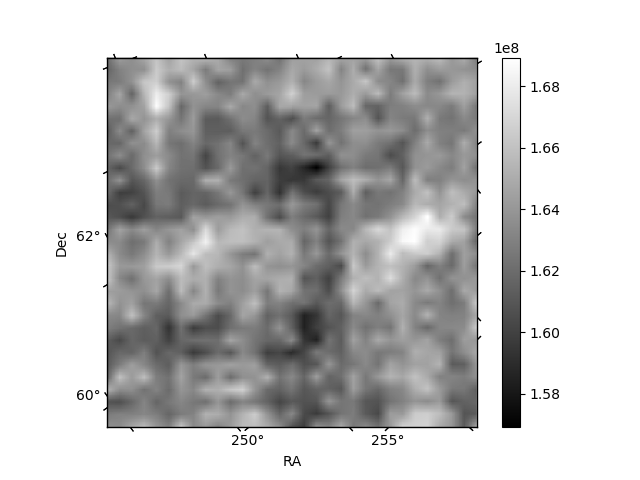
Quadrant B |
|---|---|---|---|
| Quadrant D | 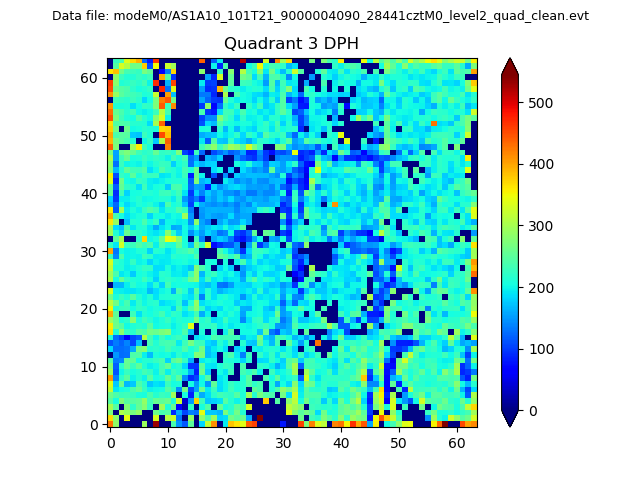 |
 |
Quadrant C |
| Plot type | Count rate plots | Images |
|---|---|---|
| Comparison with Poisson distribution Blue bars denote a histogram of data divided into 1 sec bins. Red curve is a Poisson curve with rate = median count rate of data. |
 |
 |
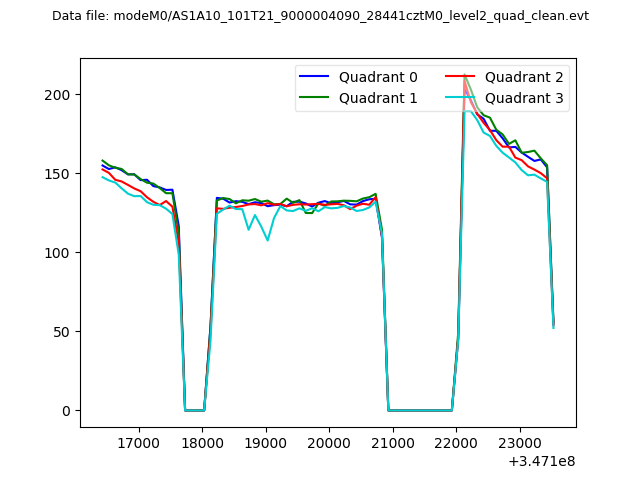
| Quadrant-wise count rates Data is divided into 100 sec bins |
 |
|
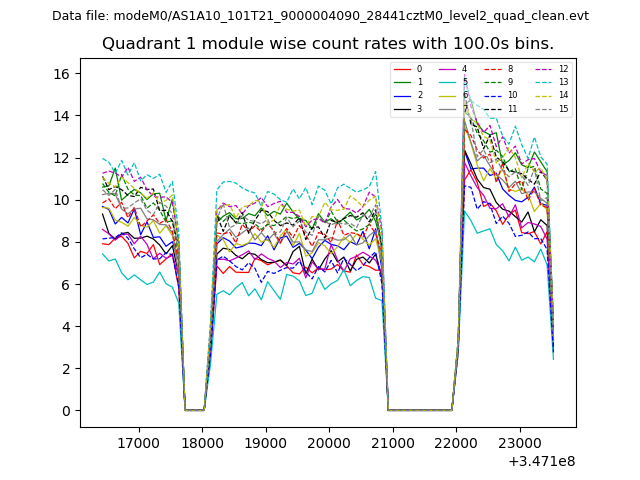
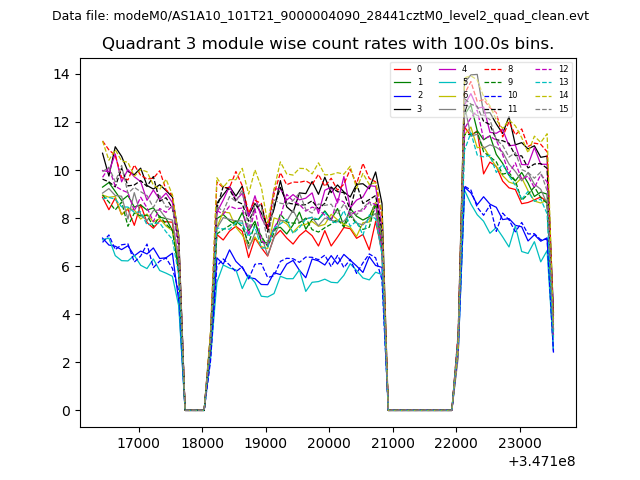
| Module-wise count rates for Quadrant A Data is divided into 100 sec bins |
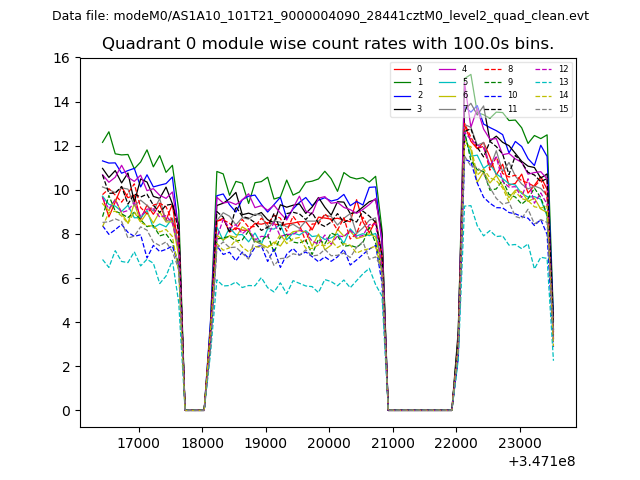 |
 |
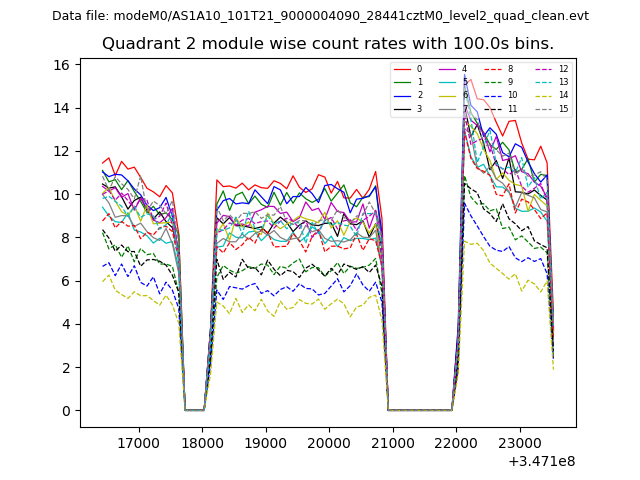
| Module-wise count rates for Quadrant B Data is divided into 100 sec bins |
 |
 |
| Module-wise count rates for Quadrant C Data is divided into 100 sec bins |
 |
 |
| Module-wise count rates for Quadrant D Data is divided into 100 sec bins |
 |
 |
| Parameter | Plot |
|---|---|
| CZT HV Monitor | 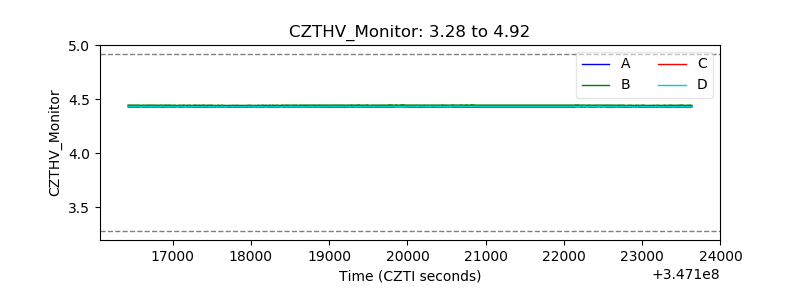 |
| D_VDD | 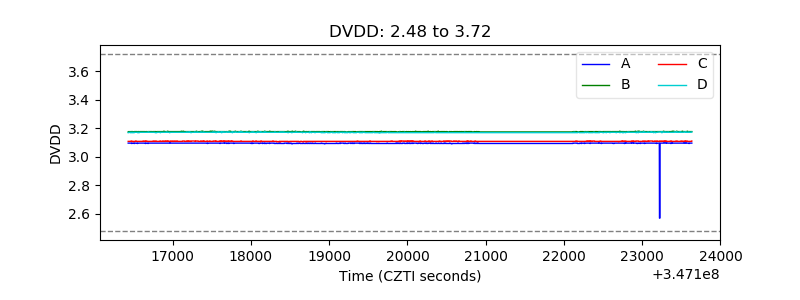 |
| Temperature 1 | 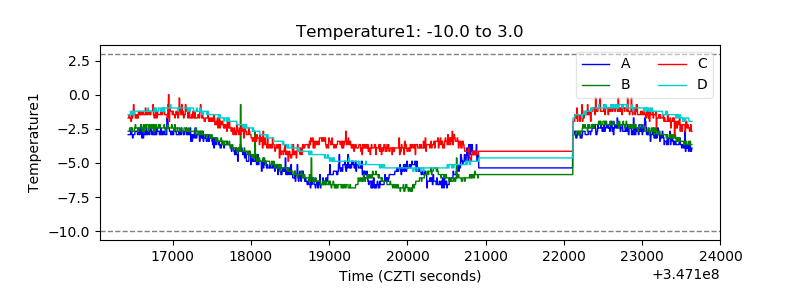 |
| Veto HV Monitor | 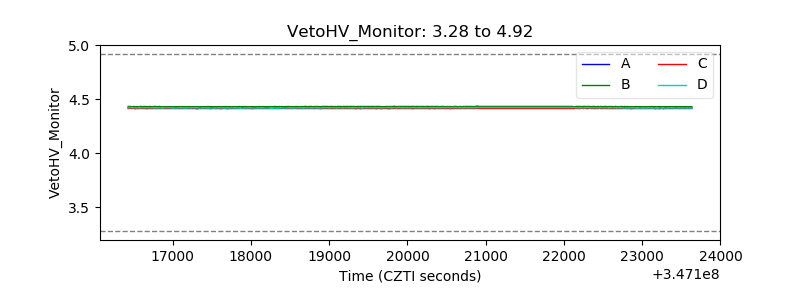 |
| Veto LLD | 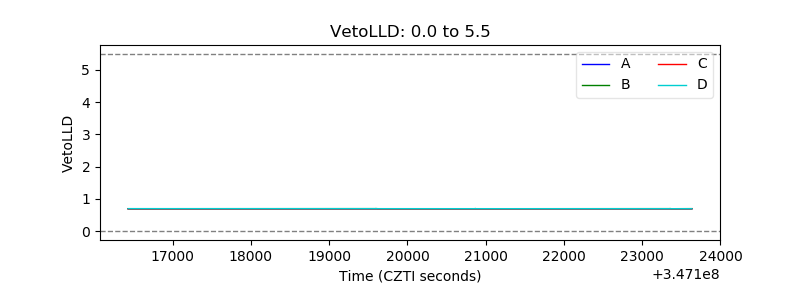 |
| Alpha Counter | 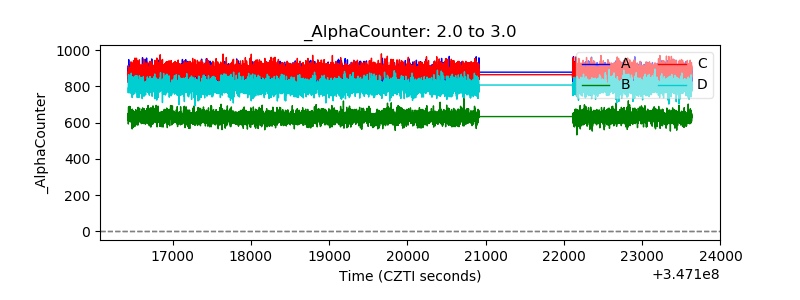 |
| _CPM_Rate | 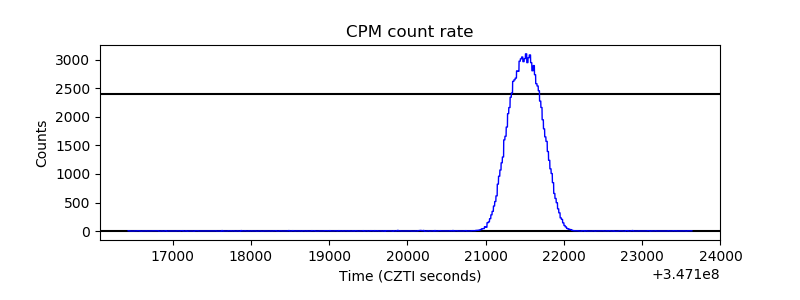 |
| CZT Counter | 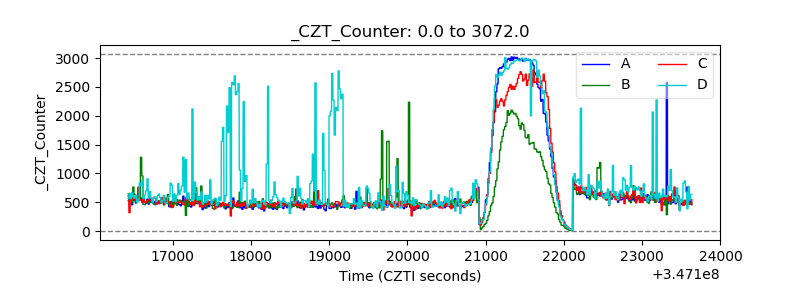 |
| +2.5 Volts monitor |  |
| +5 Volts monitor |  |
| _ROLL_ROT | 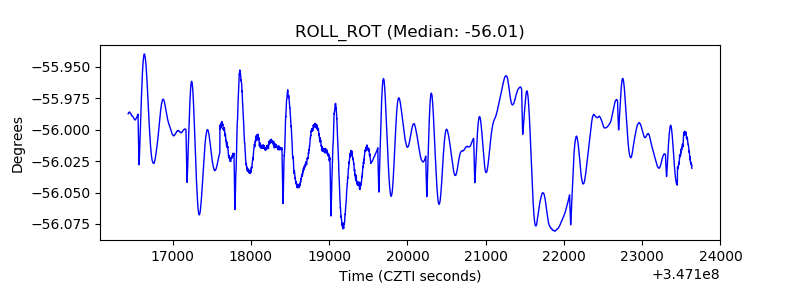 |
| _Roll_DEC | 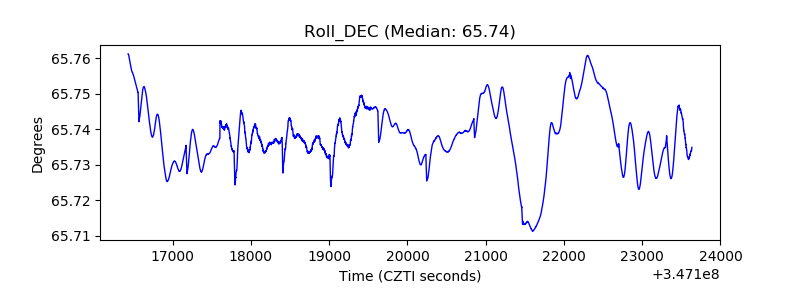 |
| _Roll_RA | 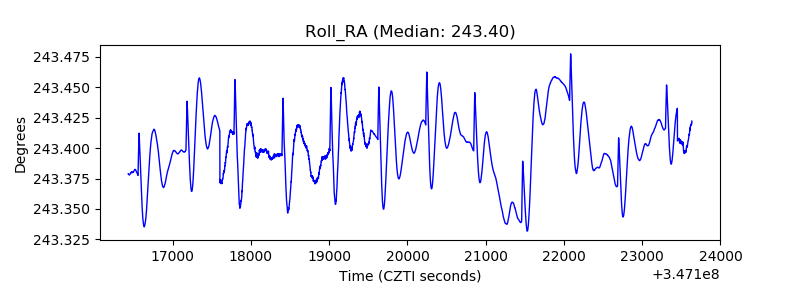 |
| Veto Counter | 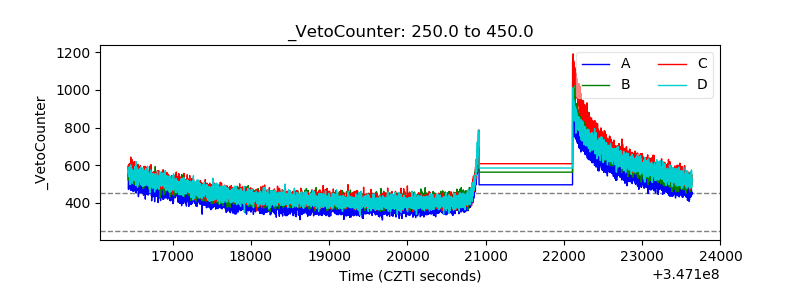 |