| Param | Original file | Final file |
|---|---|---|
| Filename | modeM0/AS1A10_101T21_9000004090_28442cztM0_level2.evt | modeM0/AS1A10_101T21_9000004090_28442cztM0_level2_quad_clean.evt |
| Size (bytes) | 536,428,800 | 118,661,760 |
| Size | 511.6 MB | 113.2 MB |
| Events in quadrant A | 3,165,326 | 806,967 |
| Events in quadrant B | 3,225,490 | 821,365 |
| Events in quadrant C | 3,225,569 | 797,295 |
| Events in quadrant D | 6,216,966 | 743,177 |
| Mode M0 | |||
|---|---|---|---|
| Quadrant | BADHDUFLAG | Total packets | Discarded packets |
| A | 0 | 13340 | 0 |
| B | 0 | 13525 | 0 |
| C | 0 | 13498 | 0 |
| D | 0 | 22718 | 0 |
| Mode M9 | |||
|---|---|---|---|
| Quadrant | BADHDUFLAG | Total packets | Discarded packets |
| A | 0 | 13 | 0 |
| B | 0 | 13 | 0 |
| C | 0 | 13 | 0 |
| D | 0 | 13 | 0 |
| Quadrant | Total seconds | Saturated seconds | Saturation percentage |
|---|---|---|---|
| A | 6084 | 65 | 1.068376% |
| B | 6085 | 69 | 1.133936% |
| C | 6085 | 100 | 1.643385% |
| D | 6085 | 761 | 12.506163% |
Noise dominated data is calculated using 1-second bins in cleaned event files. If a bin has >2000 counts, and if more than 50% of those come from <1% of pixels, then it is considered to be noise-dominated and hence unusable.
| Quadrant | # 1 sec bins | Bins with >0 counts | Bins with >2000 counts | High rate bins dominated by noise | Noise dominated (total time) | Noise dominated (detector-on time) | Marked lightcurve |
|---|---|---|---|---|---|---|---|
| A | 7384 | 6084 | 14 | 14 | 0.19% | 0.23% | 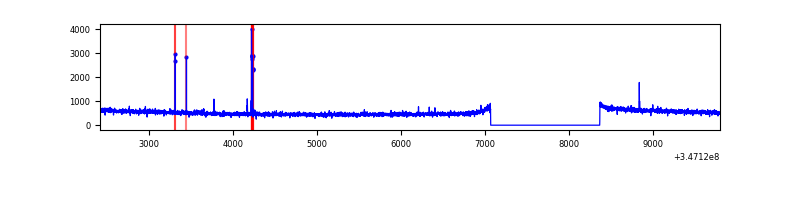 |
| B | 7385 | 6085 | 4 | 4 | 0.05% | 0.07% | 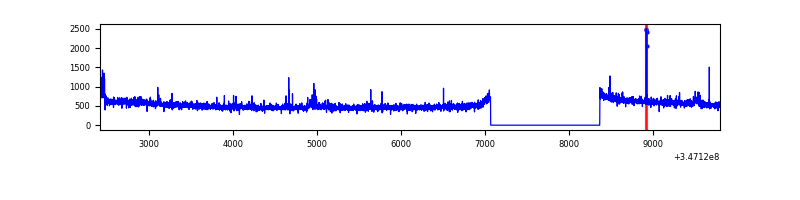 |
| C | 7385 | 6085 | 0 | 0 | 0.00% | 0.00% | 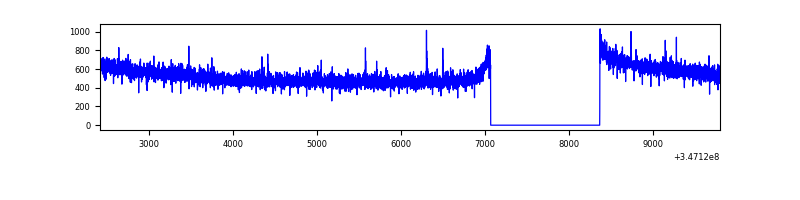 |
| D | 7385 | 6085 | 1031 | 1031 | 13.96% | 16.94% | 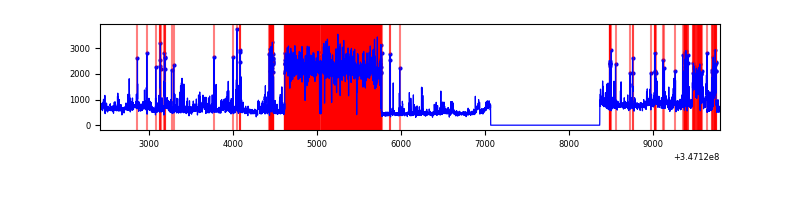 |
Top three noisy pixels from each quadrant. If the there are fewer than three noisy pixels in the level2.evt file, extra rows are filled as -1
| Pixel properties | Quadrant properties | ||||||
|---|---|---|---|---|---|---|---|
| Quadrant | DetID | PixID | Counts | Sigma | Mean | Median | Sigma |
| A | 15 | 169 | 58262 | 360.14 | 805 | 791 | 159.6 |
| A | 13 | 254 | 10382 | 60.1 | 805 | 791 | 159.6 |
| A | 3 | 137 | 7085 | 39.44 | 805 | 791 | 159.6 |
| B | 0 | 190 | 35087 | 232.31 | 797 | 779 | 147.7 |
| B | 0 | 183 | 25677 | 168.59 | 797 | 779 | 147.7 |
| B | 10 | 245 | 24366 | 159.72 | 797 | 779 | 147.7 |
| C | 14 | 238 | 127528 | 694.95 | 790 | 796 | 182.4 |
| C | 3 | 233 | 11423 | 58.27 | 790 | 796 | 182.4 |
| C | 7 | 220 | 9097 | 45.52 | 790 | 796 | 182.4 |
| D | 8 | 195 | 2045801 | 11178.17 | 778 | 758 | 182.9 |
| D | 1 | 52 | 1025102 | 5599.04 | 778 | 758 | 182.9 |
| D | 2 | 250 | 174054 | 947.23 | 778 | 758 | 182.9 |
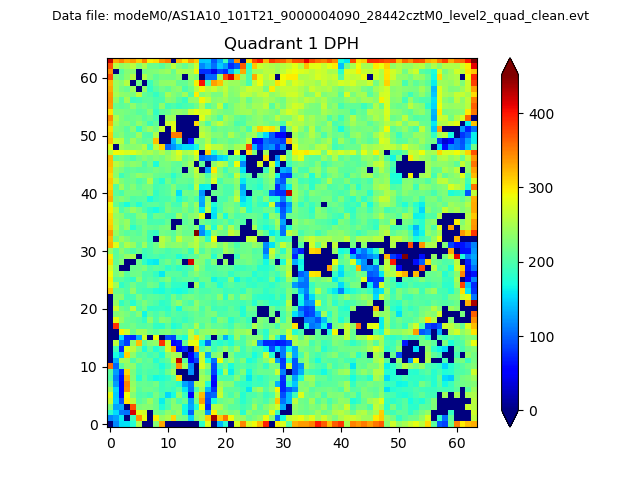
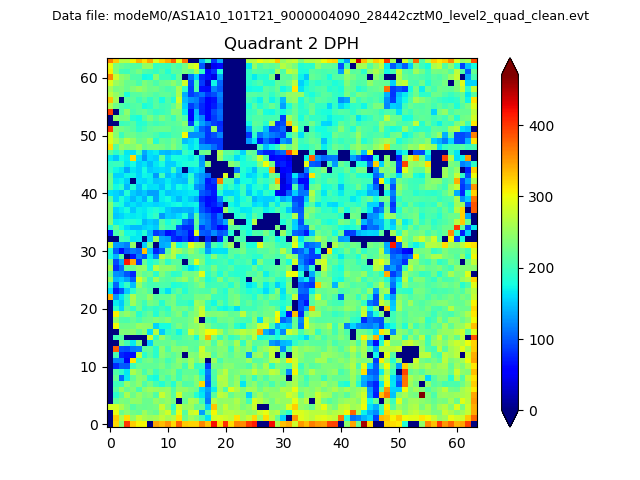
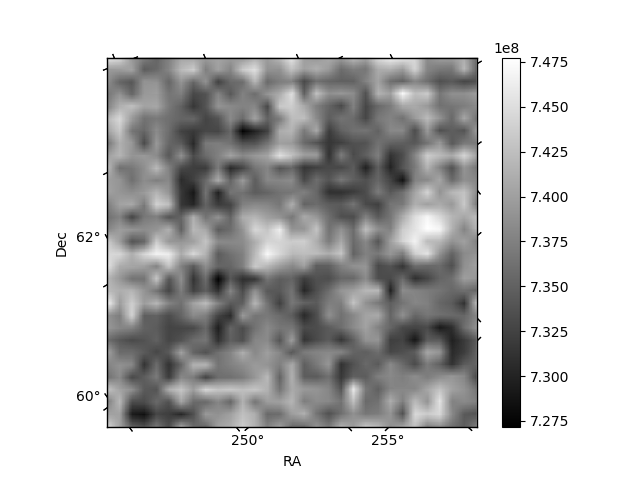
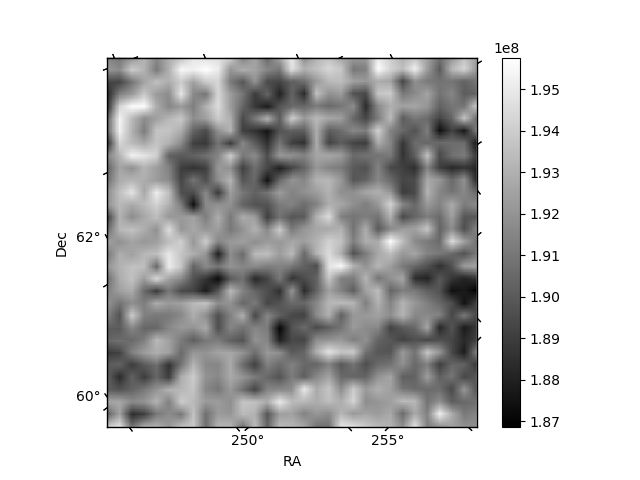
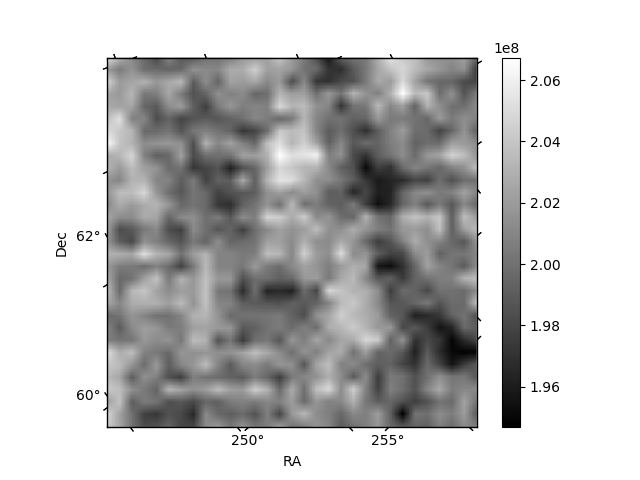
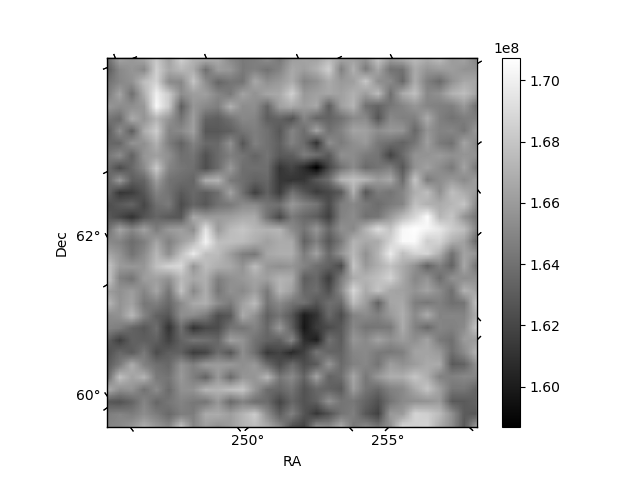
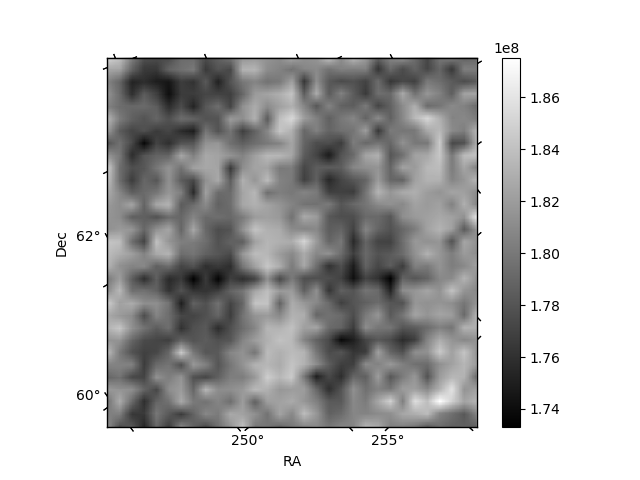
Histogram calculated using DETX and DETY for each event in the final _common_clean file
| Quadrant A |  |
 |
Quadrant B |
|---|---|---|---|
| Quadrant D | 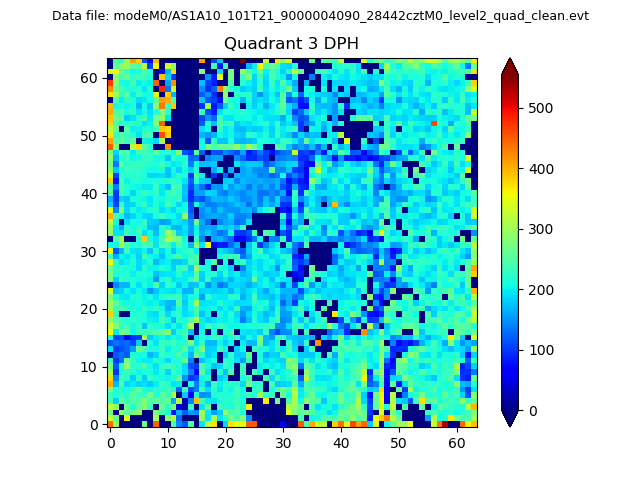 |
 |
Quadrant C |
| Plot type | Count rate plots | Images |
|---|---|---|
| Comparison with Poisson distribution Blue bars denote a histogram of data divided into 1 sec bins. Red curve is a Poisson curve with rate = median count rate of data. |
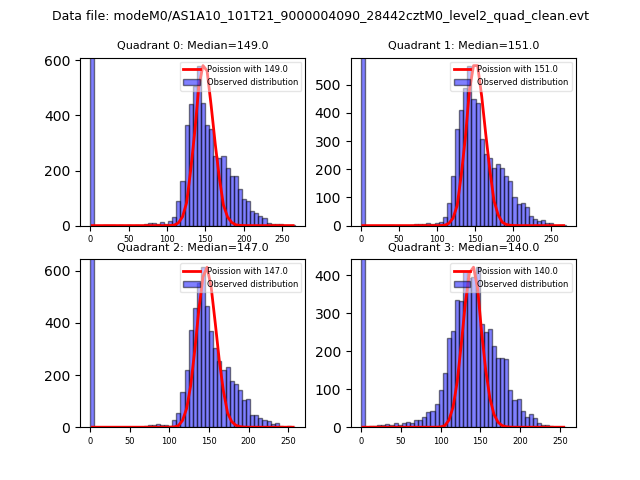 |
 |
| Quadrant-wise count rates Data is divided into 100 sec bins |
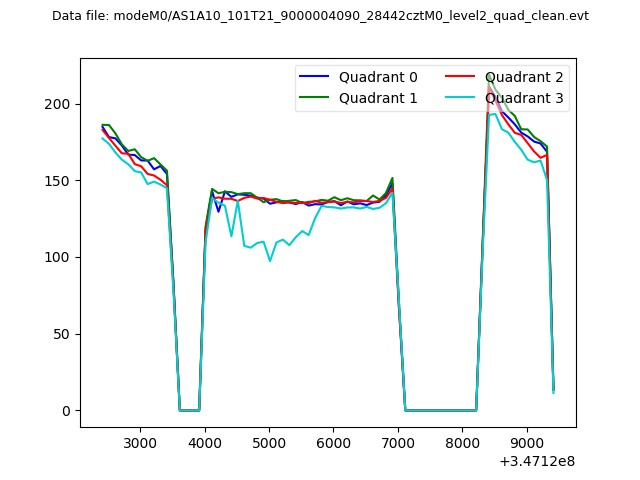 |
|
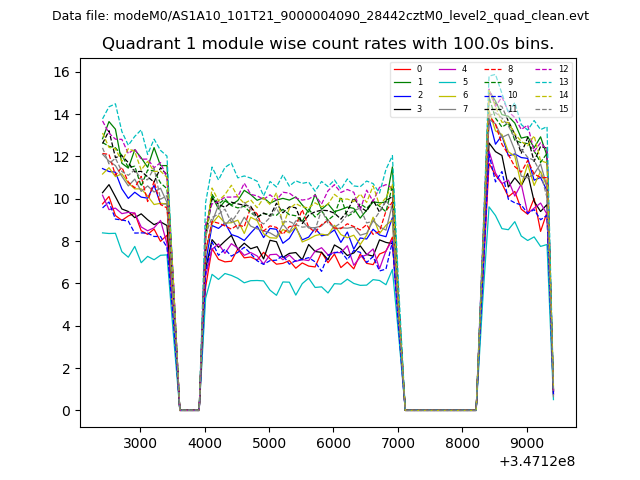
| Module-wise count rates for Quadrant A Data is divided into 100 sec bins |
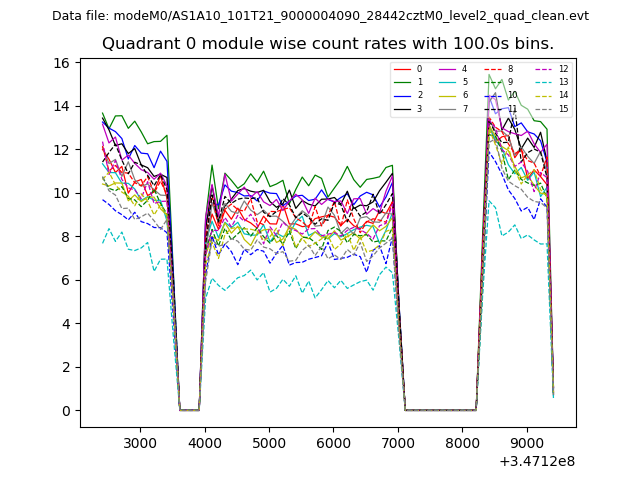 |
 |
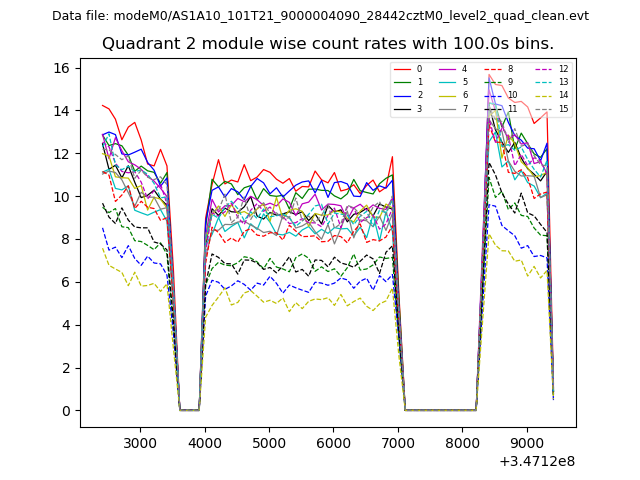
| Module-wise count rates for Quadrant B Data is divided into 100 sec bins |
 |
 |
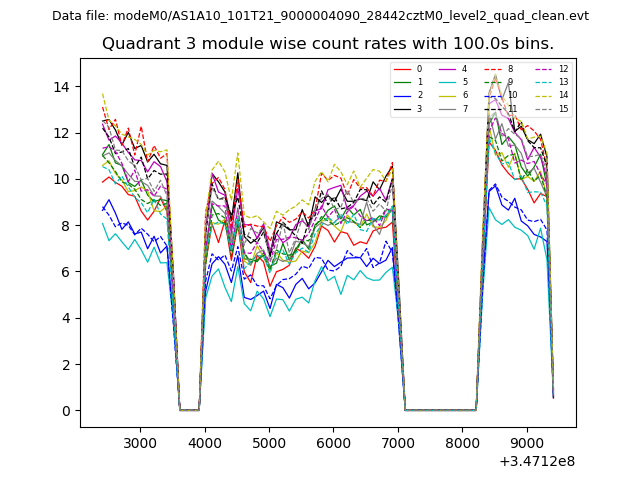
| Module-wise count rates for Quadrant C Data is divided into 100 sec bins |
 |
 |
| Module-wise count rates for Quadrant D Data is divided into 100 sec bins |
 |
 |
| Parameter | Plot |
|---|---|
| CZT HV Monitor | 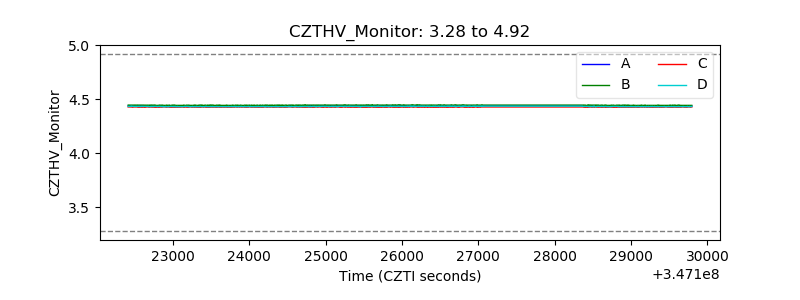 |
| D_VDD | 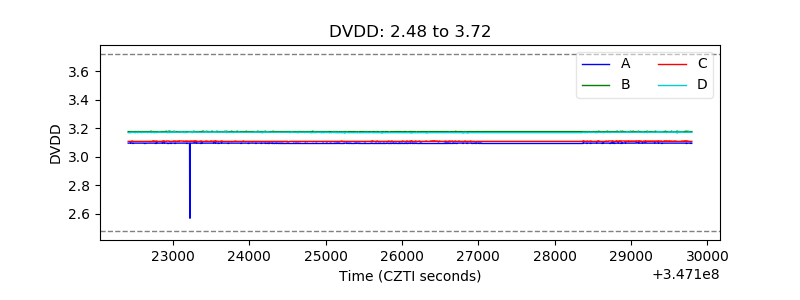 |
| Temperature 1 | 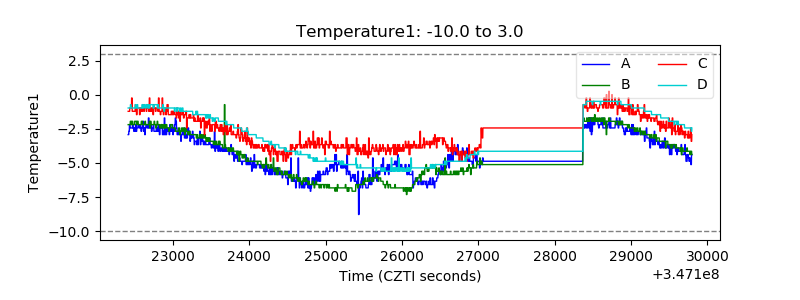 |
| Veto HV Monitor | 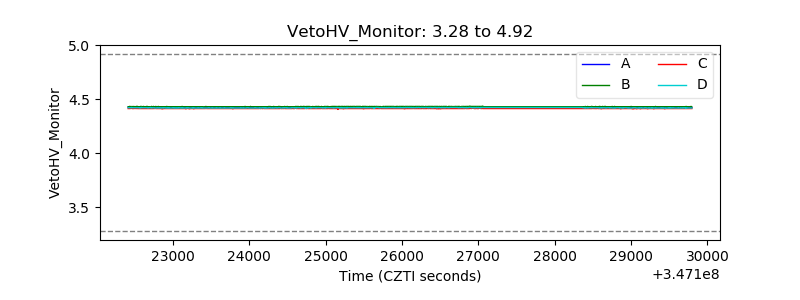 |
| Veto LLD | 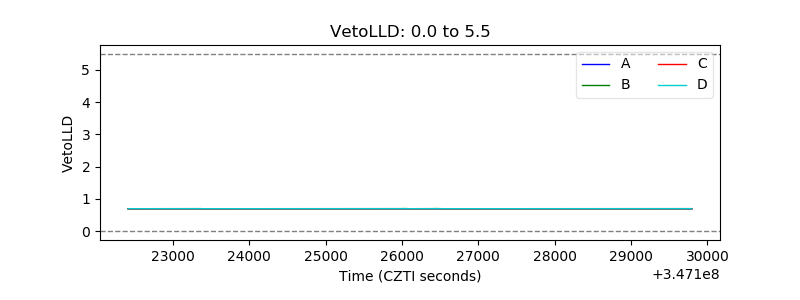 |
| Alpha Counter |  |
| _CPM_Rate |  |
| CZT Counter | 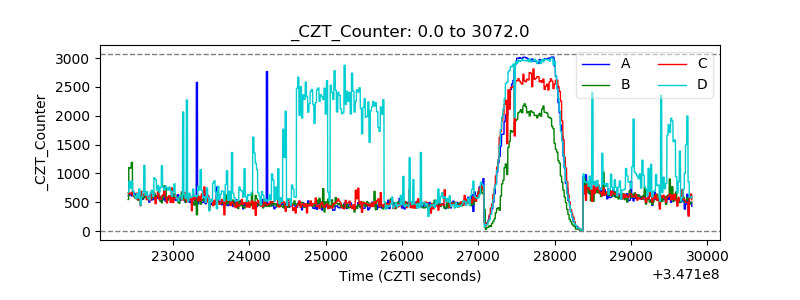 |
| +2.5 Volts monitor |  |
| +5 Volts monitor |  |
| _ROLL_ROT | 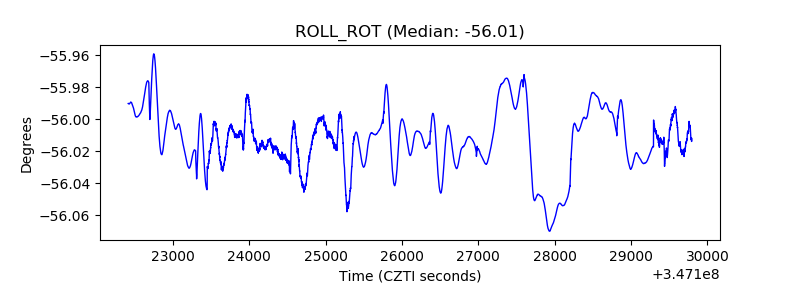 |
| _Roll_DEC | 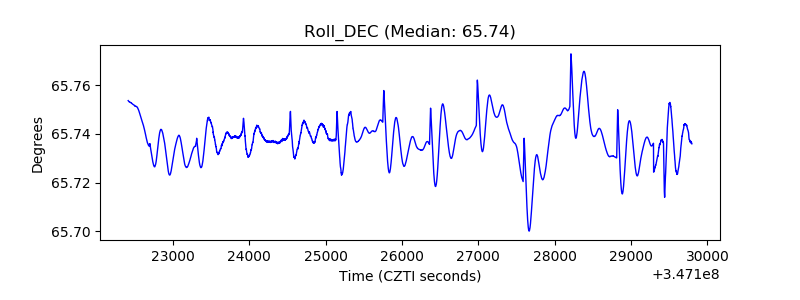 |
| _Roll_RA | 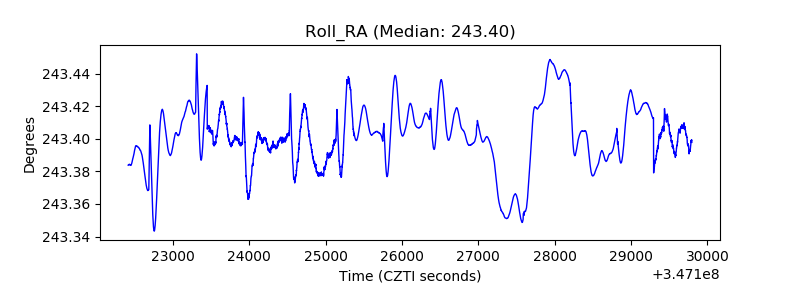 |
| Veto Counter | 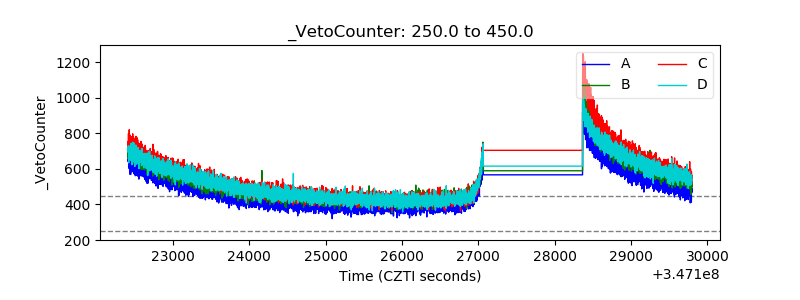 |