| Param | Original file | Final file |
|---|---|---|
| Filename | modeM0/AS1A10_101T21_9000004090_28443cztM0_level2.evt | modeM0/AS1A10_101T21_9000004090_28443cztM0_level2_quad_clean.evt |
| Size (bytes) | 521,786,880 | 122,238,720 |
| Size | 497.6 MB | 116.6 MB |
| Events in quadrant A | 3,223,959 | 826,300 |
| Events in quadrant B | 3,484,698 | 841,685 |
| Events in quadrant C | 3,382,265 | 823,381 |
| Events in quadrant D | 5,295,776 | 782,632 |
| Mode M0 | |||
|---|---|---|---|
| Quadrant | BADHDUFLAG | Total packets | Discarded packets |
| A | 0 | 13601 | 0 |
| B | 0 | 14346 | 0 |
| C | 0 | 14101 | 0 |
| D | 0 | 20048 | 0 |
| Mode M9 | |||
|---|---|---|---|
| Quadrant | BADHDUFLAG | Total packets | Discarded packets |
| A | 0 | 14 | 0 |
| B | 0 | 14 | 0 |
| C | 0 | 14 | 0 |
| D | 0 | 14 | 0 |
| Quadrant | Total seconds | Saturated seconds | Saturation percentage |
|---|---|---|---|
| A | 6130 | 58 | 0.946166% |
| B | 6131 | 101 | 1.647366% |
| C | 6131 | 110 | 1.794161% |
| D | 6131 | 313 | 5.105203% |
Noise dominated data is calculated using 1-second bins in cleaned event files. If a bin has >2000 counts, and if more than 50% of those come from <1% of pixels, then it is considered to be noise-dominated and hence unusable.
| Quadrant | # 1 sec bins | Bins with >0 counts | Bins with >2000 counts | High rate bins dominated by noise | Noise dominated (total time) | Noise dominated (detector-on time) | Marked lightcurve |
|---|---|---|---|---|---|---|---|
| A | 7505 | 6130 | 0 | 0 | 0.00% | 0.00% | 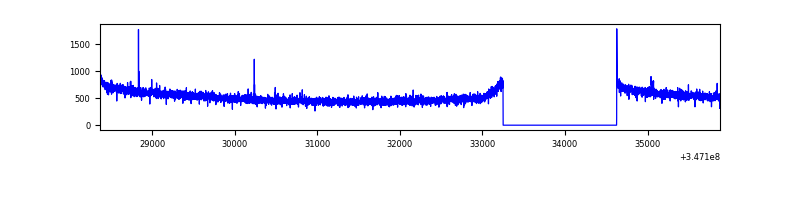 |
| B | 7506 | 6131 | 26 | 26 | 0.35% | 0.42% | 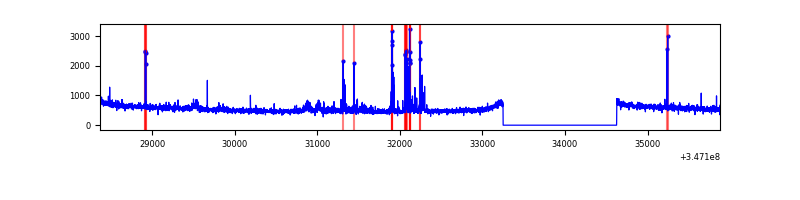 |
| C | 7506 | 6131 | 1 | 1 | 0.01% | 0.02% | 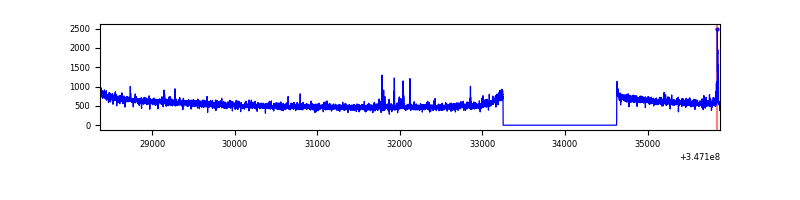 |
| D | 7506 | 6131 | 325 | 325 | 4.33% | 5.30% | 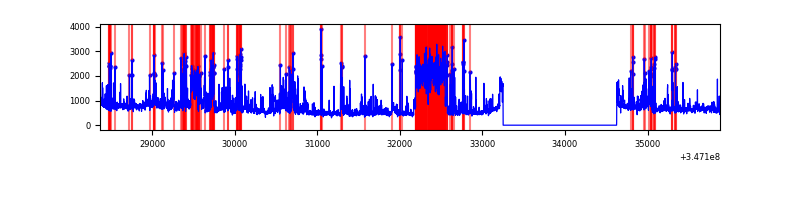 |
Top three noisy pixels from each quadrant. If the there are fewer than three noisy pixels in the level2.evt file, extra rows are filled as -1
| Pixel properties | Quadrant properties | ||||||
|---|---|---|---|---|---|---|---|
| Quadrant | DetID | PixID | Counts | Sigma | Mean | Median | Sigma |
| A | 15 | 169 | 14423 | 83.77 | 830 | 816 | 162.4 |
| A | 13 | 254 | 10079 | 57.03 | 830 | 816 | 162.4 |
| A | 3 | 137 | 7423 | 40.68 | 830 | 816 | 162.4 |
| B | 10 | 245 | 186039 | 1229.62 | 823 | 804 | 150.6 |
| B | 0 | 183 | 40432 | 263.06 | 823 | 804 | 150.6 |
| B | 0 | 230 | 20029 | 127.62 | 823 | 804 | 150.6 |
| C | 14 | 238 | 133934 | 710.92 | 819 | 828 | 187.2 |
| C | 7 | 220 | 51821 | 272.35 | 819 | 828 | 187.2 |
| C | 13 | 61 | 5544 | 25.19 | 819 | 828 | 187.2 |
| D | 1 | 52 | 1205053 | 6342.91 | 810 | 790 | 189.9 |
| D | 8 | 195 | 844166 | 4442.1 | 810 | 790 | 189.9 |
| D | 2 | 250 | 113400 | 593.12 | 810 | 790 | 189.9 |
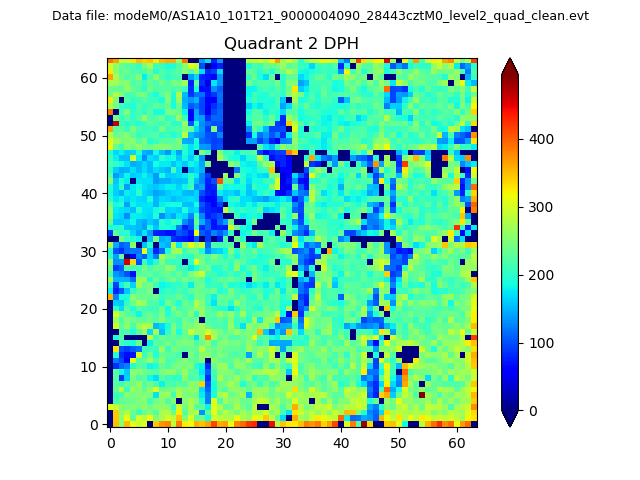
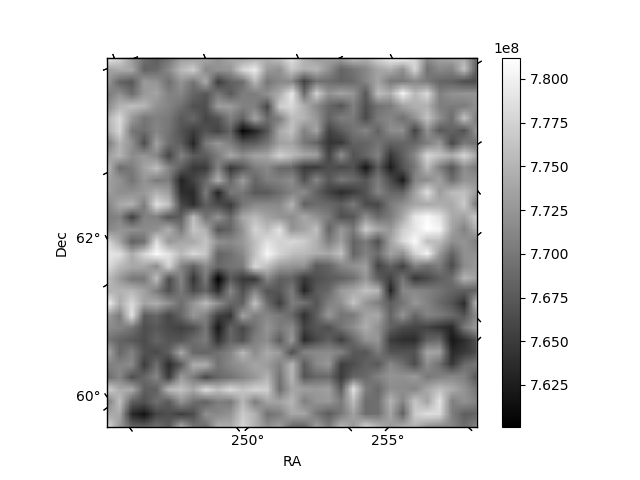
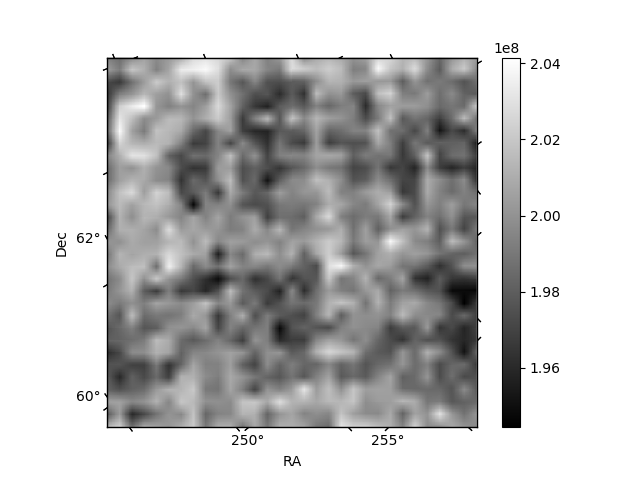
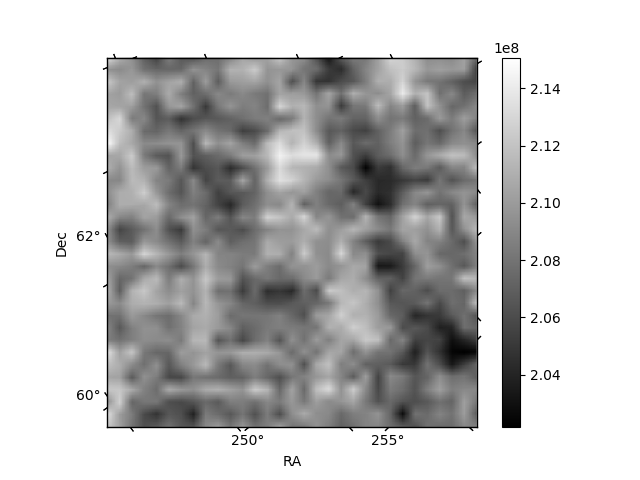
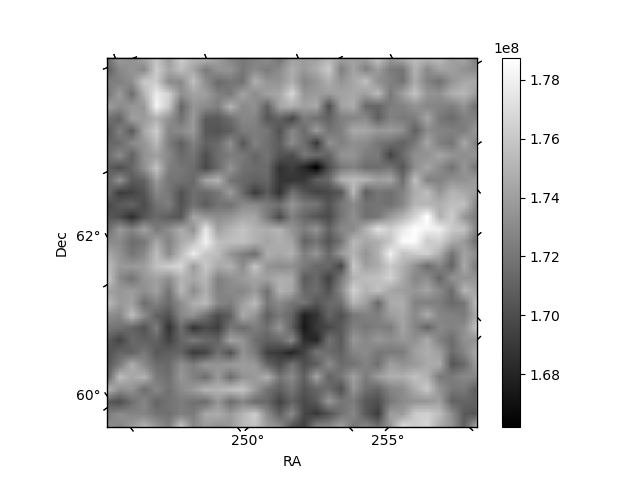
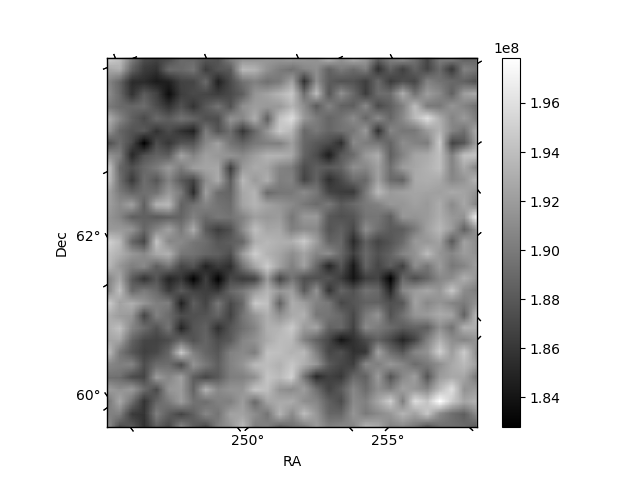
Histogram calculated using DETX and DETY for each event in the final _common_clean file
| Quadrant A | 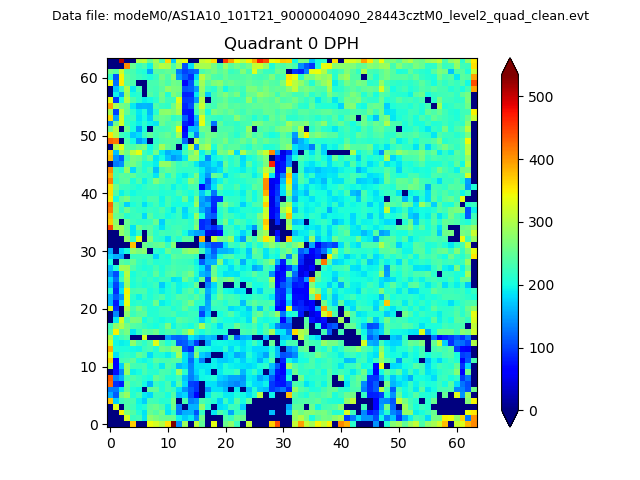 |
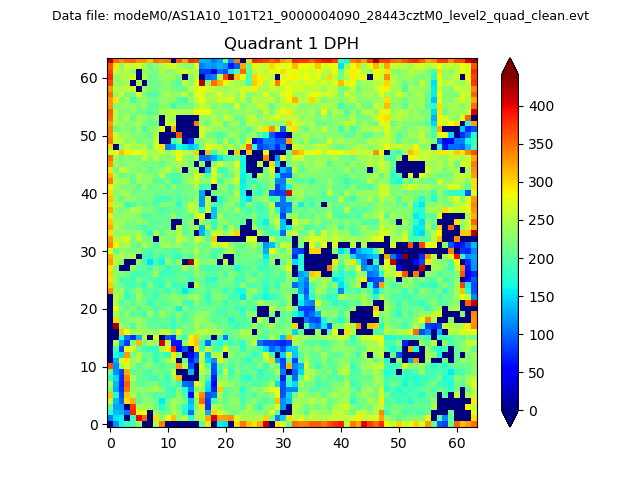 |
Quadrant B |
|---|---|---|---|
| Quadrant D | 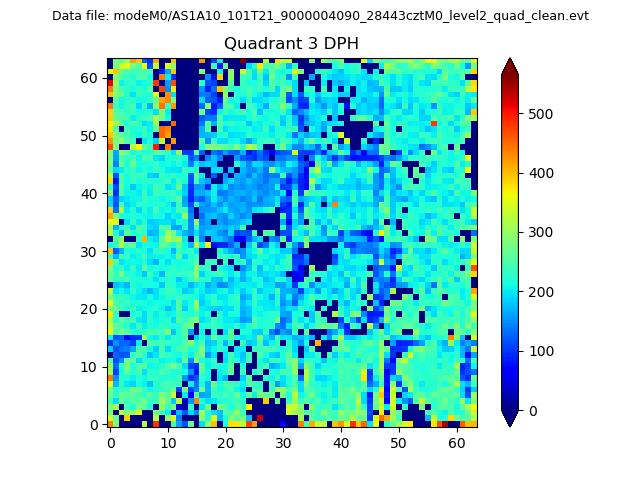 |
 |
Quadrant C |
| Plot type | Count rate plots | Images |
|---|---|---|
| Comparison with Poisson distribution Blue bars denote a histogram of data divided into 1 sec bins. Red curve is a Poisson curve with rate = median count rate of data. |
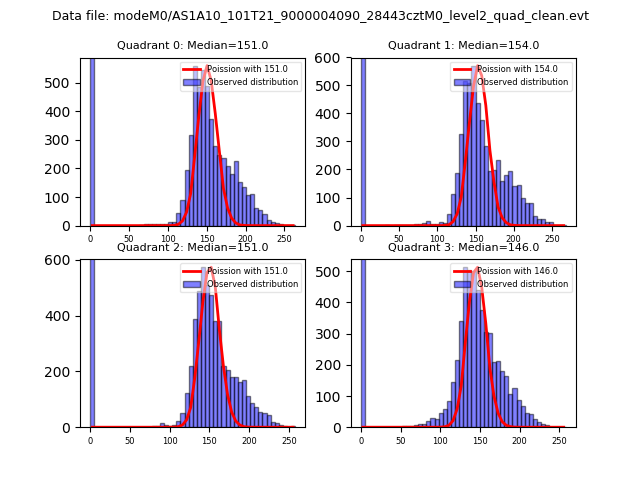 |
 |
| Quadrant-wise count rates Data is divided into 100 sec bins |
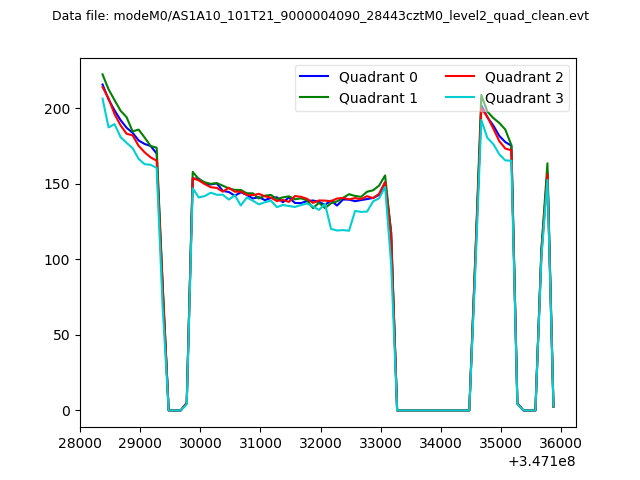 |
|
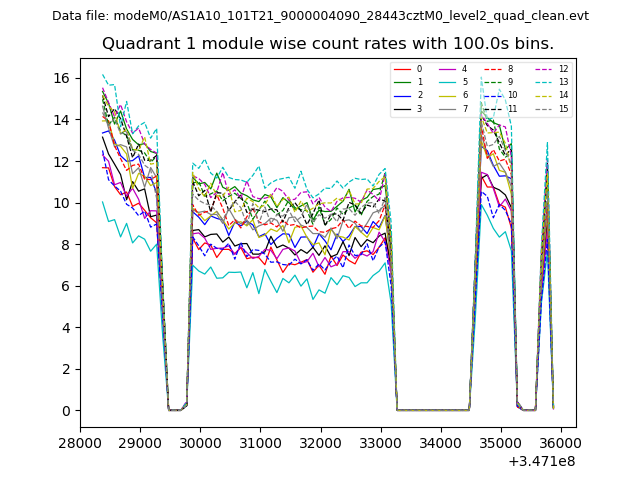
| Module-wise count rates for Quadrant A Data is divided into 100 sec bins |
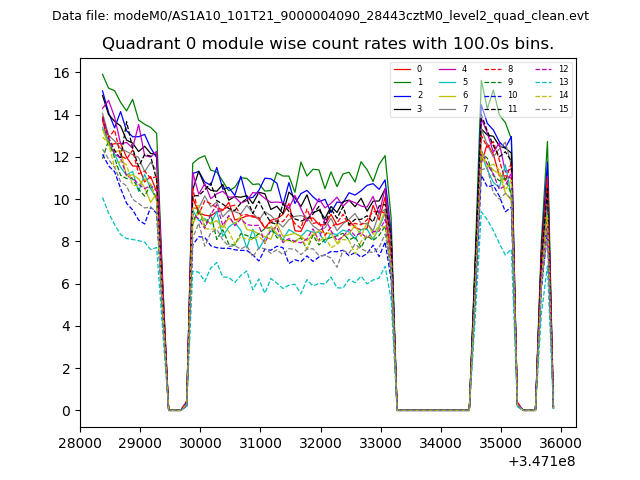 |
 |
| Module-wise count rates for Quadrant B Data is divided into 100 sec bins |
 |
 |
| Module-wise count rates for Quadrant C Data is divided into 100 sec bins |
 |
 |
| Module-wise count rates for Quadrant D Data is divided into 100 sec bins |
 |
 |
| Parameter | Plot |
|---|---|
| CZT HV Monitor |  |
| D_VDD | 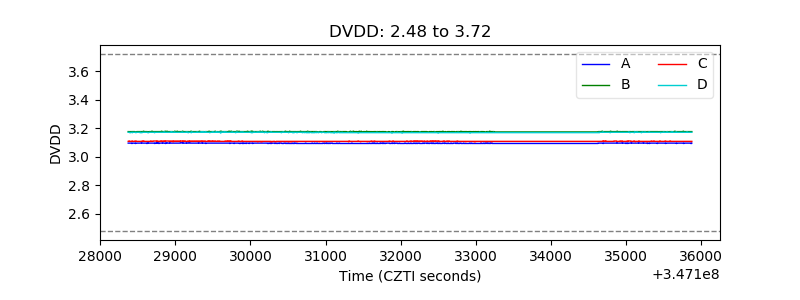 |
| Temperature 1 | 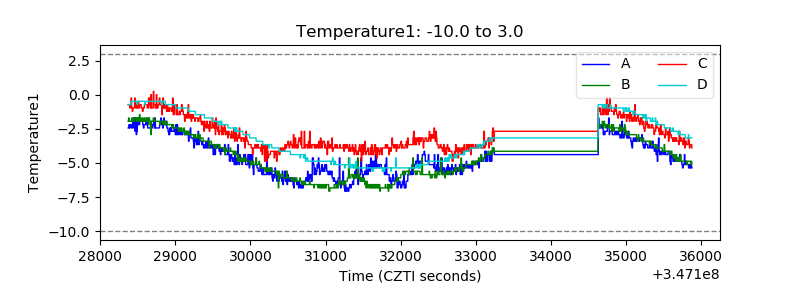 |
| Veto HV Monitor | 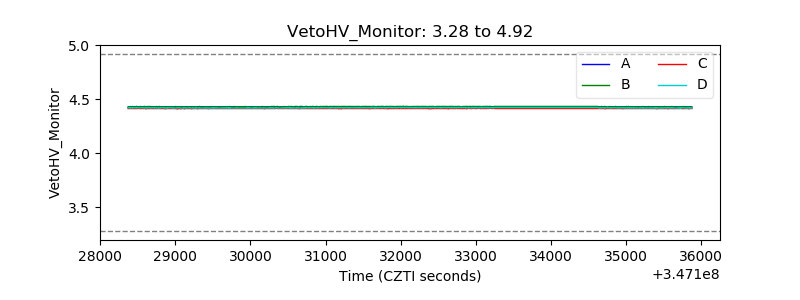 |
| Veto LLD | 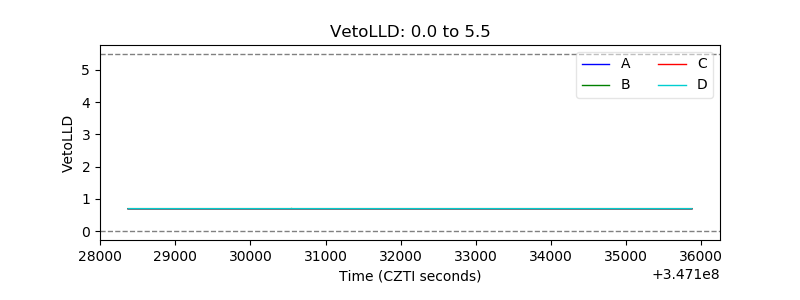 |
| Alpha Counter | 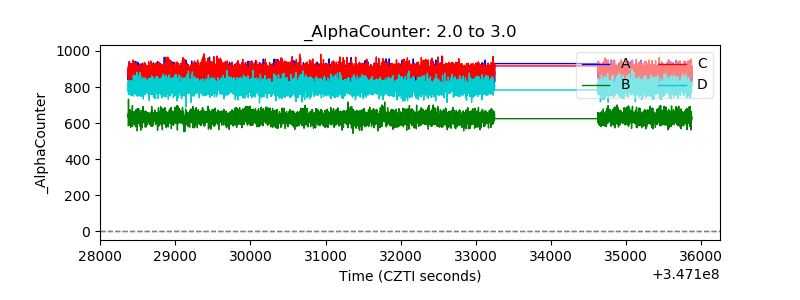 |
| _CPM_Rate | 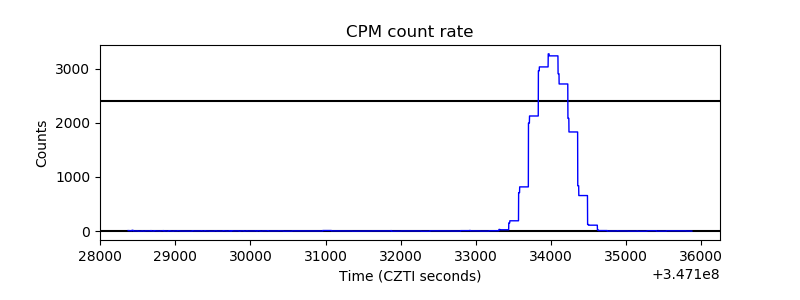 |
| CZT Counter | 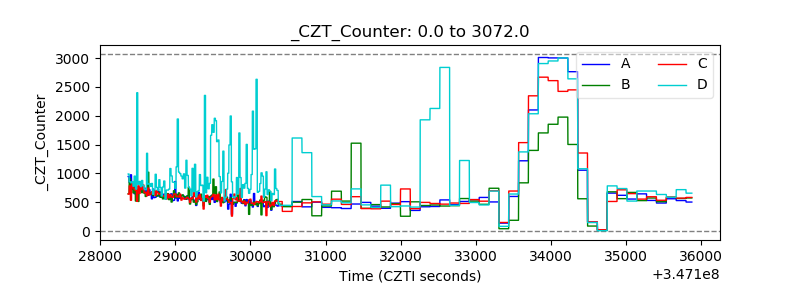 |
| +2.5 Volts monitor |  |
| +5 Volts monitor |  |
| _ROLL_ROT | 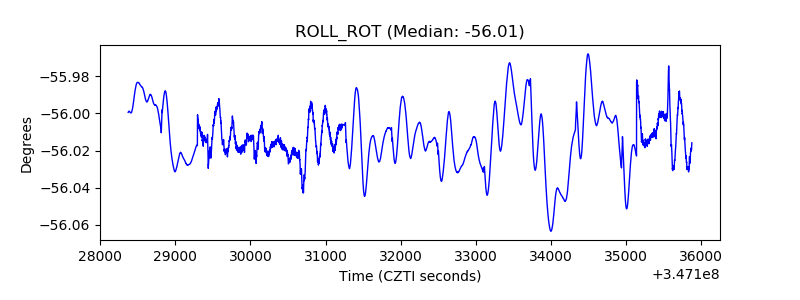 |
| _Roll_DEC | 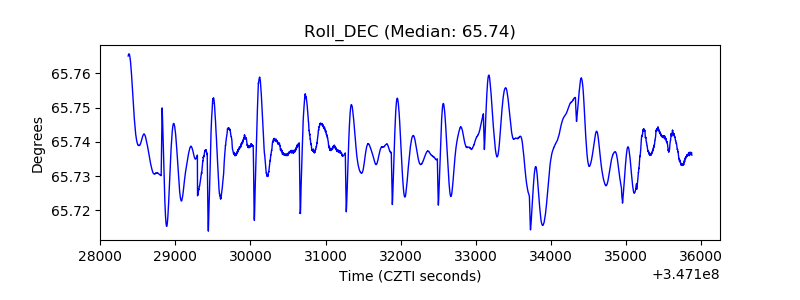 |
| _Roll_RA | 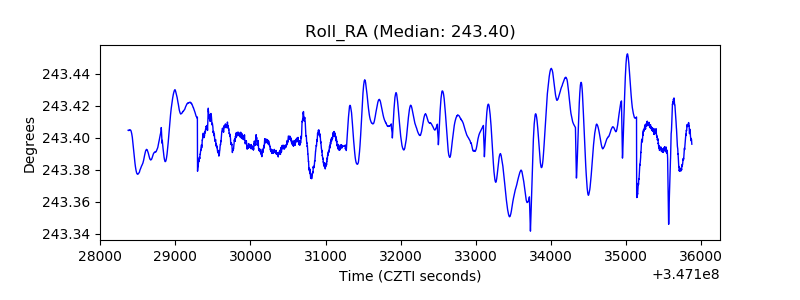 |
| Veto Counter |  |