| Param | Original file | Final file |
|---|---|---|
| Filename | modeM0/AS1A10_101T21_9000004090_28444cztM0_level2.evt | modeM0/AS1A10_101T21_9000004090_28444cztM0_level2_quad_clean.evt |
| Size (bytes) | 488,698,560 | 118,235,520 |
| Size | 466.1 MB | 112.8 MB |
| Events in quadrant A | 3,118,997 | 792,939 |
| Events in quadrant B | 3,212,915 | 813,208 |
| Events in quadrant C | 3,914,498 | 785,935 |
| Events in quadrant D | 4,140,267 | 763,117 |
| Mode M0 | |||
|---|---|---|---|
| Quadrant | BADHDUFLAG | Total packets | Discarded packets |
| A | 0 | 13188 | 0 |
| B | 0 | 13446 | 0 |
| C | 0 | 15895 | 0 |
| D | 0 | 16570 | 0 |
| Mode M9 | |||
|---|---|---|---|
| Quadrant | BADHDUFLAG | Total packets | Discarded packets |
| A | 0 | 17 | 0 |
| B | 0 | 18 | 0 |
| C | 0 | 18 | 0 |
| D | 0 | 18 | 0 |
| Quadrant | Total seconds | Saturated seconds | Saturation percentage |
|---|---|---|---|
| A | 6104 | 85 | 1.392529% |
| B | 6103 | 95 | 1.556612% |
| C | 6103 | 241 | 3.948878% |
| D | 6103 | 182 | 2.982140% |
Noise dominated data is calculated using 1-second bins in cleaned event files. If a bin has >2000 counts, and if more than 50% of those come from <1% of pixels, then it is considered to be noise-dominated and hence unusable.
| Quadrant | # 1 sec bins | Bins with >0 counts | Bins with >2000 counts | High rate bins dominated by noise | Noise dominated (total time) | Noise dominated (detector-on time) | Marked lightcurve |
|---|---|---|---|---|---|---|---|
| A | 7449 | 6104 | 0 | 0 | 0.00% | 0.00% | 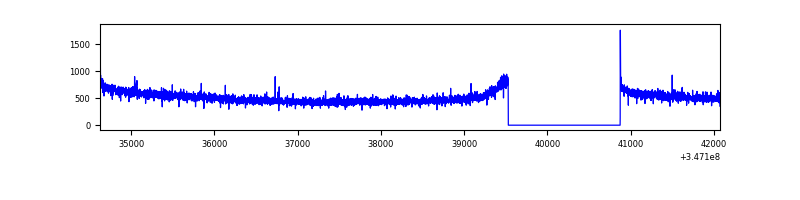 |
| B | 7448 | 6103 | 3 | 3 | 0.04% | 0.05% | 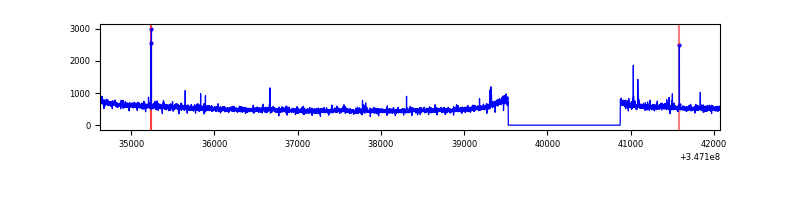 |
| C | 7448 | 6103 | 78 | 78 | 1.05% | 1.28% | 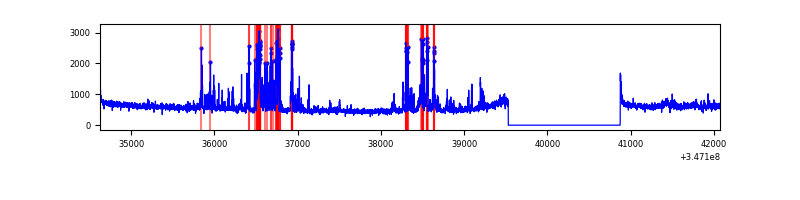 |
| D | 7448 | 6103 | 127 | 127 | 1.71% | 2.08% | 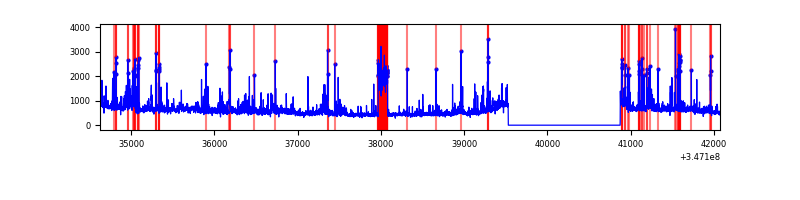 |
Top three noisy pixels from each quadrant. If the there are fewer than three noisy pixels in the level2.evt file, extra rows are filled as -1
| Pixel properties | Quadrant properties | ||||||
|---|---|---|---|---|---|---|---|
| Quadrant | DetID | PixID | Counts | Sigma | Mean | Median | Sigma |
| A | 13 | 254 | 9839 | 56.8 | 805 | 790 | 159.3 |
| A | 8 | 192 | 8405 | 47.8 | 805 | 790 | 159.3 |
| A | 3 | 137 | 7377 | 41.35 | 805 | 790 | 159.3 |
| B | 0 | 230 | 28627 | 187.91 | 802 | 783 | 148.2 |
| B | 12 | 111 | 17339 | 111.73 | 802 | 783 | 148.2 |
| B | 11 | 111 | 15908 | 102.07 | 802 | 783 | 148.2 |
| C | 7 | 220 | 660849 | 3633.84 | 790 | 797 | 181.6 |
| C | 14 | 238 | 129092 | 706.31 | 790 | 797 | 181.6 |
| C | 3 | 233 | 32686 | 175.56 | 790 | 797 | 181.6 |
| D | 1 | 52 | 577718 | 3071.35 | 792 | 772 | 187.8 |
| D | 8 | 195 | 412200 | 2190.22 | 792 | 772 | 187.8 |
| D | 2 | 250 | 98656 | 521.08 | 792 | 772 | 187.8 |
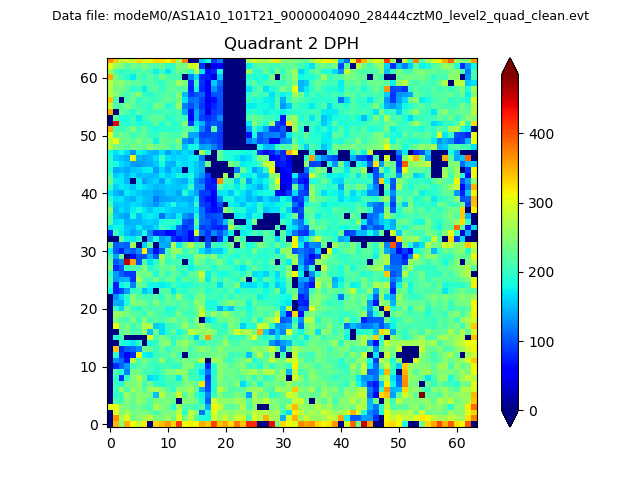
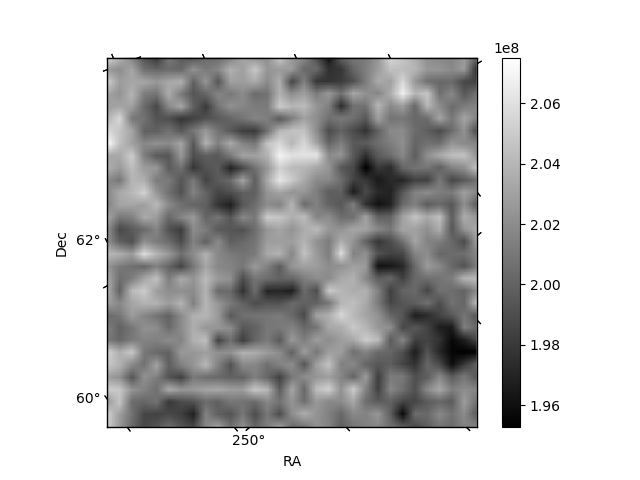
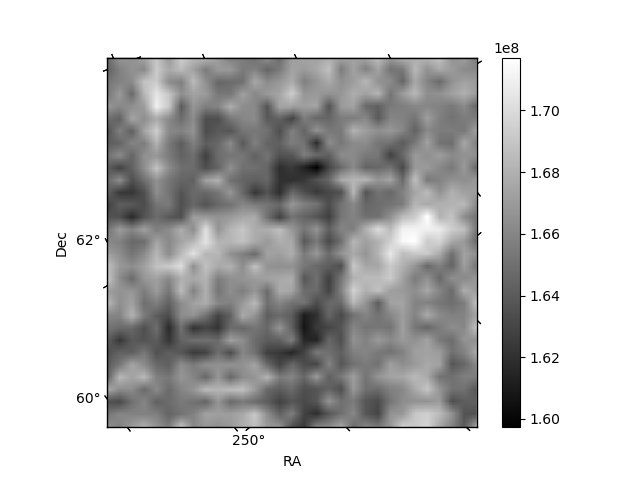
Histogram calculated using DETX and DETY for each event in the final _common_clean file
| Quadrant A | 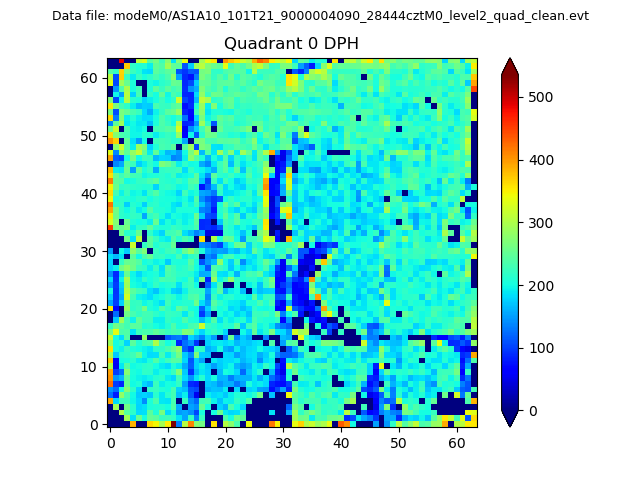 |
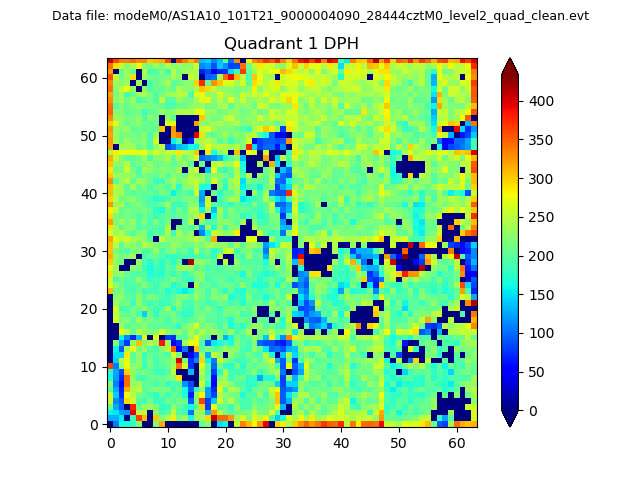 |
Quadrant B |
|---|---|---|---|
| Quadrant D | 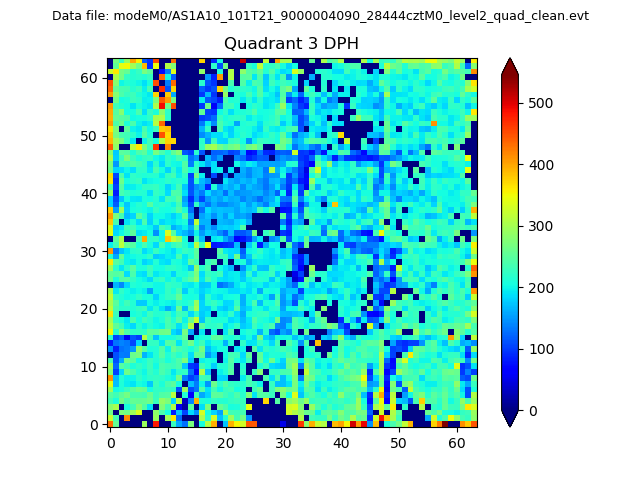 |
 |
Quadrant C |
| Plot type | Count rate plots | Images |
|---|---|---|
| Comparison with Poisson distribution Blue bars denote a histogram of data divided into 1 sec bins. Red curve is a Poisson curve with rate = median count rate of data. |
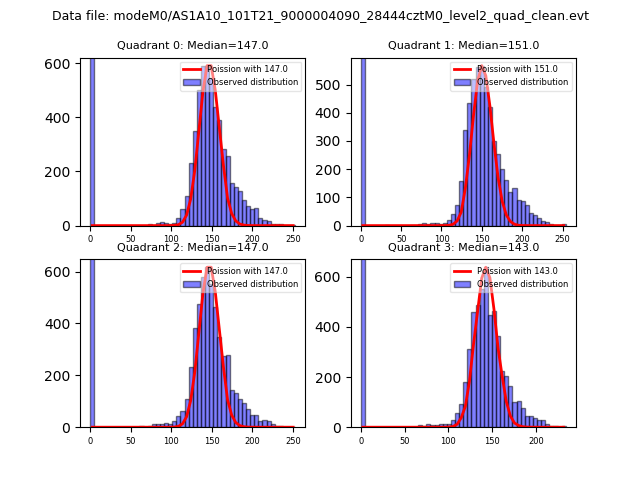 |
 |
| Quadrant-wise count rates Data is divided into 100 sec bins |
 |
|
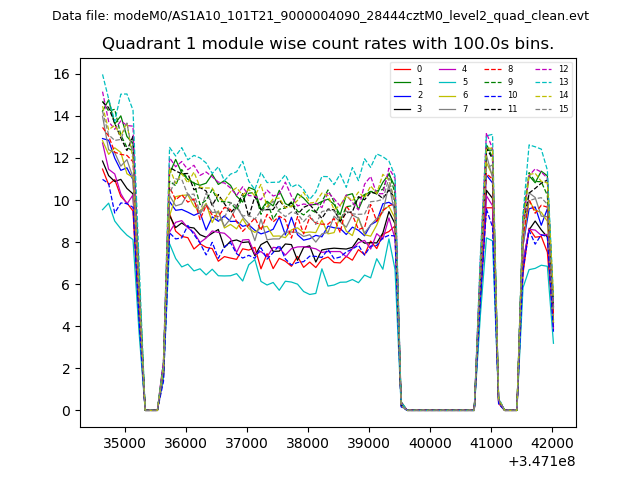
| Module-wise count rates for Quadrant A Data is divided into 100 sec bins |
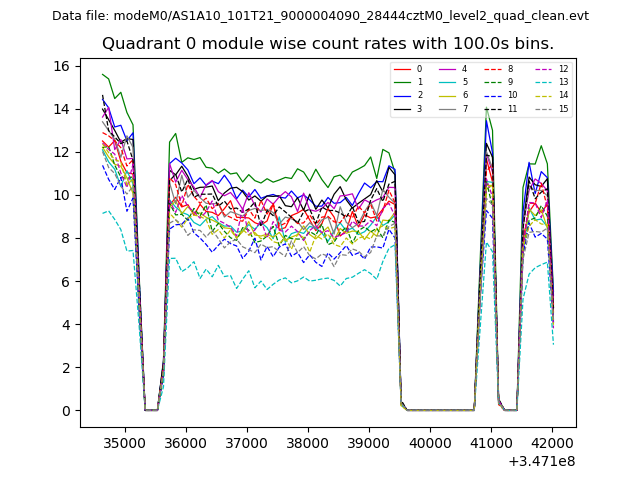 |
 |
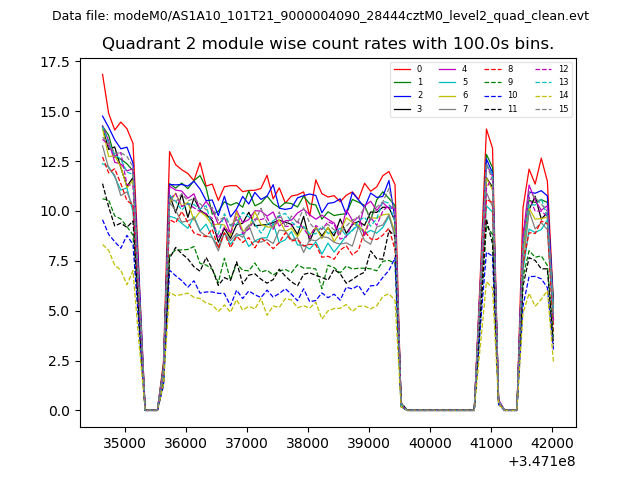
| Module-wise count rates for Quadrant B Data is divided into 100 sec bins |
 |
 |
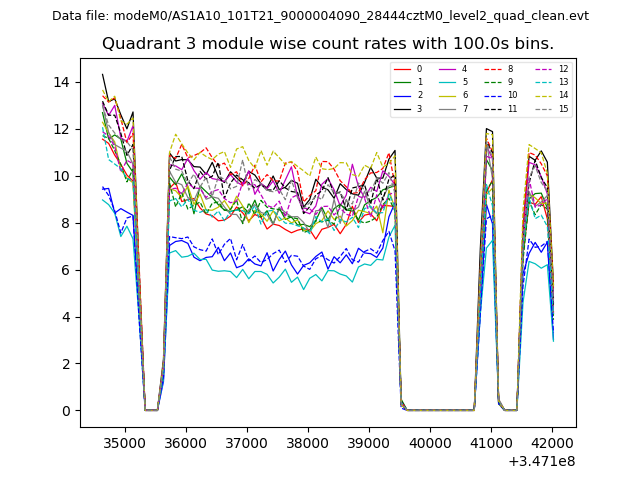
| Module-wise count rates for Quadrant C Data is divided into 100 sec bins |
 |
 |
| Module-wise count rates for Quadrant D Data is divided into 100 sec bins |
 |
 |
| Parameter | Plot |
|---|---|
| CZT HV Monitor |  |
| D_VDD | 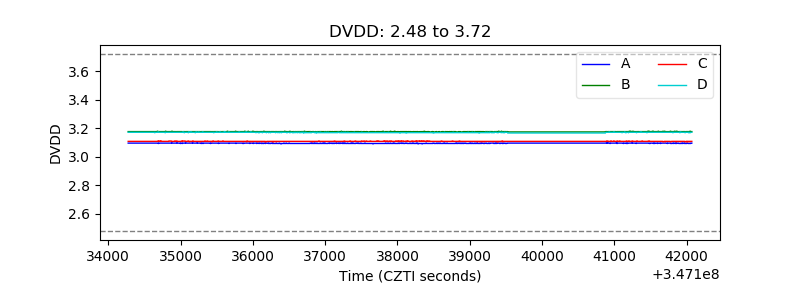 |
| Temperature 1 | 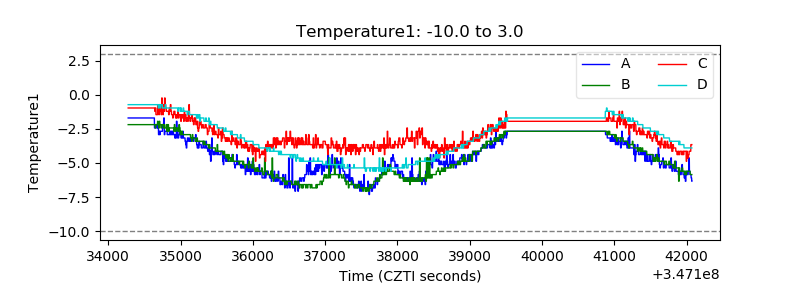 |
| Veto HV Monitor | 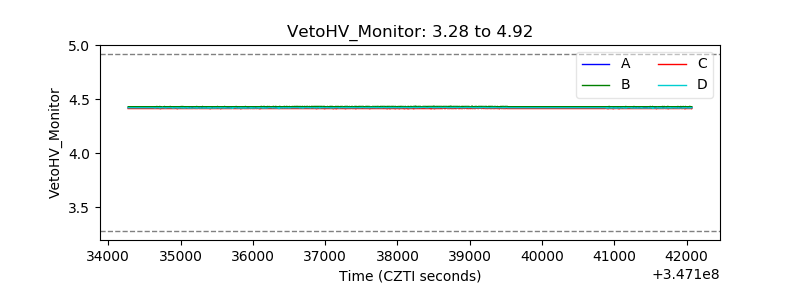 |
| Veto LLD | 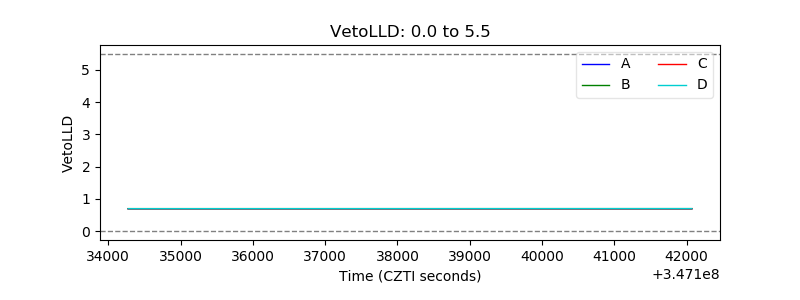 |
| Alpha Counter | 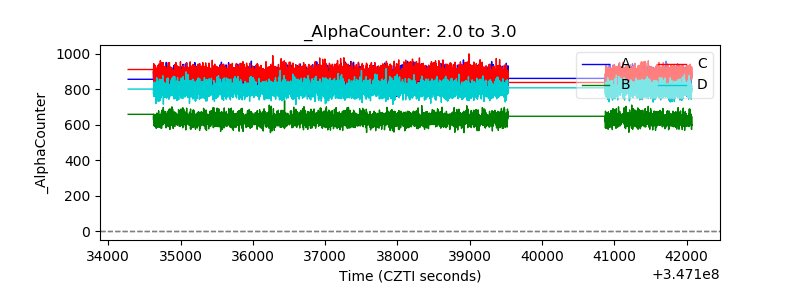 |
| _CPM_Rate | 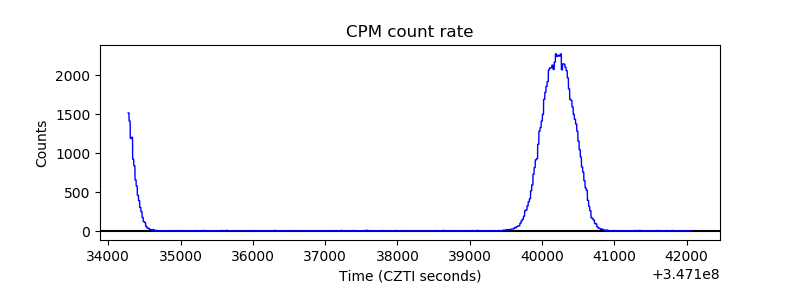 |
| CZT Counter | 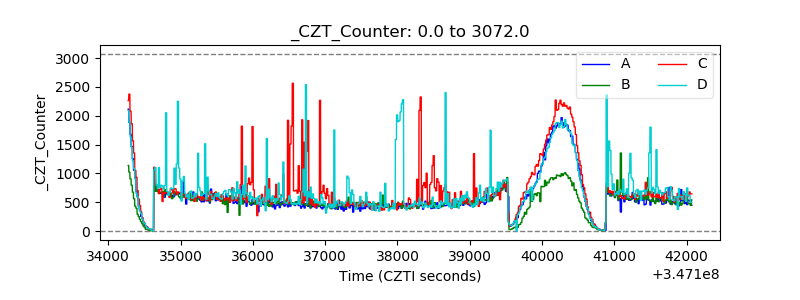 |
| +2.5 Volts monitor |  |
| +5 Volts monitor |  |
| _ROLL_ROT |  |
| _Roll_DEC | 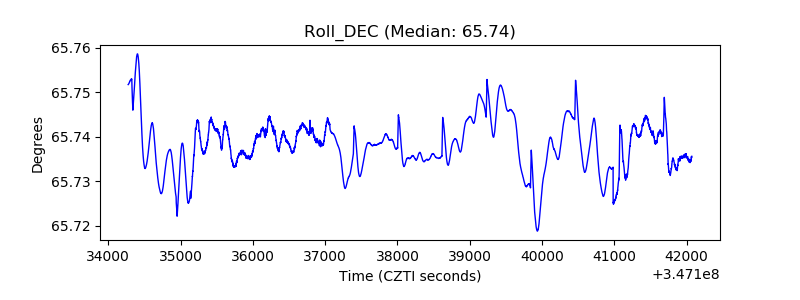 |
| _Roll_RA | 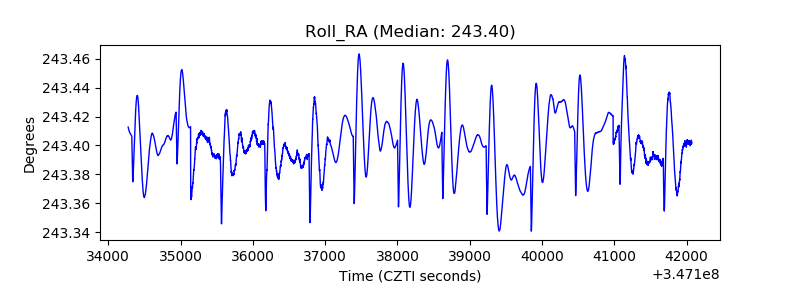 |
| Veto Counter | 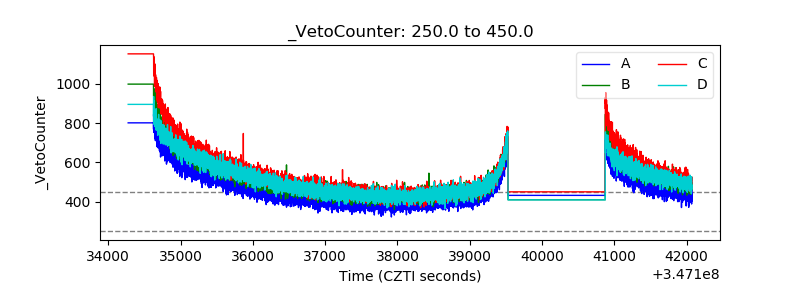 |