| Param | Original file | Final file |
|---|---|---|
| Filename | modeM0/AS1A10_101T21_9000004090_28447cztM0_level2.evt | modeM0/AS1A10_101T21_9000004090_28447cztM0_level2_quad_clean.evt |
| Size (bytes) | 567,659,520 | 134,910,720 |
| Size | 541.4 MB | 128.7 MB |
| Events in quadrant A | 3,492,893 | 906,032 |
| Events in quadrant B | 3,637,020 | 924,206 |
| Events in quadrant C | 3,652,310 | 895,096 |
| Events in quadrant D | 5,902,048 | 840,352 |
| Mode M0 | |||
|---|---|---|---|
| Quadrant | BADHDUFLAG | Total packets | Discarded packets |
| A | 0 | 15507 | 0 |
| B | 0 | 15734 | 0 |
| C | 0 | 15885 | 0 |
| D | 0 | 22827 | 0 |
| Mode M9 | |||
|---|---|---|---|
| Quadrant | BADHDUFLAG | Total packets | Discarded packets |
| A | 0 | 6 | 0 |
| B | 0 | 7 | 0 |
| C | 0 | 7 | 0 |
| D | 0 | 7 | 0 |
| Quadrant | Total seconds | Saturated seconds | Saturation percentage |
|---|---|---|---|
| A | 7477 | 33 | 0.441353% |
| B | 7477 | 42 | 0.561723% |
| C | 7477 | 147 | 1.966029% |
| D | 7477 | 551 | 7.369266% |
Noise dominated data is calculated using 1-second bins in cleaned event files. If a bin has >2000 counts, and if more than 50% of those come from <1% of pixels, then it is considered to be noise-dominated and hence unusable.
| Quadrant | # 1 sec bins | Bins with >0 counts | Bins with >2000 counts | High rate bins dominated by noise | Noise dominated (total time) | Noise dominated (detector-on time) | Marked lightcurve |
|---|---|---|---|---|---|---|---|
| A | 7932 | 7478 | 10 | 10 | 0.13% | 0.13% | 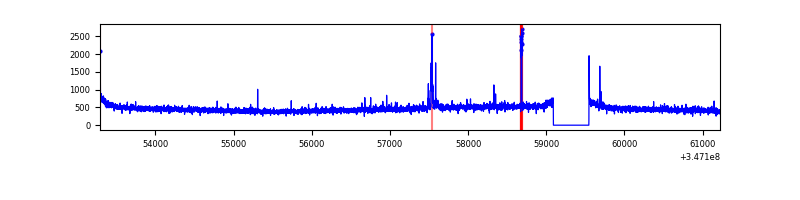 |
| B | 7932 | 7478 | 1 | 1 | 0.01% | 0.01% | 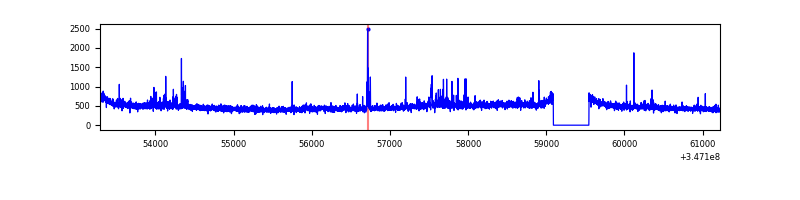 |
| C | 7932 | 7478 | 49 | 49 | 0.62% | 0.66% | 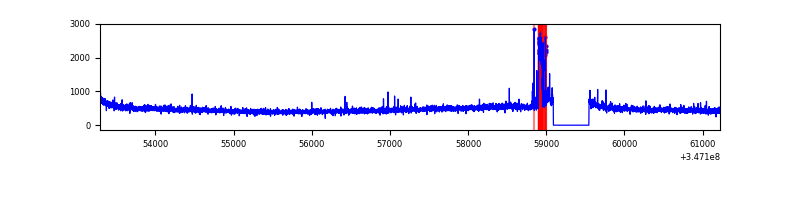 |
| D | 7932 | 7478 | 499 | 499 | 6.29% | 6.67% | 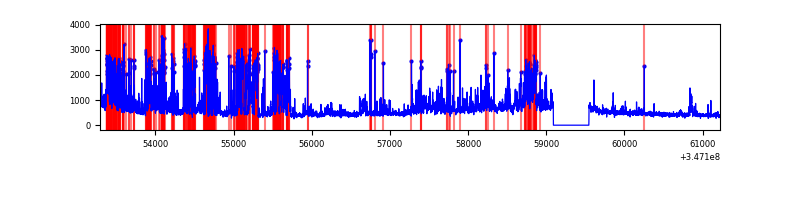 |
Top three noisy pixels from each quadrant. If the there are fewer than three noisy pixels in the level2.evt file, extra rows are filled as -1
| Pixel properties | Quadrant properties | ||||||
|---|---|---|---|---|---|---|---|
| Quadrant | DetID | PixID | Counts | Sigma | Mean | Median | Sigma |
| A | 15 | 174 | 81096 | 454.31 | 878 | 858 | 176.6 |
| A | 15 | 169 | 12424 | 65.49 | 878 | 858 | 176.6 |
| A | 13 | 254 | 12348 | 65.06 | 878 | 858 | 176.6 |
| B | 10 | 245 | 87831 | 520.33 | 879 | 856 | 167.2 |
| B | 0 | 230 | 25995 | 150.4 | 879 | 856 | 167.2 |
| B | 10 | 246 | 25978 | 150.29 | 879 | 856 | 167.2 |
| C | 7 | 220 | 184195 | 924.41 | 852 | 859 | 198.3 |
| C | 14 | 238 | 139315 | 698.12 | 852 | 859 | 198.3 |
| C | 3 | 233 | 10886 | 50.56 | 852 | 859 | 198.3 |
| D | 1 | 52 | 2208206 | 11066.11 | 831 | 808 | 199.5 |
| D | 2 | 250 | 356305 | 1782.17 | 831 | 808 | 199.5 |
| D | 8 | 195 | 145938 | 727.56 | 831 | 808 | 199.5 |
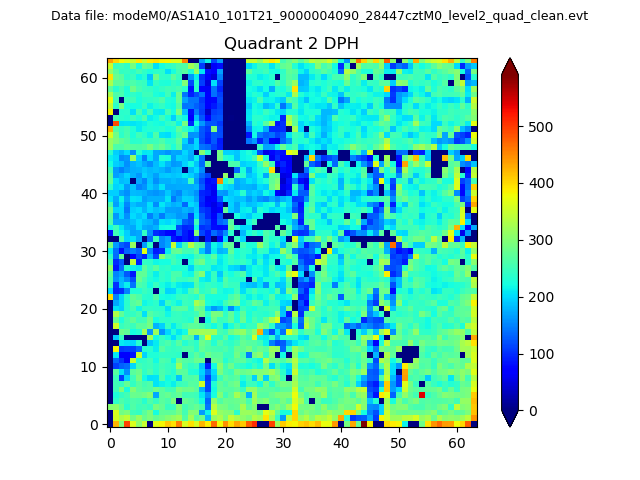
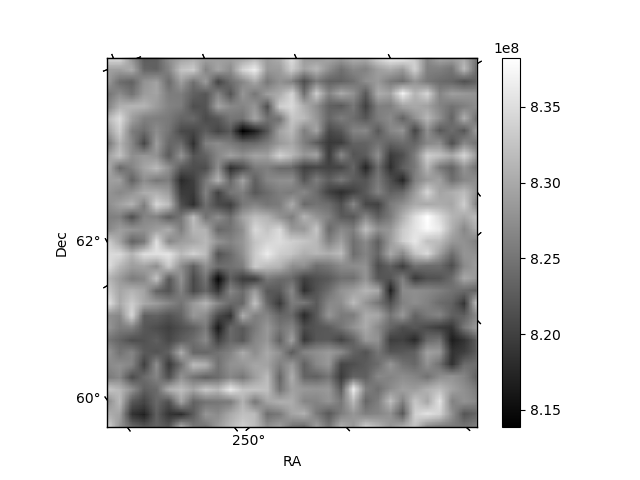
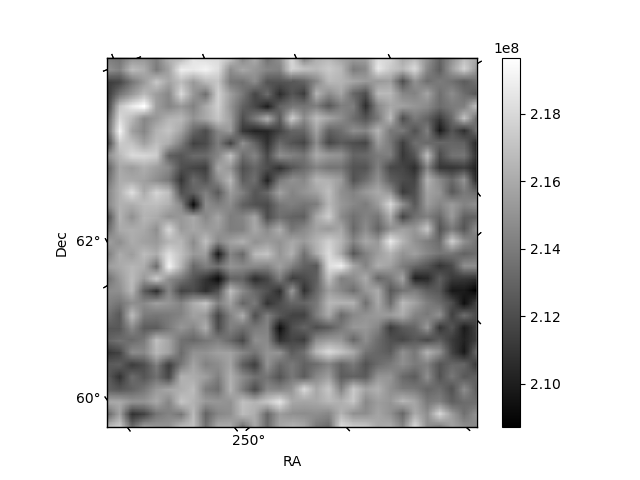
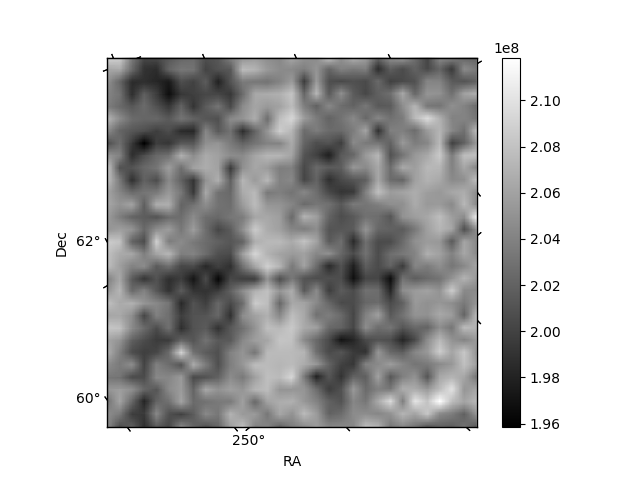
Histogram calculated using DETX and DETY for each event in the final _common_clean file
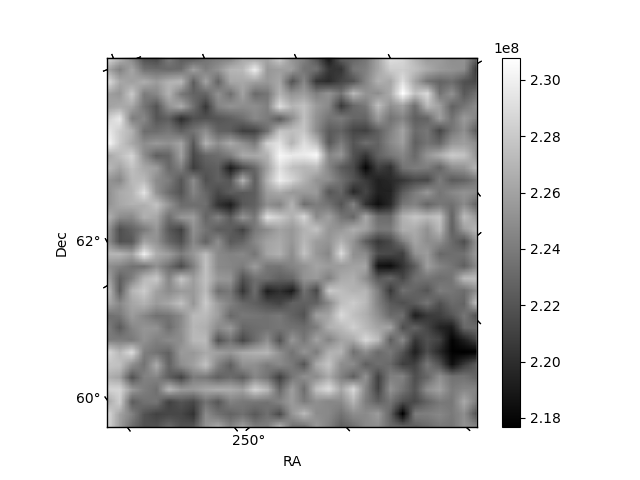
| Quadrant A | 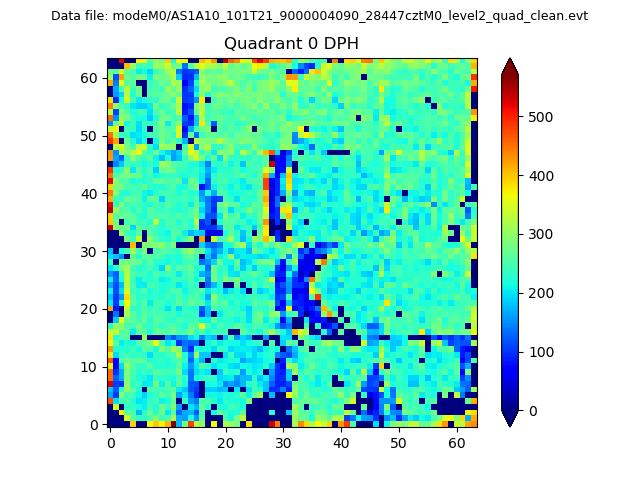 |
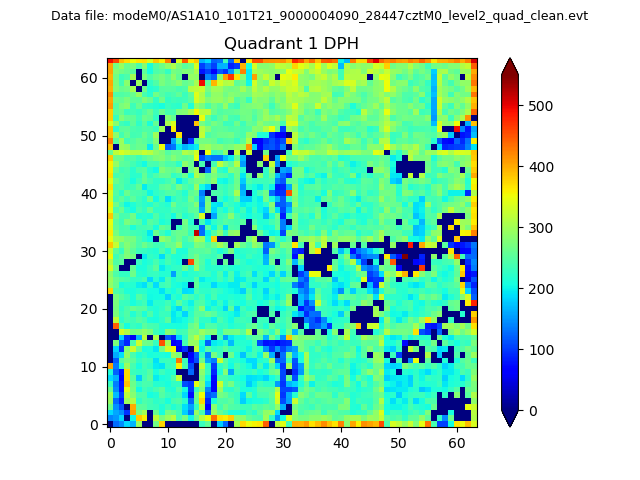 |
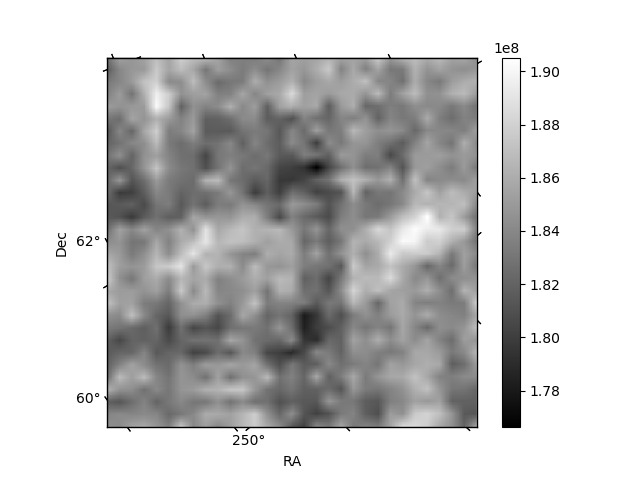
Quadrant B |
|---|---|---|---|
| Quadrant D | 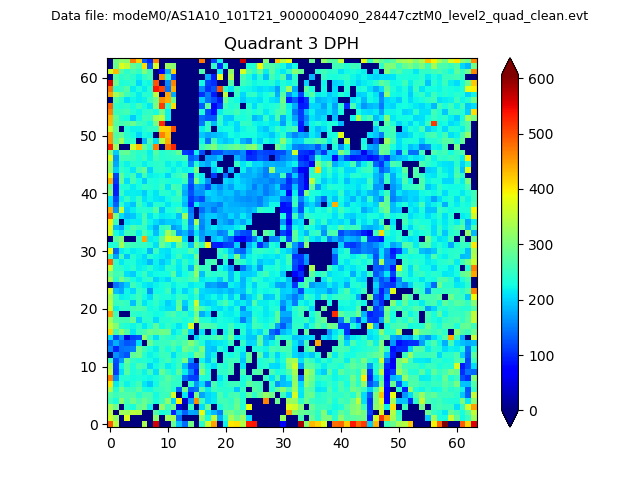 |
 |
Quadrant C |
| Plot type | Count rate plots | Images |
|---|---|---|
| Comparison with Poisson distribution Blue bars denote a histogram of data divided into 1 sec bins. Red curve is a Poisson curve with rate = median count rate of data. |
 |
 |
| Quadrant-wise count rates Data is divided into 100 sec bins |
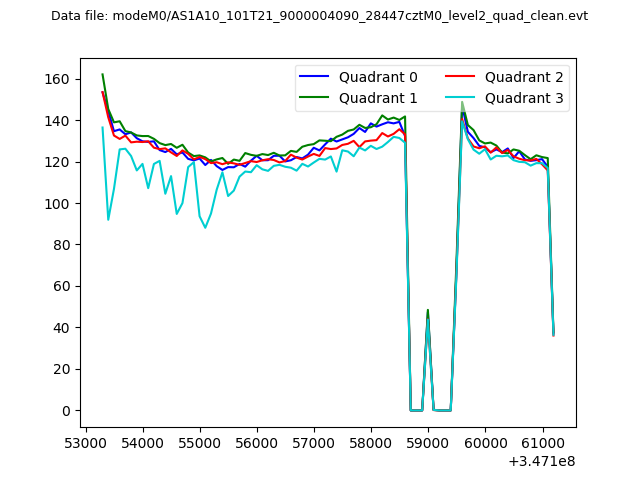 |
|
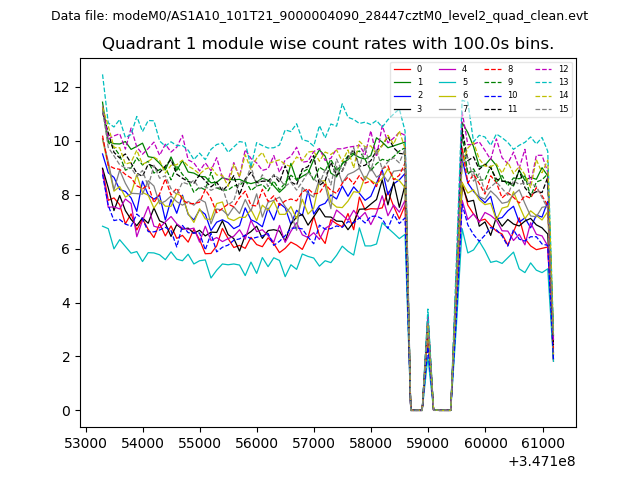
| Module-wise count rates for Quadrant A Data is divided into 100 sec bins |
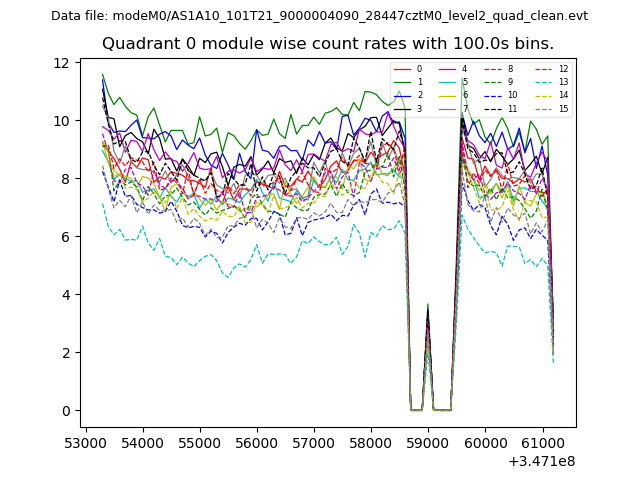 |
 |
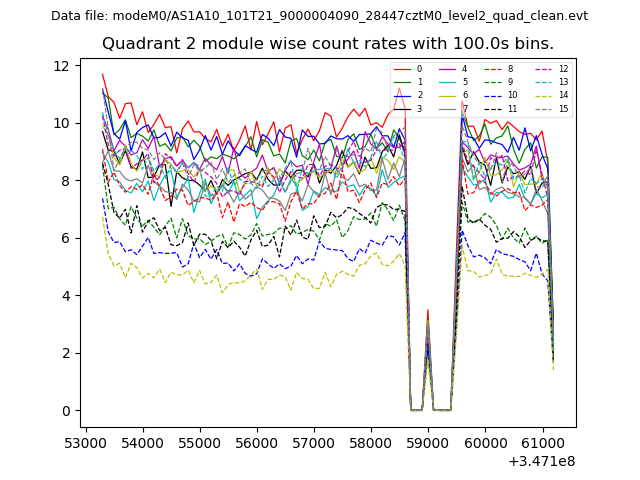
| Module-wise count rates for Quadrant B Data is divided into 100 sec bins |
 |
 |
| Module-wise count rates for Quadrant C Data is divided into 100 sec bins |
 |
 |
| Module-wise count rates for Quadrant D Data is divided into 100 sec bins |
 |
 |
| Parameter | Plot |
|---|---|
| CZT HV Monitor | 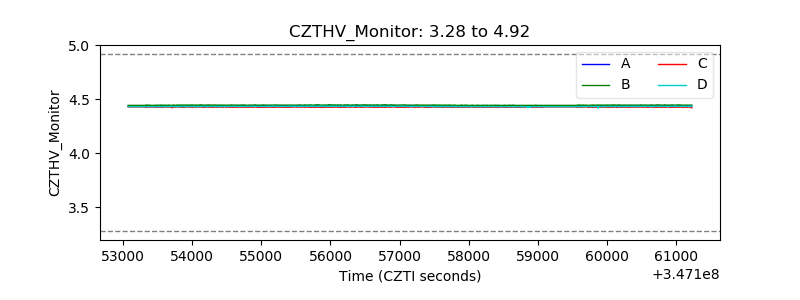 |
| D_VDD | 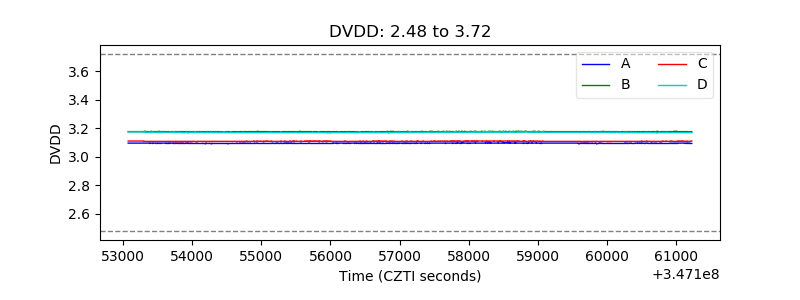 |
| Temperature 1 | 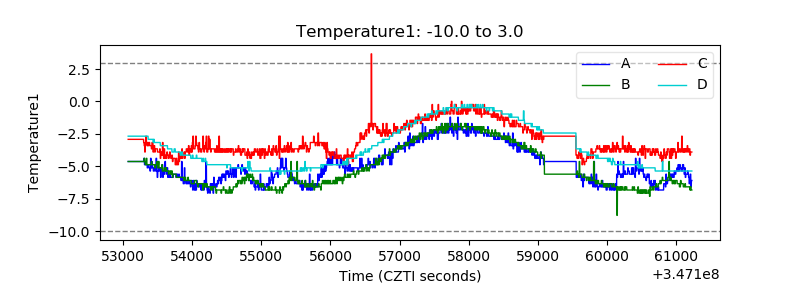 |
| Veto HV Monitor | 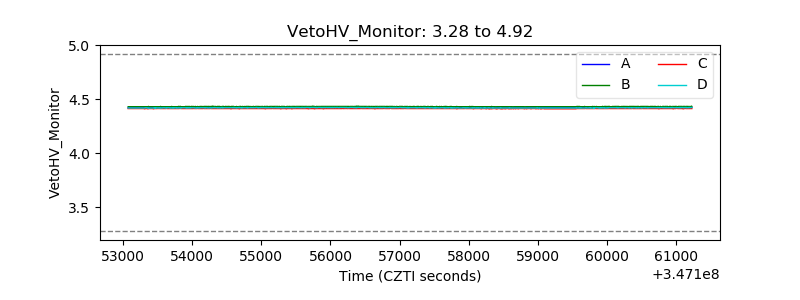 |
| Veto LLD | 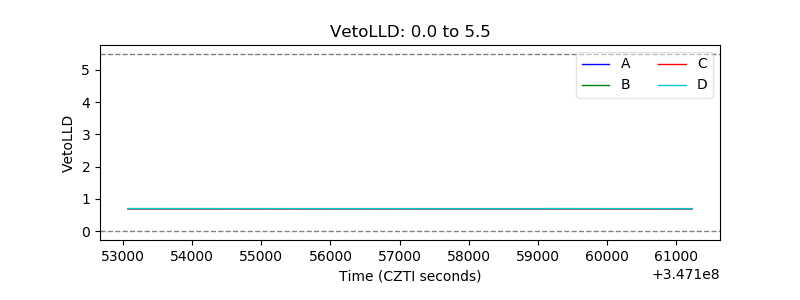 |
| Alpha Counter | 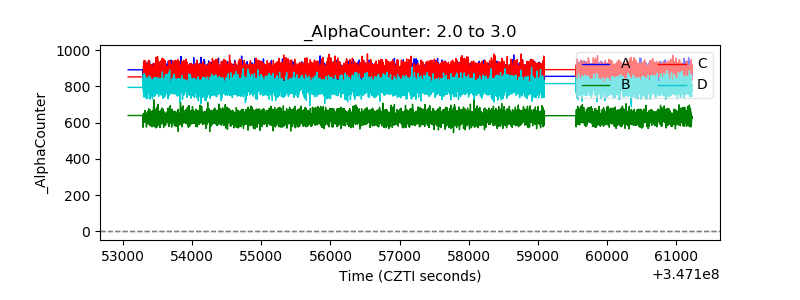 |
| _CPM_Rate | 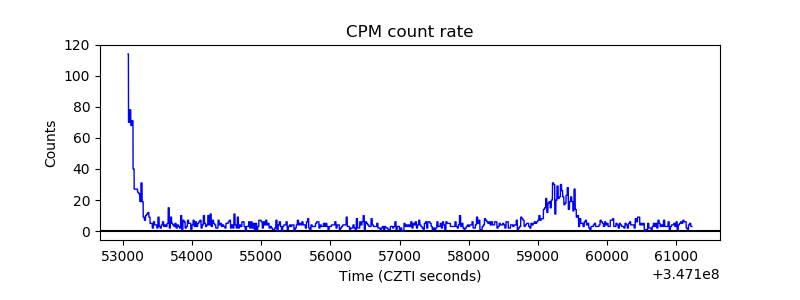 |
| CZT Counter | 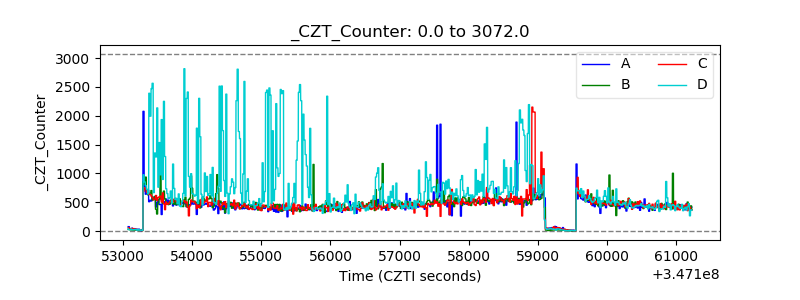 |
| +2.5 Volts monitor |  |
| +5 Volts monitor |  |
| _ROLL_ROT | 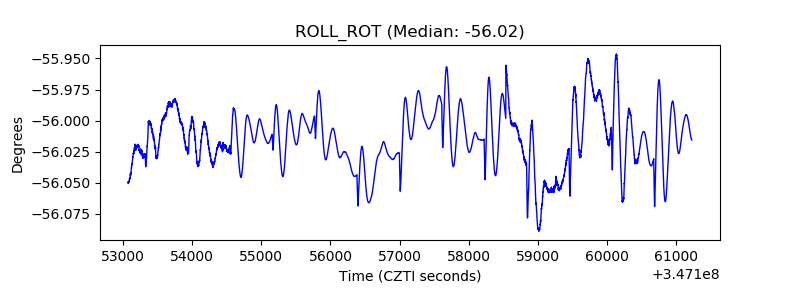 |
| _Roll_DEC | 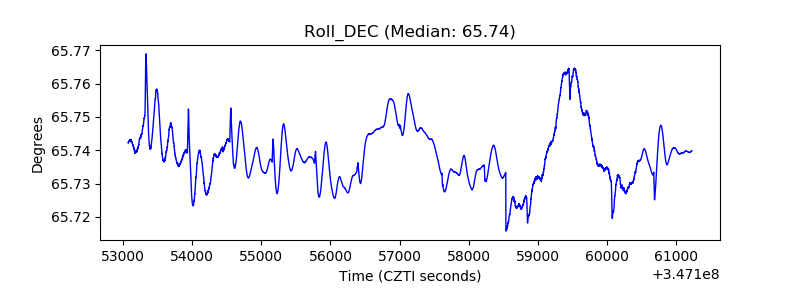 |
| _Roll_RA | 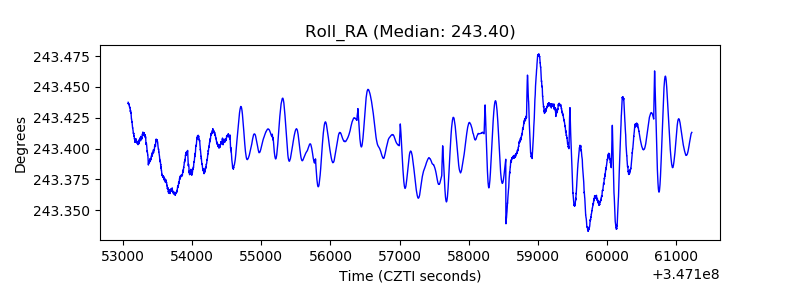 |
| Veto Counter | 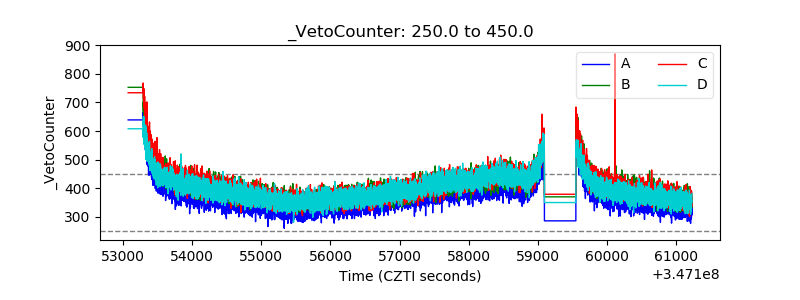 |