| Param | Original file | Final file |
|---|---|---|
| Filename | modeM0/AS1A10_101T21_9000004090_28448cztM0_level2.evt | modeM0/AS1A10_101T21_9000004090_28448cztM0_level2_quad_clean.evt |
| Size (bytes) | 570,407,040 | 136,177,920 |
| Size | 544.0 MB | 129.9 MB |
| Events in quadrant A | 3,496,160 | 912,149 |
| Events in quadrant B | 3,622,631 | 931,618 |
| Events in quadrant C | 3,586,839 | 897,330 |
| Events in quadrant D | 6,052,930 | 854,088 |
| Mode M0 | |||
|---|---|---|---|
| Quadrant | BADHDUFLAG | Total packets | Discarded packets |
| A | 0 | 15640 | 0 |
| B | 0 | 15836 | 0 |
| C | 0 | 15766 | 0 |
| D | 0 | 23409 | 0 |
| Mode M9 | |||
|---|---|---|---|
| Quadrant | BADHDUFLAG | Total packets | Discarded packets |
| A | 0 | 1 | 0 |
| B | 0 | 1 | 0 |
| C | 0 | 1 | 0 |
| D | 0 | 1 | 0 |
| Quadrant | Total seconds | Saturated seconds | Saturation percentage |
|---|---|---|---|
| A | 7608 | 73 | 0.959516% |
| B | 7609 | 96 | 1.261664% |
| C | 7609 | 121 | 1.590222% |
| D | 7609 | 517 | 6.794585% |
Noise dominated data is calculated using 1-second bins in cleaned event files. If a bin has >2000 counts, and if more than 50% of those come from <1% of pixels, then it is considered to be noise-dominated and hence unusable.
| Quadrant | # 1 sec bins | Bins with >0 counts | Bins with >2000 counts | High rate bins dominated by noise | Noise dominated (total time) | Noise dominated (detector-on time) | Marked lightcurve |
|---|---|---|---|---|---|---|---|
| A | 7753 | 7610 | 0 | 0 | 0.00% | 0.00% | 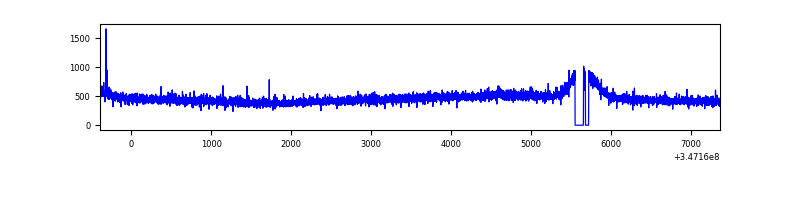 |
| B | 7754 | 7611 | 1 | 1 | 0.01% | 0.01% | 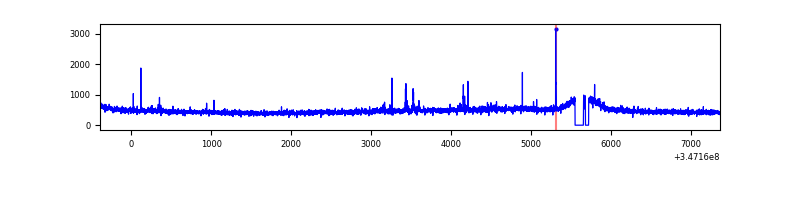 |
| C | 7754 | 7611 | 0 | 0 | 0.00% | 0.00% | 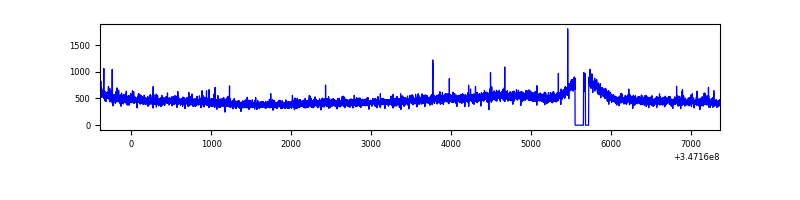 |
| D | 7754 | 7611 | 677 | 677 | 8.73% | 8.90% | 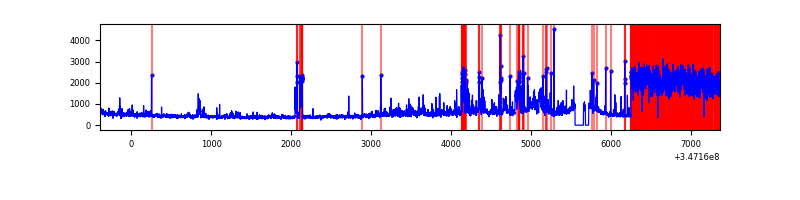 |
Top three noisy pixels from each quadrant. If the there are fewer than three noisy pixels in the level2.evt file, extra rows are filled as -1
| Pixel properties | Quadrant properties | ||||||
|---|---|---|---|---|---|---|---|
| Quadrant | DetID | PixID | Counts | Sigma | Mean | Median | Sigma |
| A | 15 | 174 | 15612 | 80.91 | 902 | 882 | 182.1 |
| A | 13 | 254 | 13175 | 67.53 | 902 | 882 | 182.1 |
| A | 3 | 137 | 9157 | 45.45 | 902 | 882 | 182.1 |
| B | 0 | 230 | 28256 | 160.07 | 899 | 877 | 171.0 |
| B | 0 | 190 | 22127 | 124.23 | 899 | 877 | 171.0 |
| B | 12 | 111 | 21788 | 122.25 | 899 | 877 | 171.0 |
| C | 14 | 238 | 139848 | 677.01 | 874 | 878 | 205.3 |
| C | 7 | 220 | 20378 | 95.0 | 874 | 878 | 205.3 |
| C | 3 | 233 | 16783 | 77.48 | 874 | 878 | 205.3 |
| D | 8 | 195 | 1838452 | 8917.54 | 862 | 838 | 206.1 |
| D | 1 | 52 | 503222 | 2437.96 | 862 | 838 | 206.1 |
| D | 2 | 250 | 273792 | 1324.59 | 862 | 838 | 206.1 |
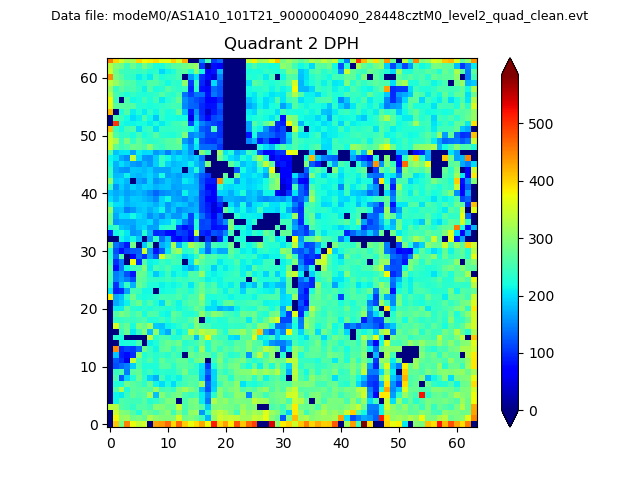
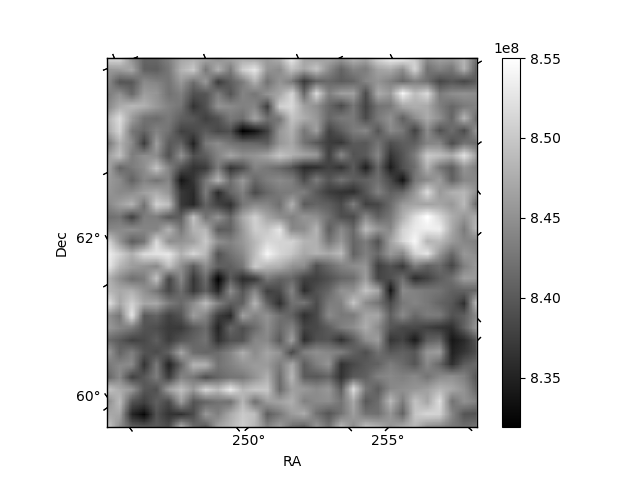
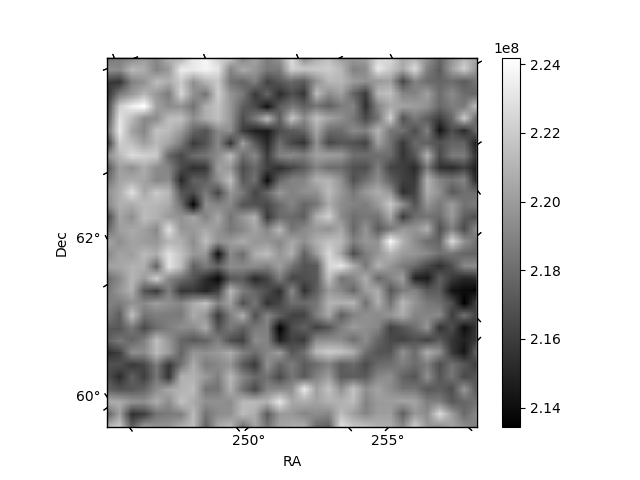
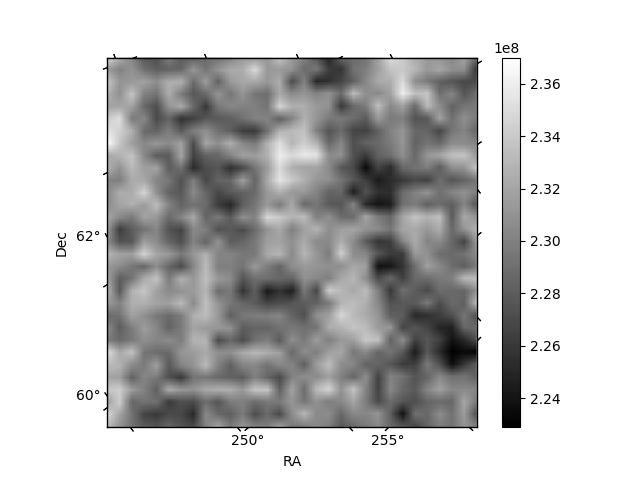
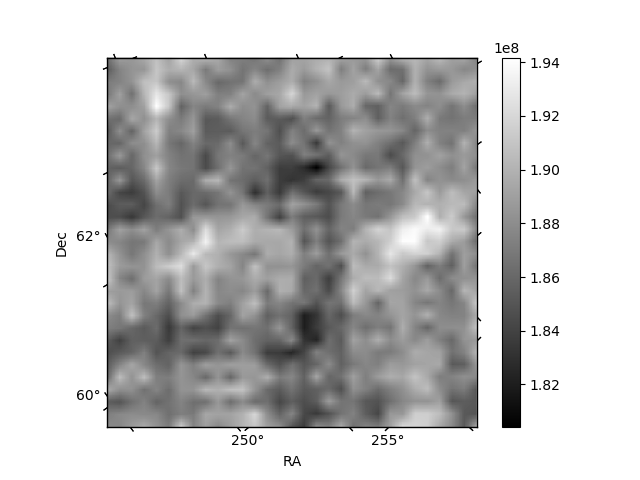
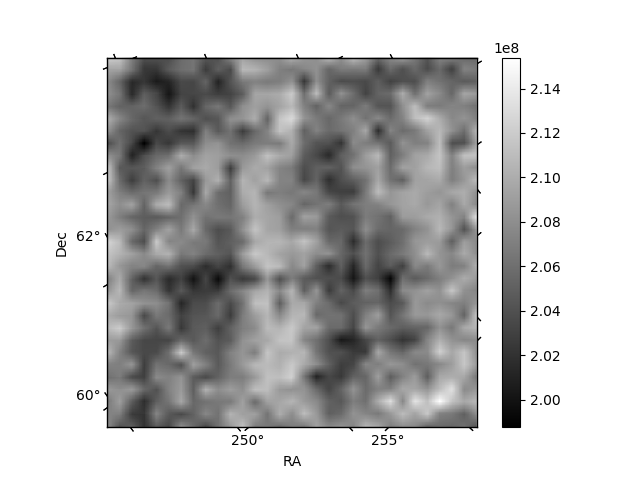
Histogram calculated using DETX and DETY for each event in the final _common_clean file
| Quadrant A | 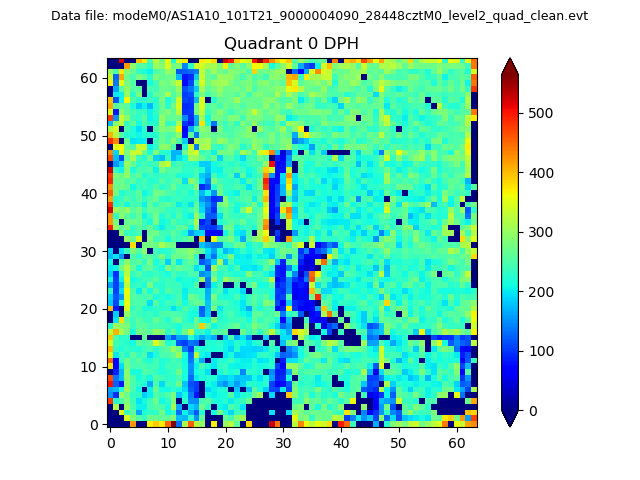 |
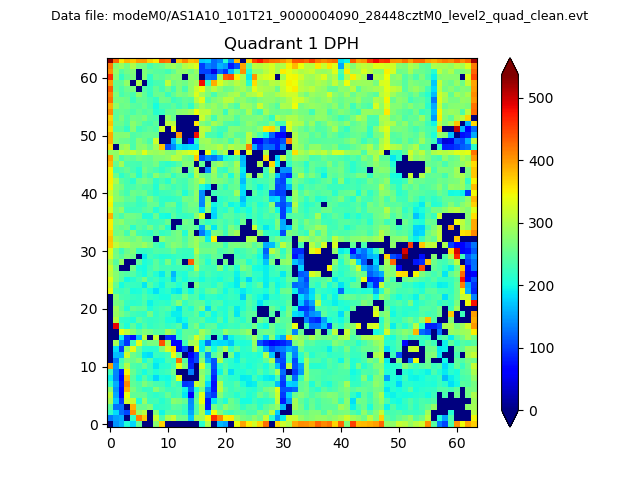 |
Quadrant B |
|---|---|---|---|
| Quadrant D | 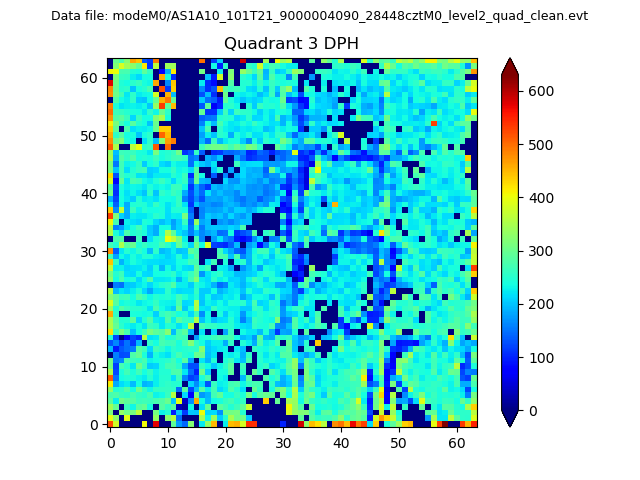 |
 |
Quadrant C |
| Plot type | Count rate plots | Images |
|---|---|---|
| Comparison with Poisson distribution Blue bars denote a histogram of data divided into 1 sec bins. Red curve is a Poisson curve with rate = median count rate of data. |
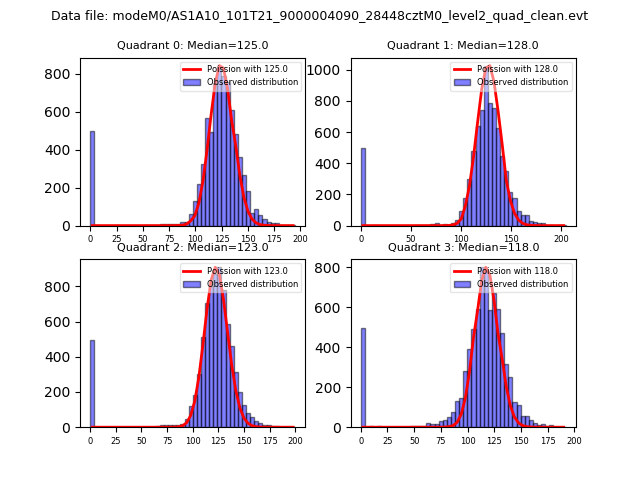 |
 |
| Quadrant-wise count rates Data is divided into 100 sec bins |
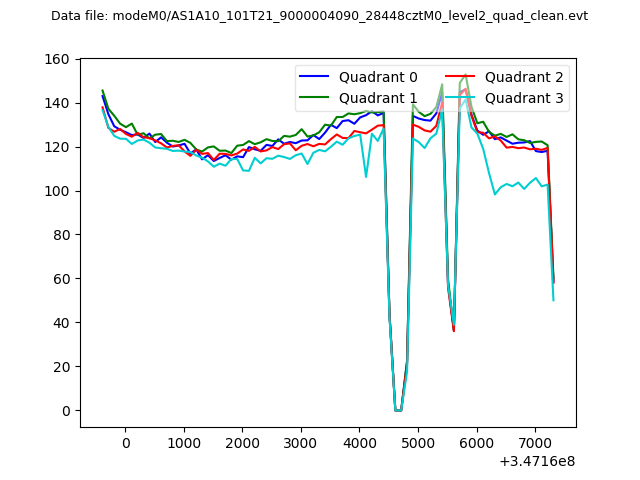 |
|
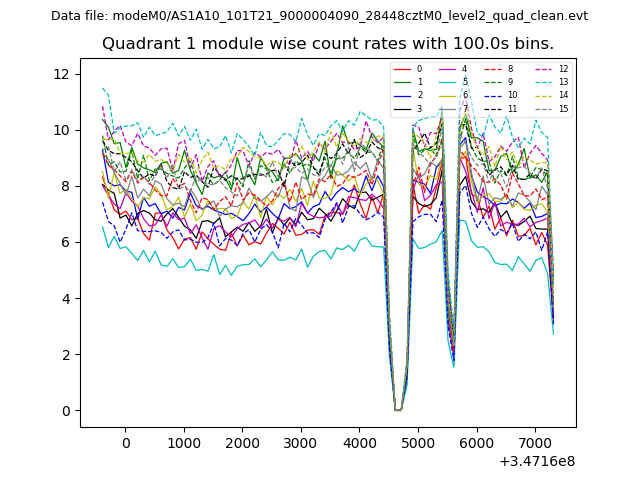
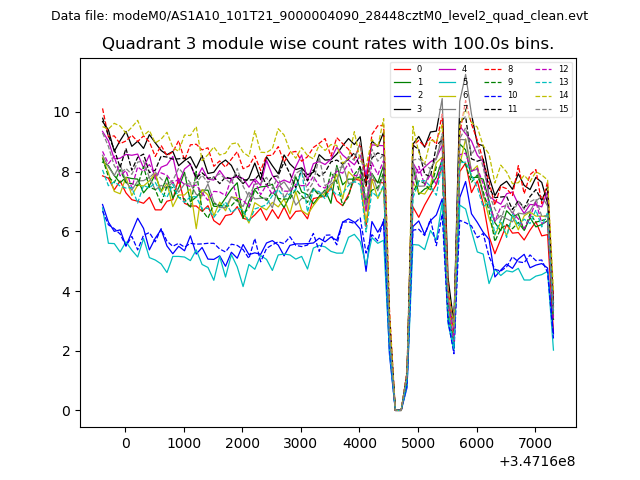
| Module-wise count rates for Quadrant A Data is divided into 100 sec bins |
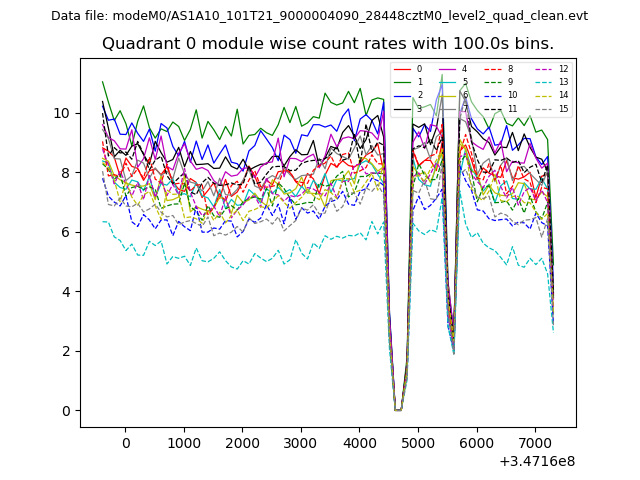 |
 |
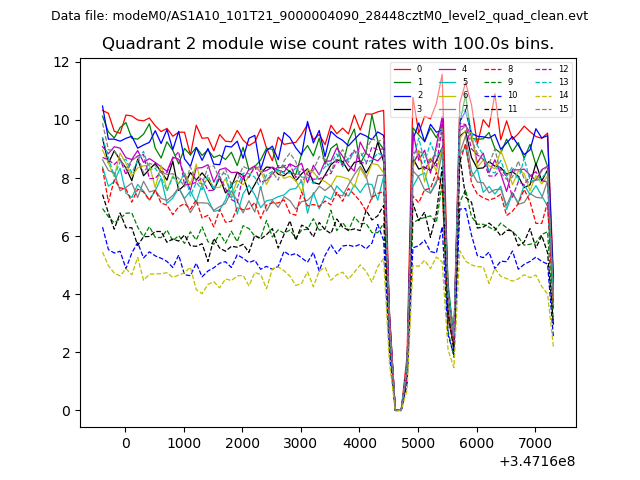
| Module-wise count rates for Quadrant B Data is divided into 100 sec bins |
 |
 |
| Module-wise count rates for Quadrant C Data is divided into 100 sec bins |
 |
 |
| Module-wise count rates for Quadrant D Data is divided into 100 sec bins |
 |
 |
| Parameter | Plot |
|---|---|
| CZT HV Monitor |  |
| D_VDD | 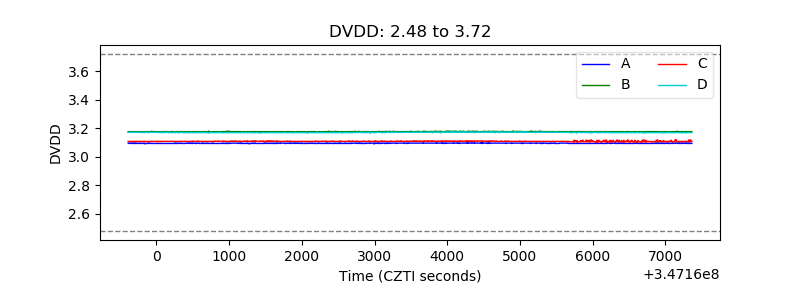 |
| Temperature 1 |  |
| Veto HV Monitor | 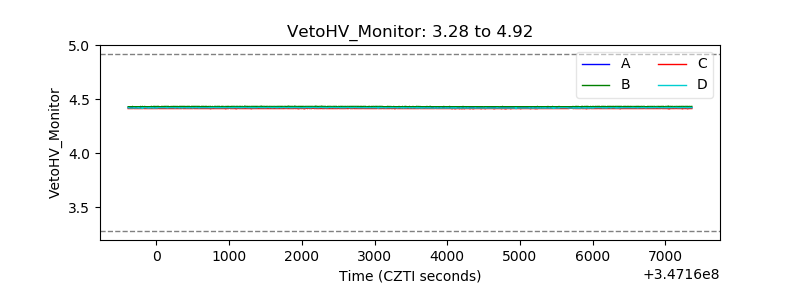 |
| Veto LLD | 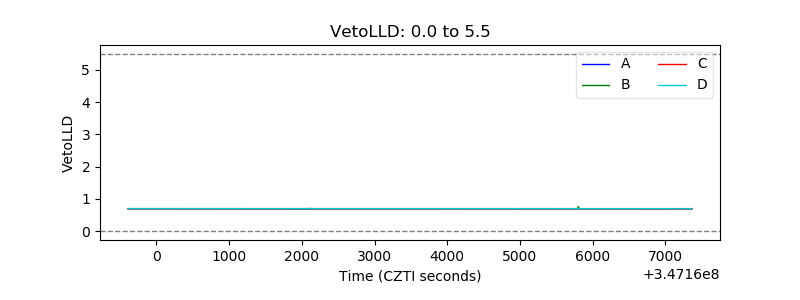 |
| Alpha Counter | 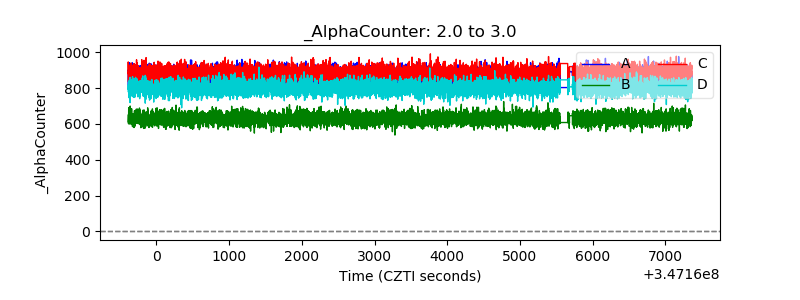 |
| _CPM_Rate | 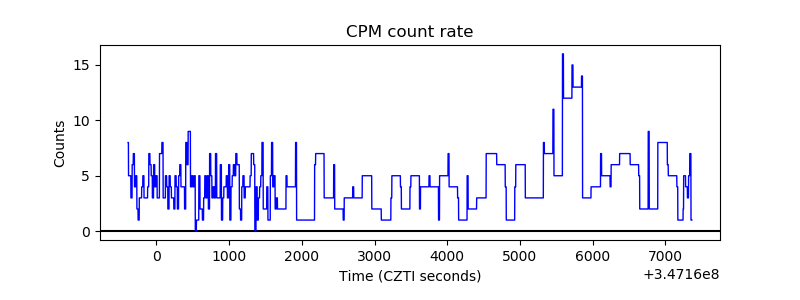 |
| CZT Counter | 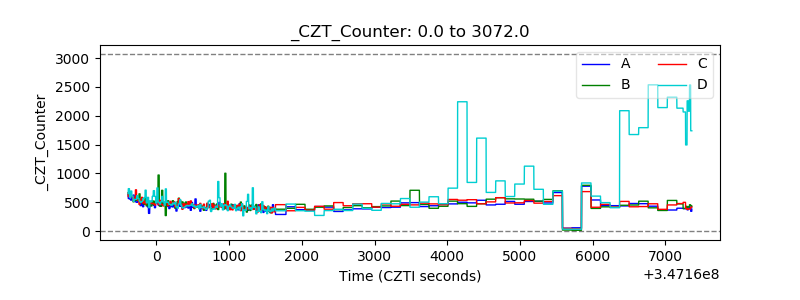 |
| +2.5 Volts monitor |  |
| +5 Volts monitor |  |
| _ROLL_ROT | 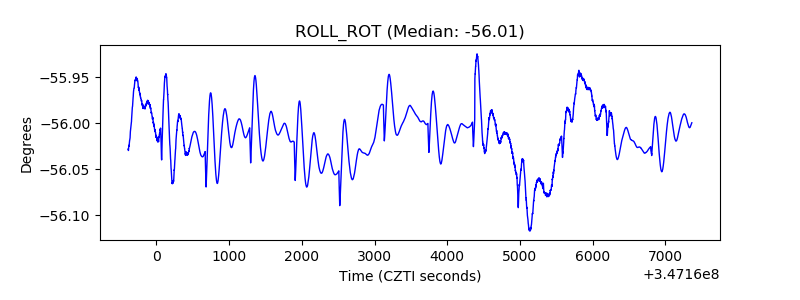 |
| _Roll_DEC |  |
| _Roll_RA | 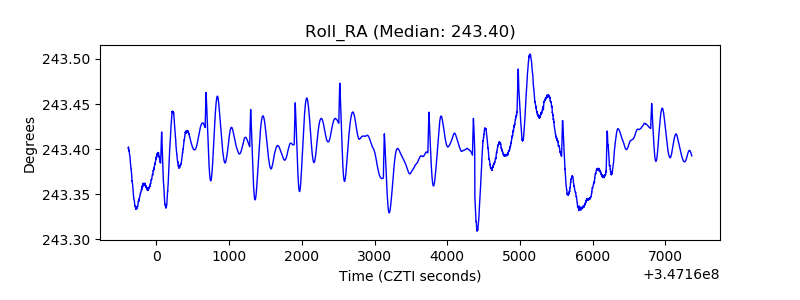 |
| Veto Counter | 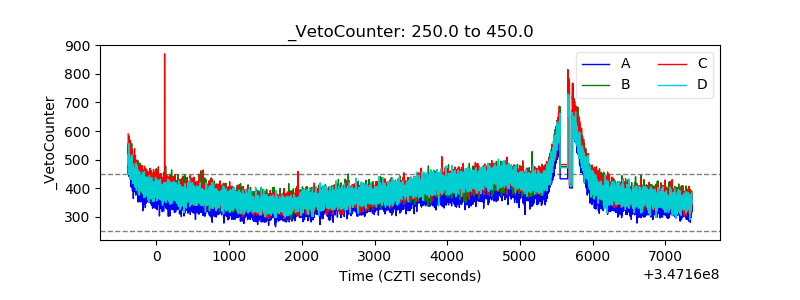 |