| Param | Original file | Final file |
|---|---|---|
| Filename | modeM0/AS1A10_101T21_9000004090_28449cztM0_level2.evt | modeM0/AS1A10_101T21_9000004090_28449cztM0_level2_quad_clean.evt |
| Size (bytes) | 531,308,160 | 126,564,480 |
| Size | 506.7 MB | 120.7 MB |
| Events in quadrant A | 3,263,246 | 844,376 |
| Events in quadrant B | 3,323,075 | 864,463 |
| Events in quadrant C | 3,367,965 | 830,230 |
| Events in quadrant D | 5,648,860 | 793,851 |
| Mode M0 | |||
|---|---|---|---|
| Quadrant | BADHDUFLAG | Total packets | Discarded packets |
| A | 0 | 14770 | 0 |
| B | 0 | 14758 | 0 |
| C | 0 | 14878 | 0 |
| D | 0 | 21866 | 0 |
| Mode M9 | |||
|---|---|---|---|
| Quadrant | BADHDUFLAG | Total packets | Discarded packets |
| A | 0 | 3 | 0 |
| B | 0 | 3 | 0 |
| C | 0 | 3 | 0 |
| D | 0 | 3 | 0 |
| Quadrant | Total seconds | Saturated seconds | Saturation percentage |
|---|---|---|---|
| A | 7181 | 66 | 0.919092% |
| B | 7181 | 106 | 1.476118% |
| C | 7182 | 138 | 1.921470% |
| D | 7182 | 451 | 6.279588% |
Noise dominated data is calculated using 1-second bins in cleaned event files. If a bin has >2000 counts, and if more than 50% of those come from <1% of pixels, then it is considered to be noise-dominated and hence unusable.
| Quadrant | # 1 sec bins | Bins with >0 counts | Bins with >2000 counts | High rate bins dominated by noise | Noise dominated (total time) | Noise dominated (detector-on time) | Marked lightcurve |
|---|---|---|---|---|---|---|---|
| A | 7456 | 7182 | 2 | 2 | 0.03% | 0.03% | 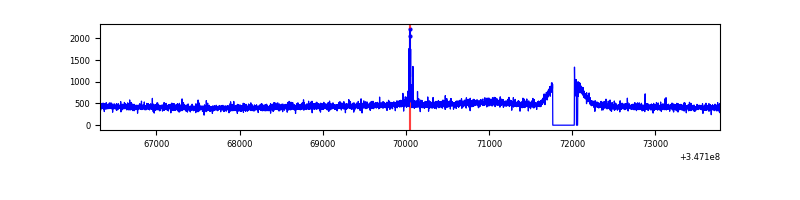 |
| B | 7456 | 7182 | 0 | 0 | 0.00% | 0.00% | 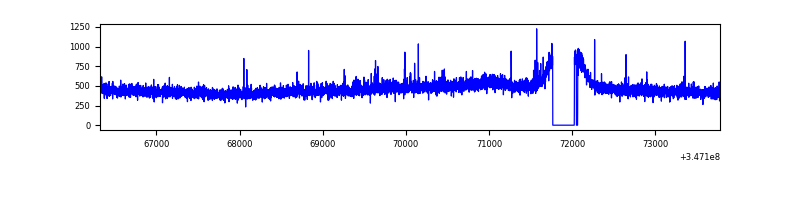 |
| C | 7457 | 7183 | 6 | 6 | 0.08% | 0.08% | 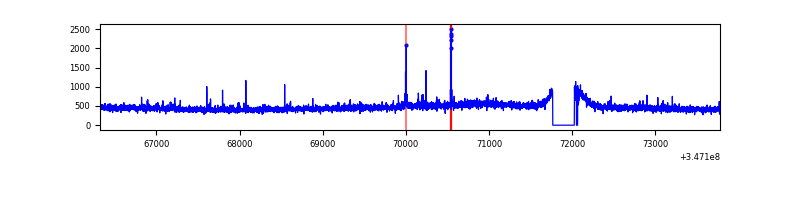 |
| D | 7457 | 7184 | 667 | 667 | 8.94% | 9.28% | 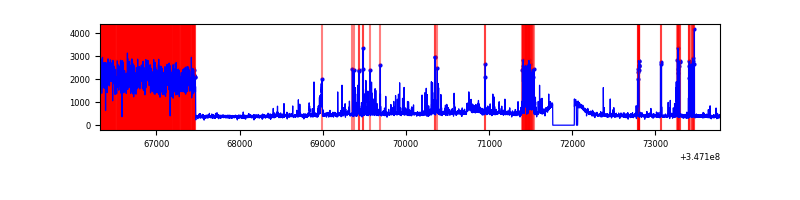 |
Top three noisy pixels from each quadrant. If the there are fewer than three noisy pixels in the level2.evt file, extra rows are filled as -1
| Pixel properties | Quadrant properties | ||||||
|---|---|---|---|---|---|---|---|
| Quadrant | DetID | PixID | Counts | Sigma | Mean | Median | Sigma |
| A | 15 | 174 | 34761 | 202.27 | 836 | 818 | 167.8 |
| A | 13 | 254 | 10796 | 59.46 | 836 | 818 | 167.8 |
| A | 3 | 137 | 8398 | 45.17 | 836 | 818 | 167.8 |
| B | 12 | 111 | 20058 | 120.31 | 833 | 811 | 160.0 |
| B | 10 | 245 | 18777 | 112.3 | 833 | 811 | 160.0 |
| B | 11 | 111 | 18531 | 110.76 | 833 | 811 | 160.0 |
| C | 14 | 238 | 128906 | 679.84 | 806 | 810 | 188.4 |
| C | 3 | 233 | 70383 | 369.24 | 806 | 810 | 188.4 |
| C | 7 | 220 | 13290 | 66.23 | 806 | 810 | 188.4 |
| D | 8 | 195 | 1882214 | 9802.89 | 803 | 779 | 191.9 |
| D | 1 | 52 | 404981 | 2106.02 | 803 | 779 | 191.9 |
| D | 2 | 250 | 204925 | 1063.67 | 803 | 779 | 191.9 |
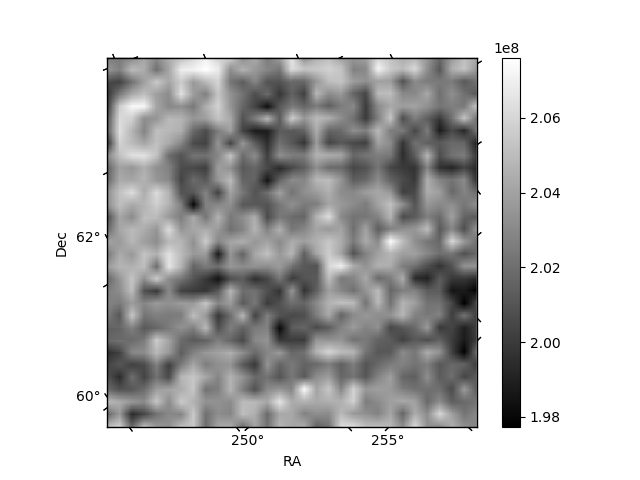
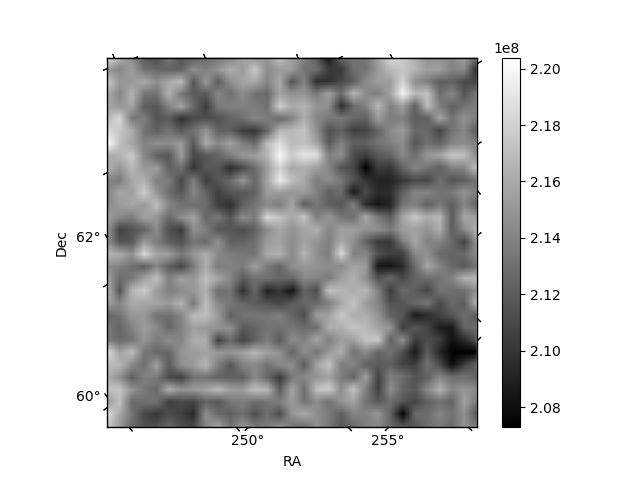
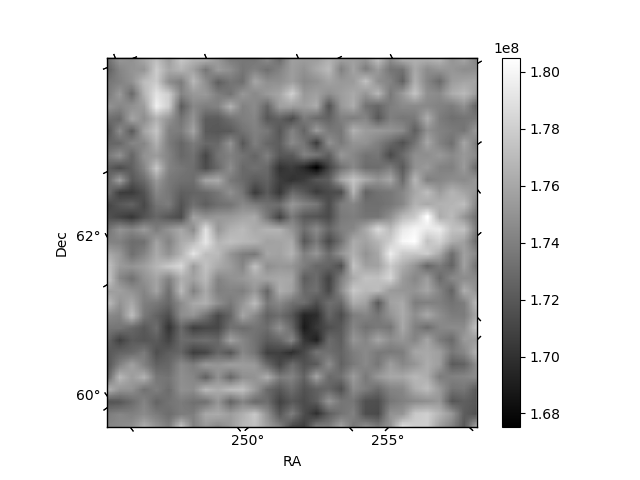
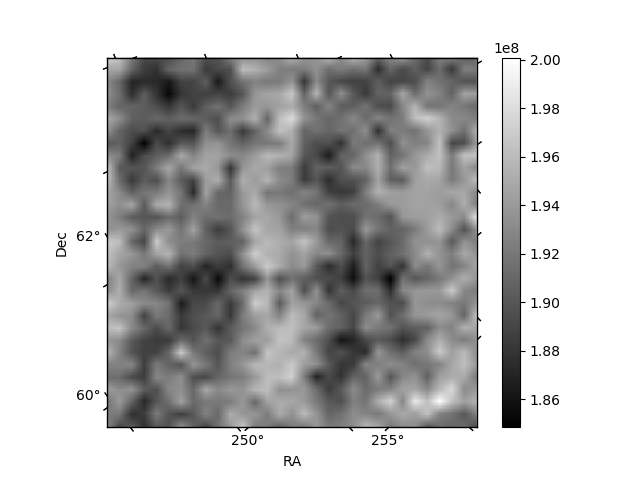
Histogram calculated using DETX and DETY for each event in the final _common_clean file
| Quadrant A | 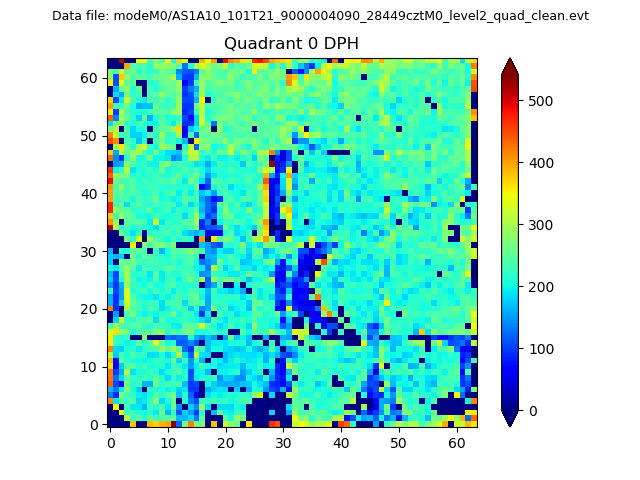 |
 |
Quadrant B |
|---|---|---|---|
| Quadrant D | 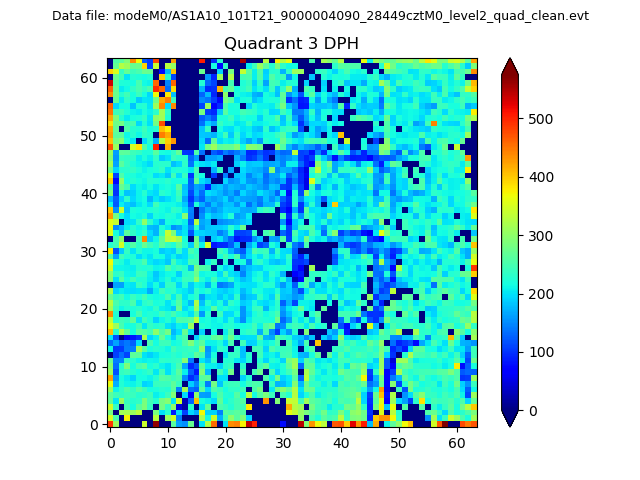 |
 |
Quadrant C |
| Plot type | Count rate plots | Images |
|---|---|---|
| Comparison with Poisson distribution Blue bars denote a histogram of data divided into 1 sec bins. Red curve is a Poisson curve with rate = median count rate of data. |
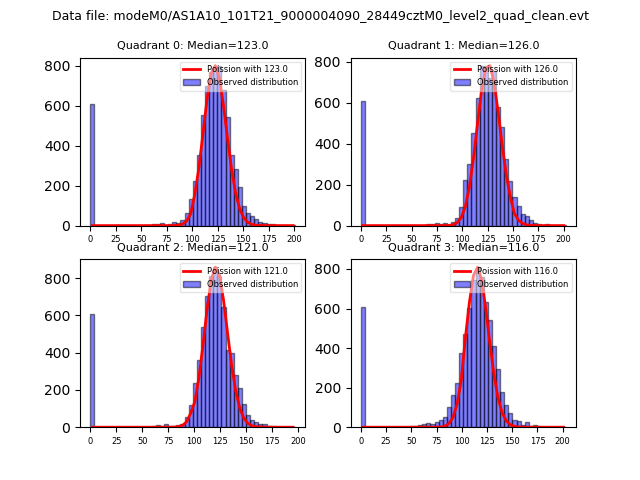 |
 |
| Quadrant-wise count rates Data is divided into 100 sec bins |
 |
|
| Module-wise count rates for Quadrant A Data is divided into 100 sec bins |
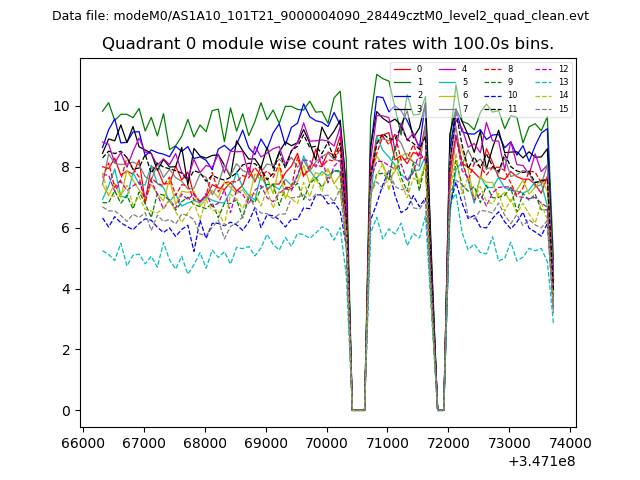 |
 |
| Module-wise count rates for Quadrant B Data is divided into 100 sec bins |
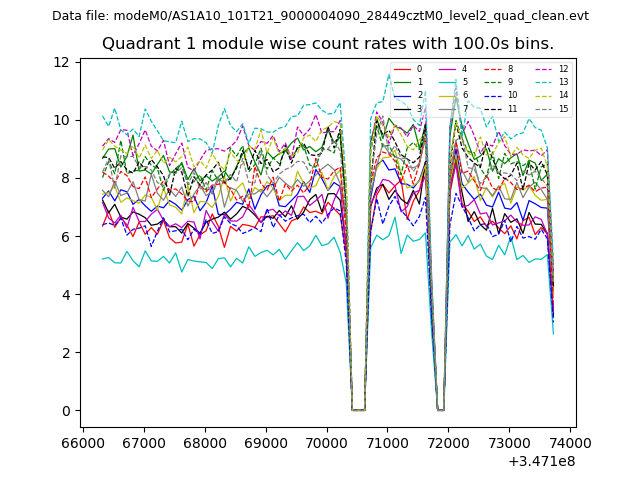 |
 |
| Module-wise count rates for Quadrant C Data is divided into 100 sec bins |
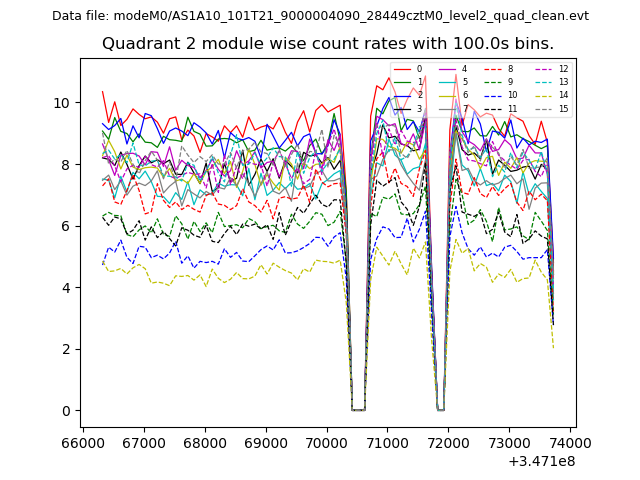 |
 |
| Module-wise count rates for Quadrant D Data is divided into 100 sec bins |
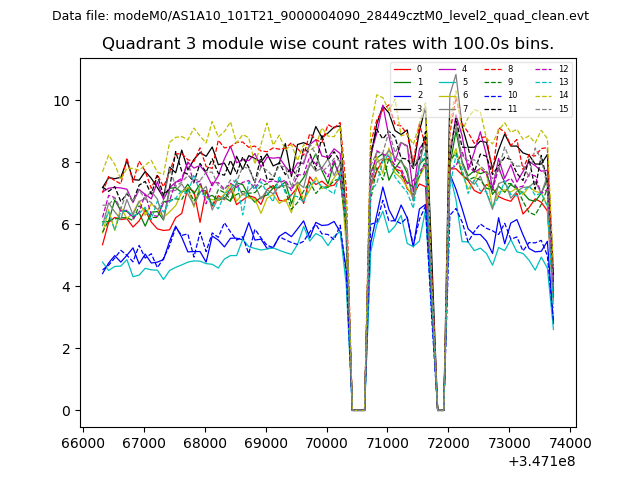 |
 |
| Parameter | Plot |
|---|---|
| CZT HV Monitor | 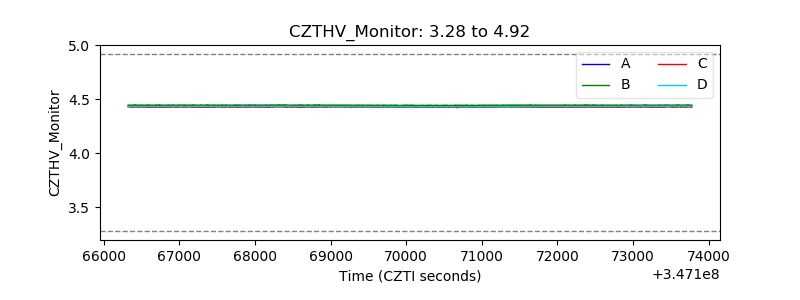 |
| D_VDD | 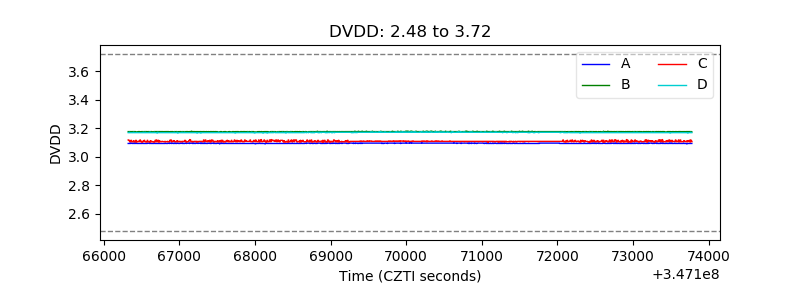 |
| Temperature 1 | 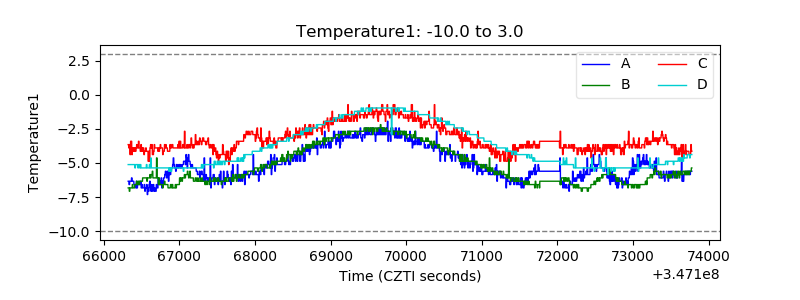 |
| Veto HV Monitor | 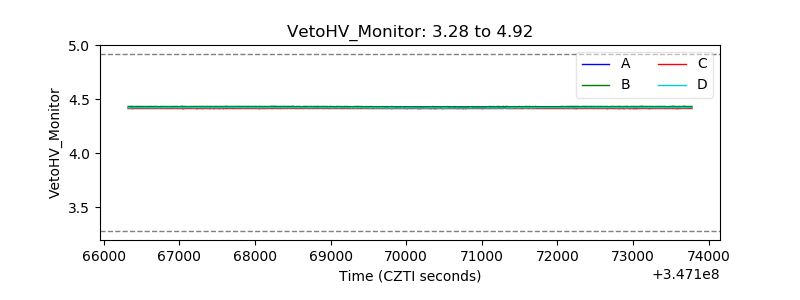 |
| Veto LLD | 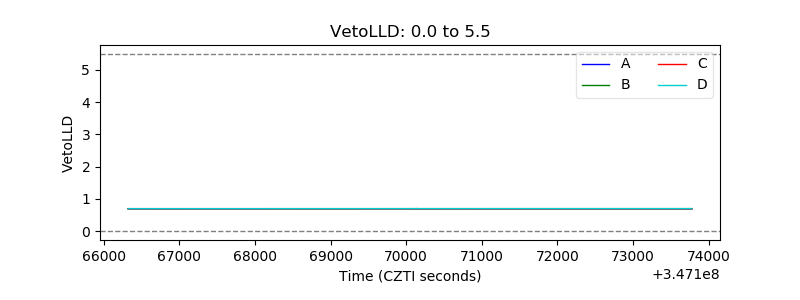 |
| Alpha Counter | 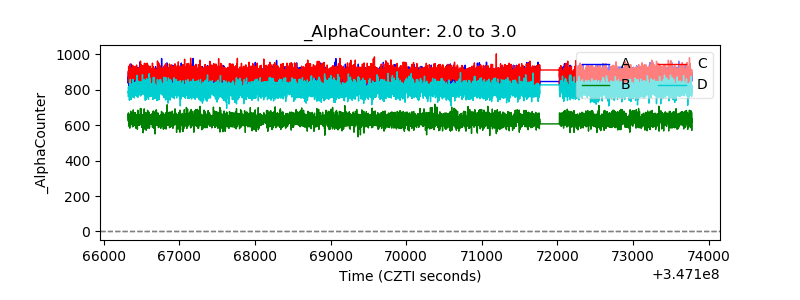 |
| _CPM_Rate | 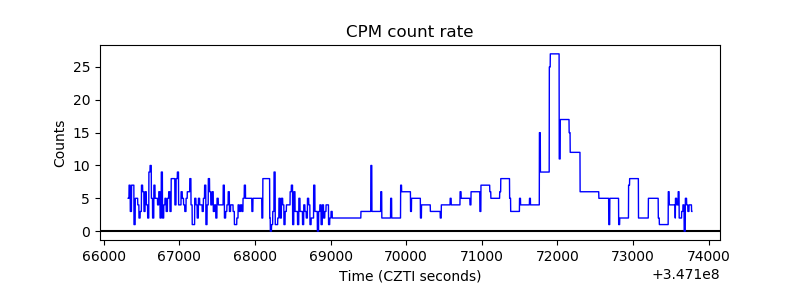 |
| CZT Counter | 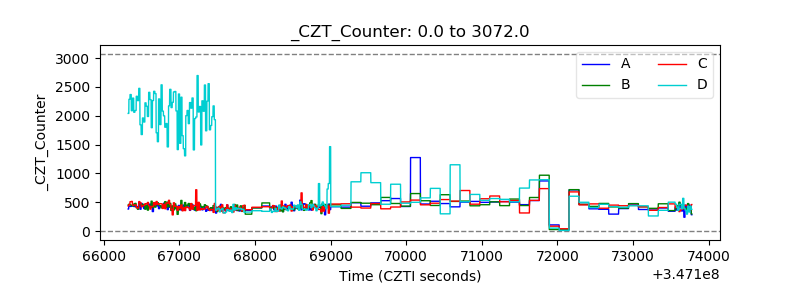 |
| +2.5 Volts monitor | 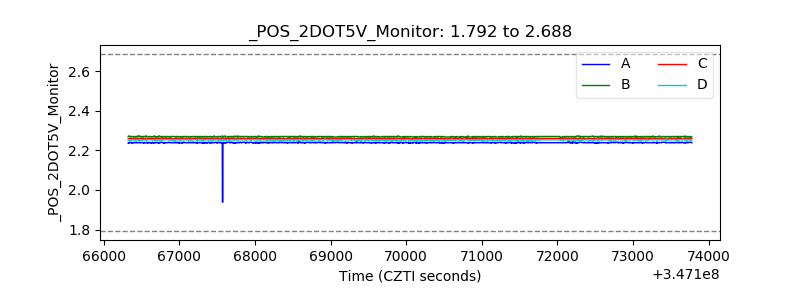 |
| +5 Volts monitor | 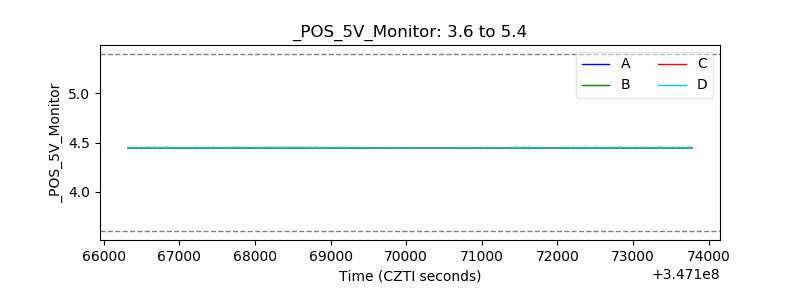 |
| _ROLL_ROT | 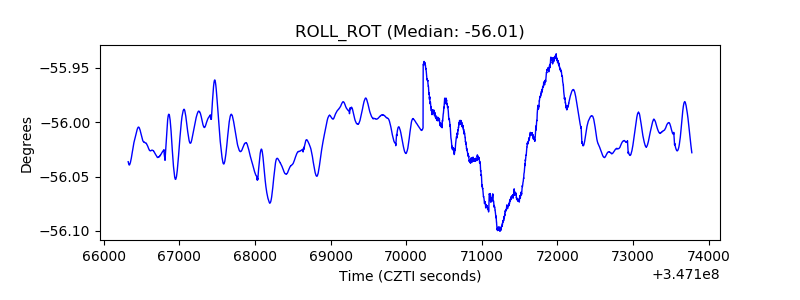 |
| _Roll_DEC | 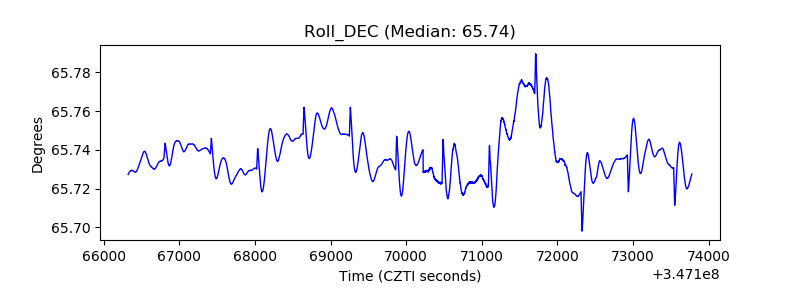 |
| _Roll_RA | 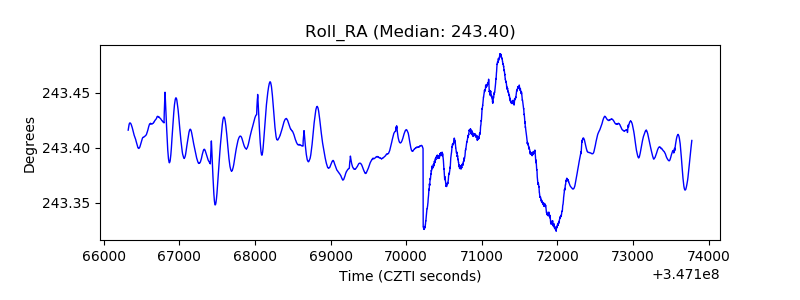 |
| Veto Counter | 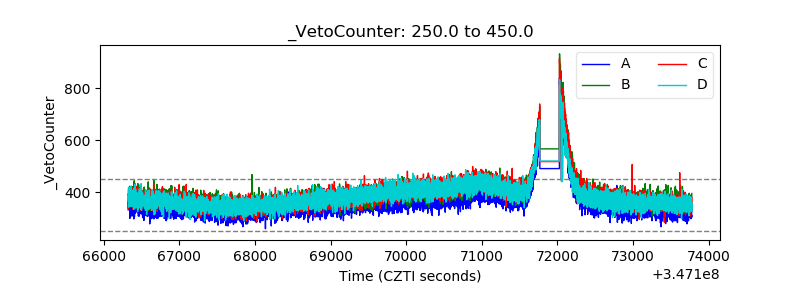 |