| Param | Original file | Final file |
|---|---|---|
| Filename | modeM0/AS1A10_101T21_9000004090_28451cztM0_level2.evt | modeM0/AS1A10_101T21_9000004090_28451cztM0_level2_quad_clean.evt |
| Size (bytes) | 872,536,320 | 219,121,920 |
| Size | 832.1 MB | 209.0 MB |
| Events in quadrant A | 5,873,206 | 1,466,489 |
| Events in quadrant B | 5,759,524 | 1,492,608 |
| Events in quadrant C | 5,837,362 | 1,433,255 |
| Events in quadrant D | 8,108,519 | 1,380,849 |
| Mode M0 | |||
|---|---|---|---|
| Quadrant | BADHDUFLAG | Total packets | Discarded packets |
| A | 0 | 26059 | 0 |
| B | 0 | 25444 | 0 |
| C | 0 | 25715 | 0 |
| D | 0 | 32580 | 0 |
| Mode M9 | |||
|---|---|---|---|
| Quadrant | BADHDUFLAG | Total packets | Discarded packets |
| A | 0 | 12 | 0 |
| B | 0 | 12 | 0 |
| C | 0 | 12 | 0 |
| D | 0 | 12 | 0 |
| Quadrant | Total seconds | Saturated seconds | Saturation percentage |
|---|---|---|---|
| A | 12495 | 88 | 0.704282% |
| B | 12496 | 68 | 0.544174% |
| C | 12496 | 103 | 0.824264% |
| D | 12496 | 489 | 3.913252% |
Noise dominated data is calculated using 1-second bins in cleaned event files. If a bin has >2000 counts, and if more than 50% of those come from <1% of pixels, then it is considered to be noise-dominated and hence unusable.
| Quadrant | # 1 sec bins | Bins with >0 counts | Bins with >2000 counts | High rate bins dominated by noise | Noise dominated (total time) | Noise dominated (detector-on time) | Marked lightcurve |
|---|---|---|---|---|---|---|---|
| A | 13700 | 12495 | 26 | 26 | 0.19% | 0.21% | 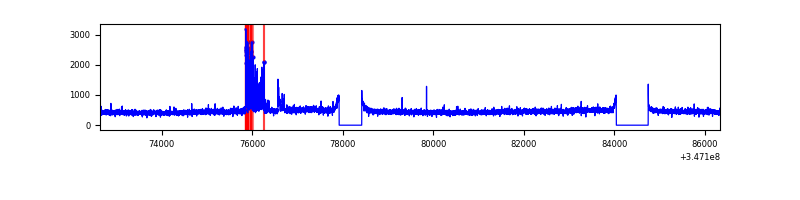 |
| B | 13701 | 12496 | 1 | 1 | 0.01% | 0.01% | 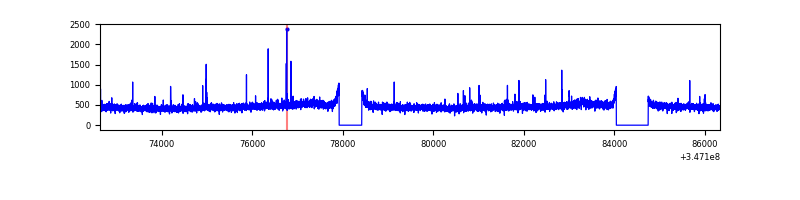 |
| C | 13701 | 12497 | 2 | 2 | 0.01% | 0.02% | 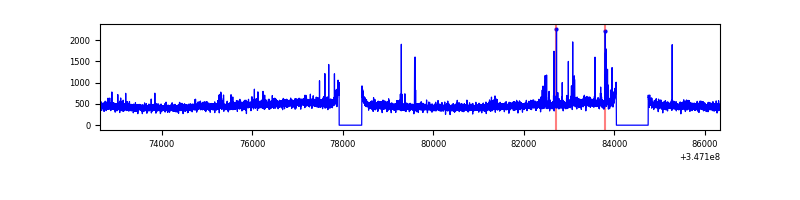 |
| D | 13700 | 12497 | 459 | 459 | 3.35% | 3.67% | 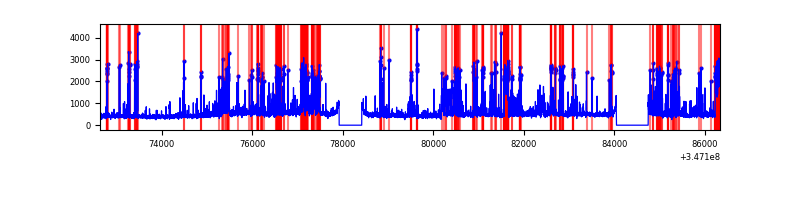 |
Top three noisy pixels from each quadrant. If the there are fewer than three noisy pixels in the level2.evt file, extra rows are filled as -1
| Pixel properties | Quadrant properties | ||||||
|---|---|---|---|---|---|---|---|
| Quadrant | DetID | PixID | Counts | Sigma | Mean | Median | Sigma |
| A | 15 | 174 | 258363 | 880.83 | 1452 | 1414 | 291.7 |
| A | 13 | 254 | 17940 | 56.65 | 1452 | 1414 | 291.7 |
| A | 3 | 137 | 14738 | 45.68 | 1452 | 1414 | 291.7 |
| B | 12 | 111 | 34792 | 120.76 | 1442 | 1402 | 276.5 |
| B | 11 | 111 | 31938 | 110.43 | 1442 | 1402 | 276.5 |
| B | 0 | 183 | 31277 | 108.04 | 1442 | 1402 | 276.5 |
| C | 14 | 238 | 226257 | 692.99 | 1394 | 1401 | 324.5 |
| C | 7 | 220 | 79811 | 241.65 | 1394 | 1401 | 324.5 |
| C | 3 | 233 | 50806 | 152.26 | 1394 | 1401 | 324.5 |
| D | 1 | 52 | 1651447 | 5033.17 | 1390 | 1350 | 327.8 |
| D | 8 | 195 | 492583 | 1498.37 | 1390 | 1350 | 327.8 |
| D | 2 | 250 | 297892 | 904.52 | 1390 | 1350 | 327.8 |
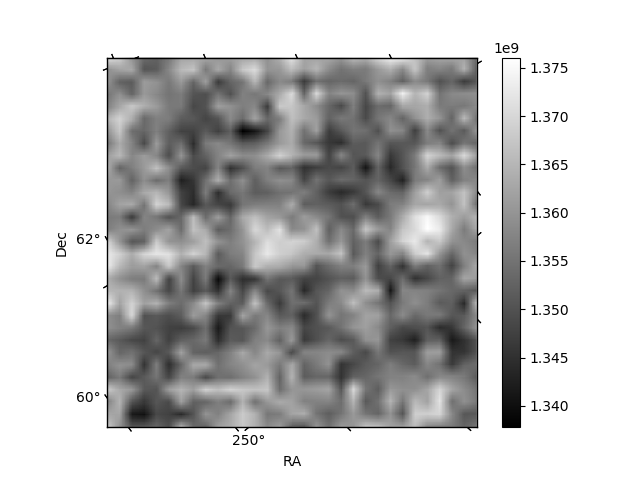
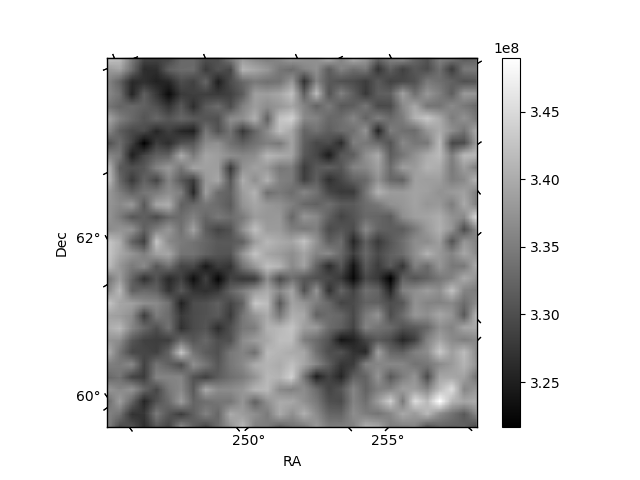
Histogram calculated using DETX and DETY for each event in the final _common_clean file
| Quadrant A | 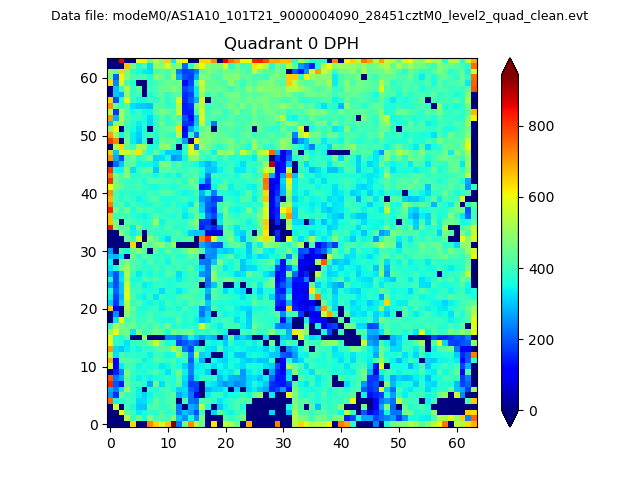 |
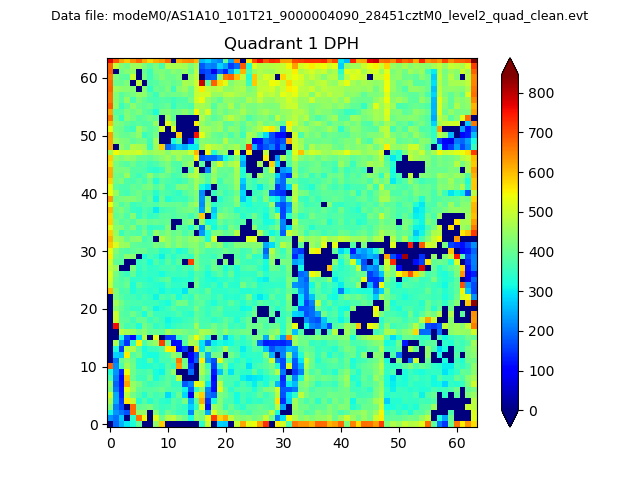 |
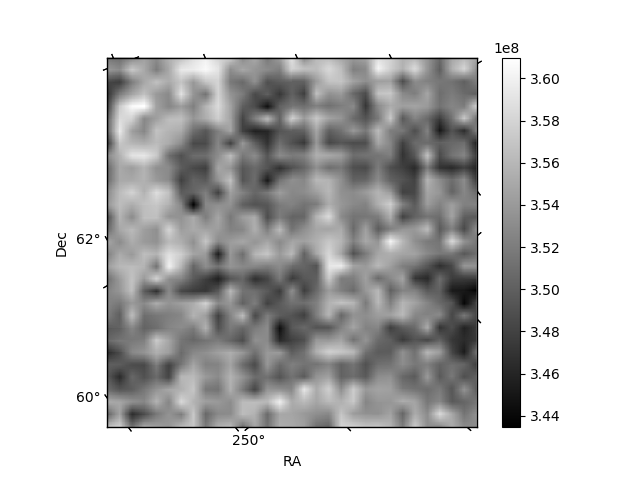
Quadrant B |
|---|---|---|---|
| Quadrant D | 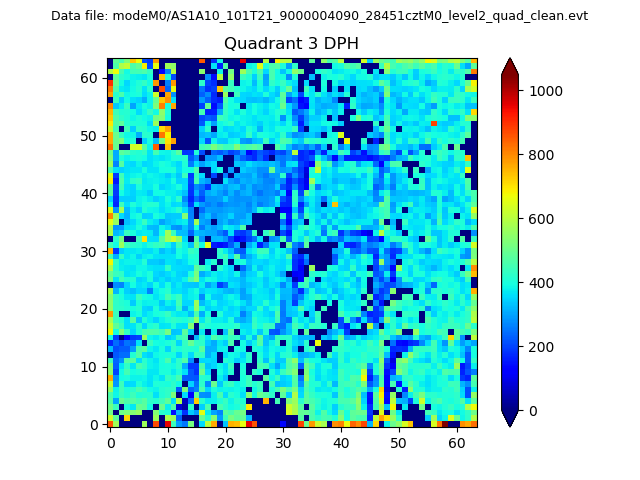 |
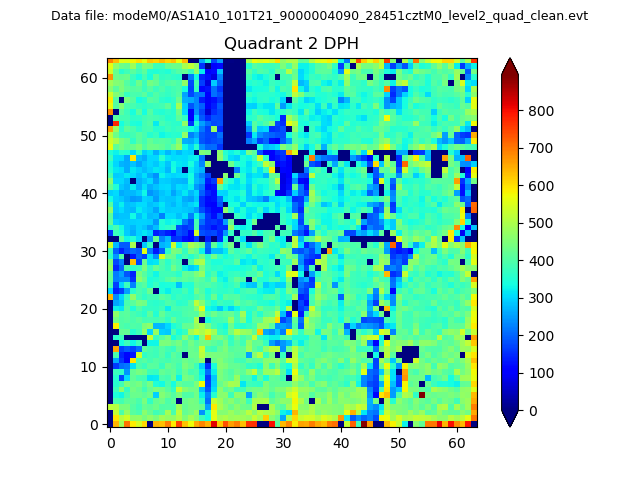 |
Quadrant C |
| Plot type | Count rate plots | Images |
|---|---|---|
| Comparison with Poisson distribution Blue bars denote a histogram of data divided into 1 sec bins. Red curve is a Poisson curve with rate = median count rate of data. |
 |
 |
| Quadrant-wise count rates Data is divided into 100 sec bins |
 |
|
| Module-wise count rates for Quadrant A Data is divided into 100 sec bins |
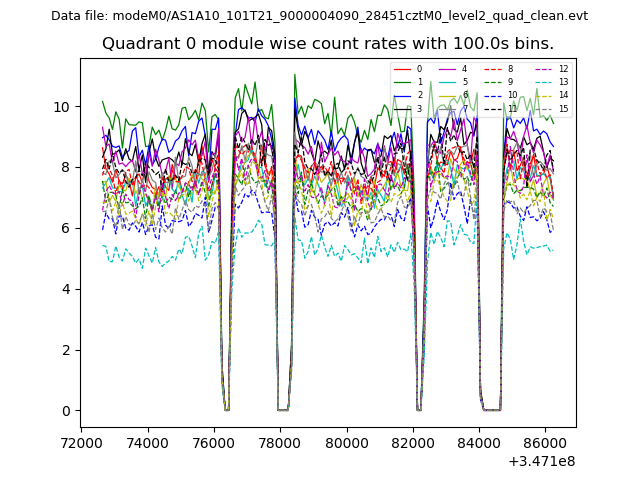 |
 |
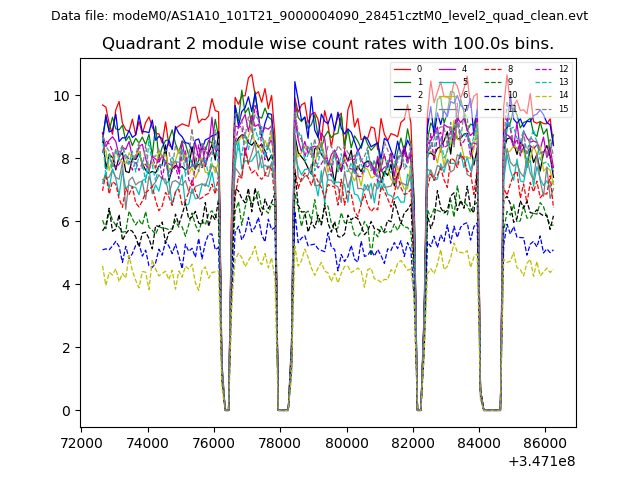
| Module-wise count rates for Quadrant B Data is divided into 100 sec bins |
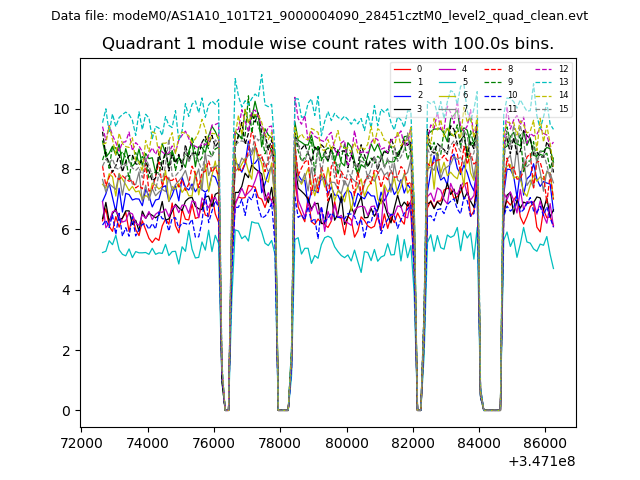 |
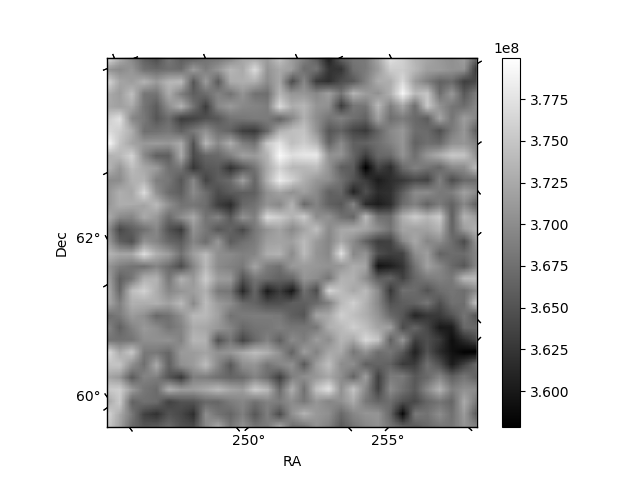 |
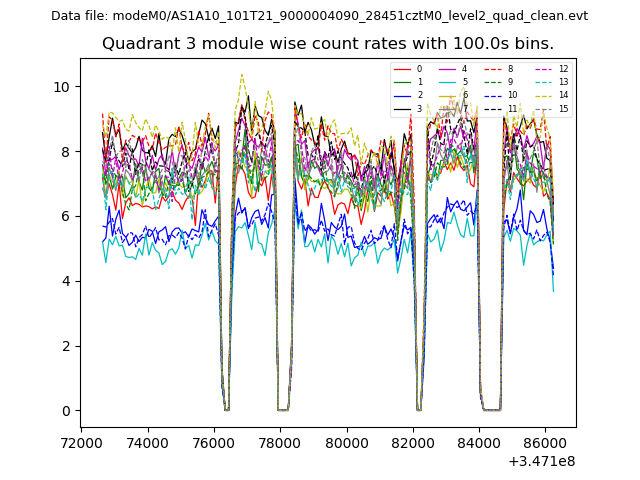
| Module-wise count rates for Quadrant C Data is divided into 100 sec bins |
 |
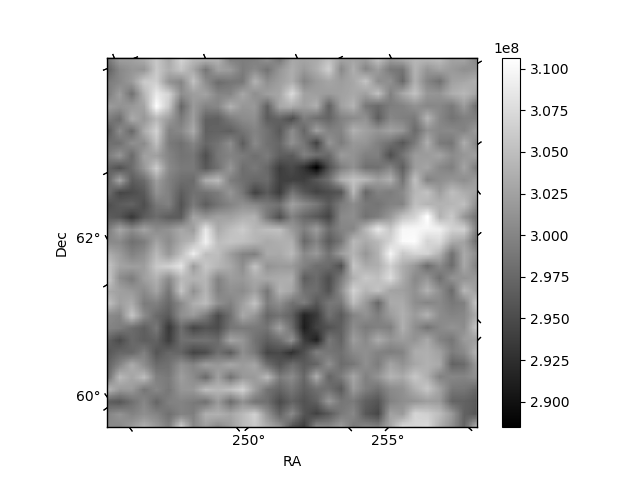 |
| Module-wise count rates for Quadrant D Data is divided into 100 sec bins |
 |
 |
| Parameter | Plot |
|---|---|
| CZT HV Monitor | 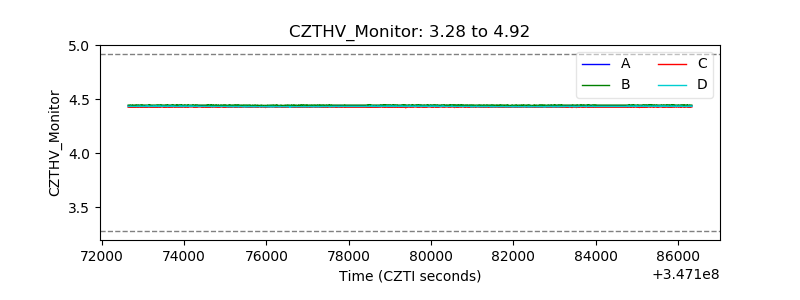 |
| D_VDD | 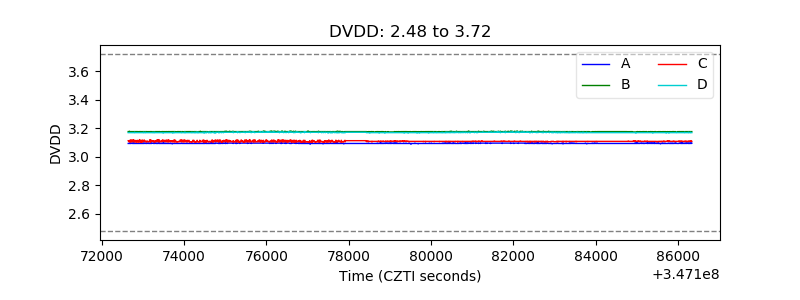 |
| Temperature 1 | 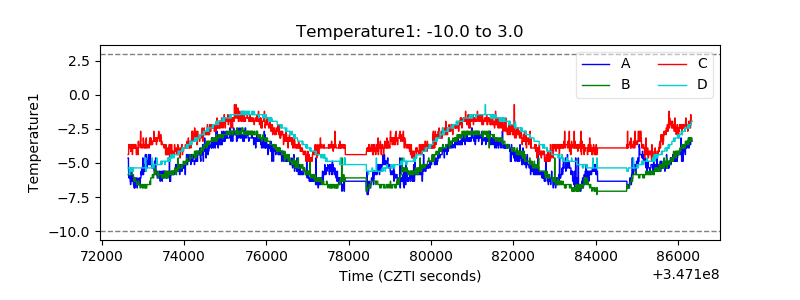 |
| Veto HV Monitor | 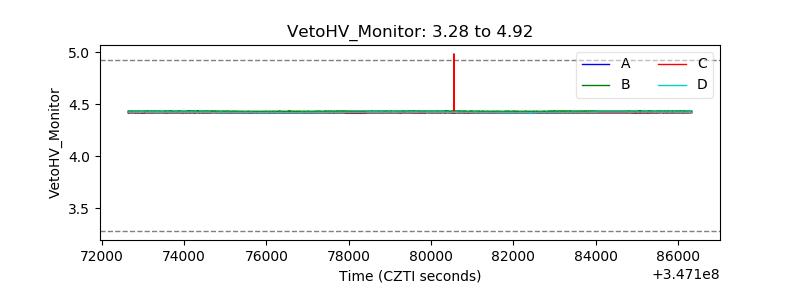 |
| Veto LLD | 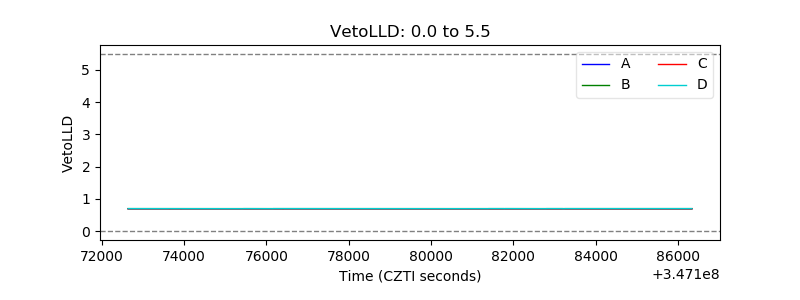 |
| Alpha Counter |  |
| _CPM_Rate | 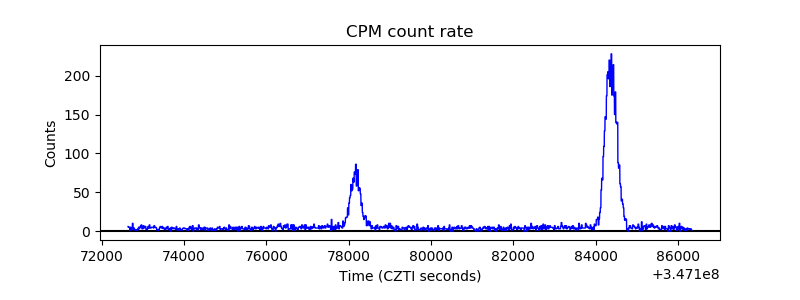 |
| CZT Counter | 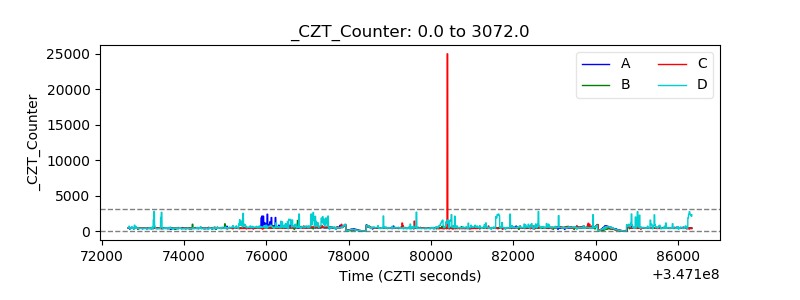 |
| +2.5 Volts monitor |  |
| +5 Volts monitor |  |
| _ROLL_ROT | 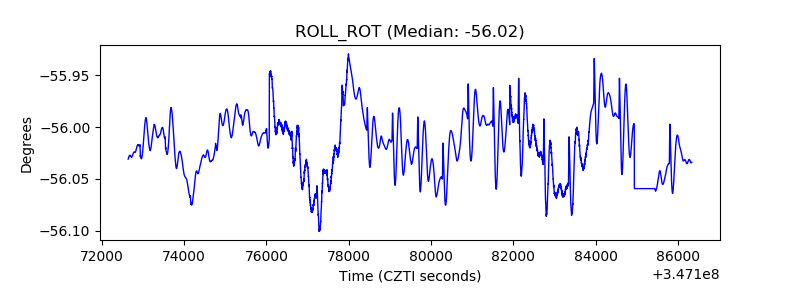 |
| _Roll_DEC | 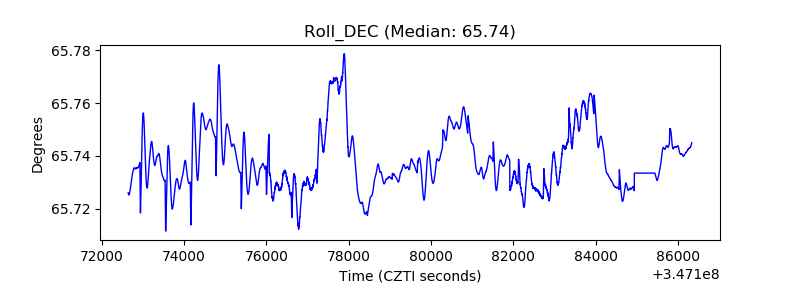 |
| _Roll_RA | 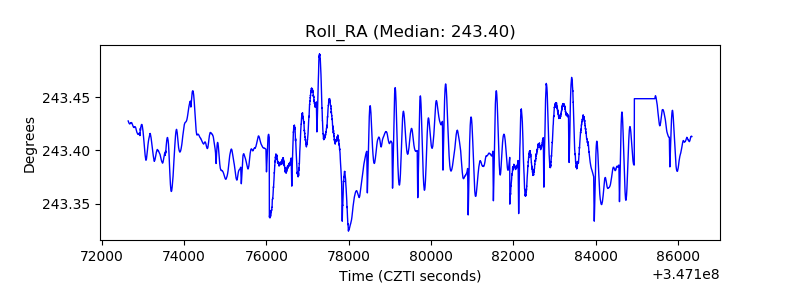 |
| Veto Counter | 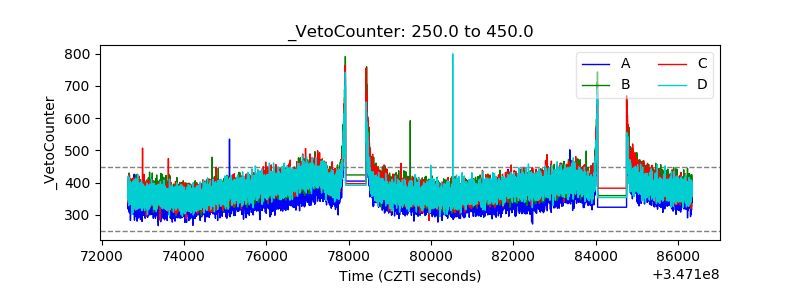 |