| Param | Original file | Final file |
|---|---|---|
| Filename | modeM0/AS1A10_101T21_9000004090_28452cztM0_level2.evt | modeM0/AS1A10_101T21_9000004090_28452cztM0_level2_quad_clean.evt |
| Size (bytes) | 588,525,120 | 113,235,840 |
| Size | 561.3 MB | 108.0 MB |
| Events in quadrant A | 2,959,357 | 779,530 |
| Events in quadrant B | 2,994,231 | 790,676 |
| Events in quadrant C | 3,005,810 | 755,033 |
| Events in quadrant D | 8,428,390 | 655,559 |
| Mode M0 | |||
|---|---|---|---|
| Quadrant | BADHDUFLAG | Total packets | Discarded packets |
| A | 0 | 13070 | 0 |
| B | 0 | 13065 | 0 |
| C | 0 | 13133 | 0 |
| D | 0 | 29235 | 0 |
| Mode M9 | |||
|---|---|---|---|
| Quadrant | BADHDUFLAG | Total packets | Discarded packets |
| A | 0 | 8 | 0 |
| B | 0 | 8 | 0 |
| C | 0 | 8 | 0 |
| D | 0 | 8 | 0 |
| Quadrant | Total seconds | Saturated seconds | Saturation percentage |
|---|---|---|---|
| A | 6420 | 40 | 0.623053% |
| B | 6420 | 33 | 0.514019% |
| C | 6421 | 61 | 0.950008% |
| D | 6421 | 2234 | 34.792088% |
Noise dominated data is calculated using 1-second bins in cleaned event files. If a bin has >2000 counts, and if more than 50% of those come from <1% of pixels, then it is considered to be noise-dominated and hence unusable.
| Quadrant | # 1 sec bins | Bins with >0 counts | Bins with >2000 counts | High rate bins dominated by noise | Noise dominated (total time) | Noise dominated (detector-on time) | Marked lightcurve |
|---|---|---|---|---|---|---|---|
| A | 7255 | 6420 | 2 | 2 | 0.03% | 0.03% | 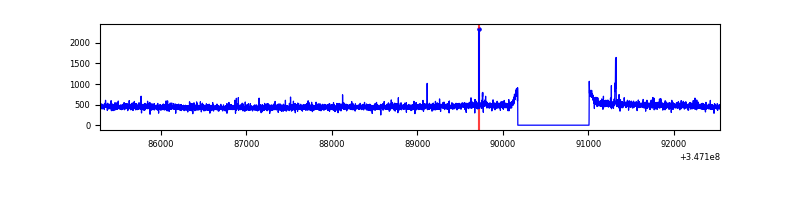 |
| B | 7255 | 6421 | 1 | 1 | 0.01% | 0.02% | 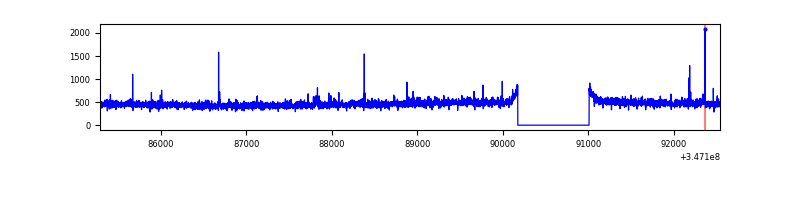 |
| C | 7256 | 6422 | 2 | 2 | 0.03% | 0.03% | 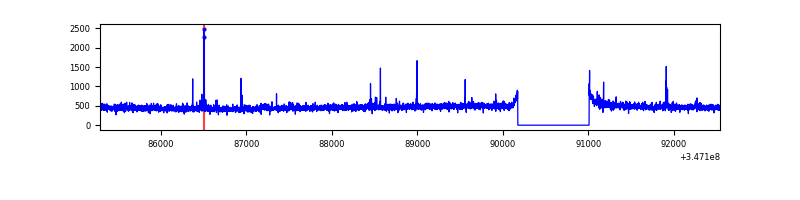 |
| D | 7255 | 6420 | 2206 | 2206 | 30.41% | 34.36% | 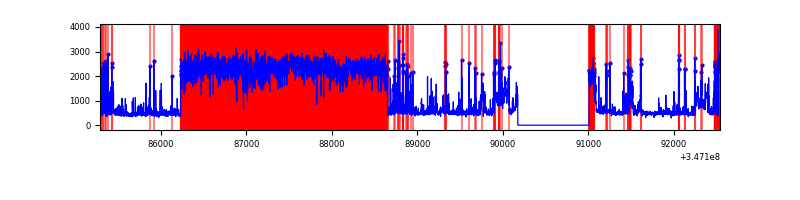 |
Top three noisy pixels from each quadrant. If the there are fewer than three noisy pixels in the level2.evt file, extra rows are filled as -1
| Pixel properties | Quadrant properties | ||||||
|---|---|---|---|---|---|---|---|
| Quadrant | DetID | PixID | Counts | Sigma | Mean | Median | Sigma |
| A | 4 | 2 | 22121 | 140.77 | 758 | 741 | 151.9 |
| A | 15 | 174 | 9770 | 59.45 | 758 | 741 | 151.9 |
| A | 13 | 254 | 8822 | 53.21 | 758 | 741 | 151.9 |
| B | 12 | 111 | 17902 | 119.03 | 749 | 729 | 144.3 |
| B | 11 | 111 | 16624 | 110.18 | 749 | 729 | 144.3 |
| B | 14 | 111 | 15168 | 100.08 | 749 | 729 | 144.3 |
| C | 14 | 238 | 116207 | 689.91 | 722 | 726 | 167.4 |
| C | 7 | 220 | 62899 | 371.44 | 722 | 726 | 167.4 |
| C | 3 | 233 | 12213 | 68.63 | 722 | 726 | 167.4 |
| D | 8 | 195 | 4075273 | 25856.63 | 661 | 642 | 157.6 |
| D | 1 | 52 | 1545625 | 9804.09 | 661 | 642 | 157.6 |
| D | 13 | 104 | 153812 | 971.98 | 661 | 642 | 157.6 |
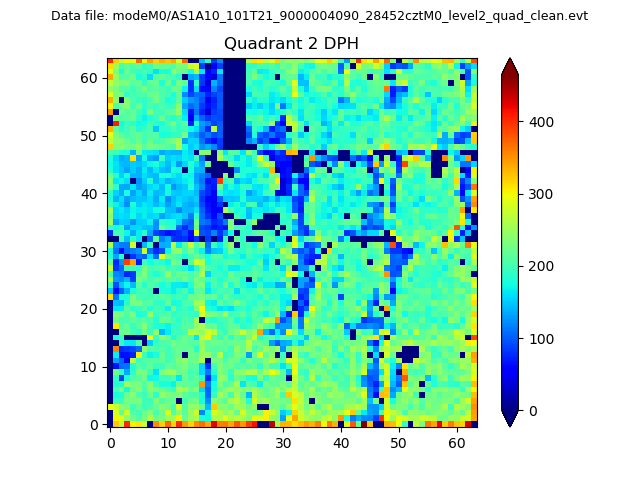
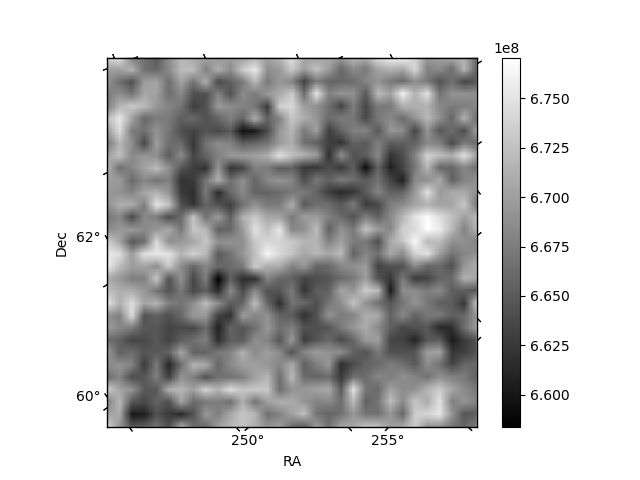
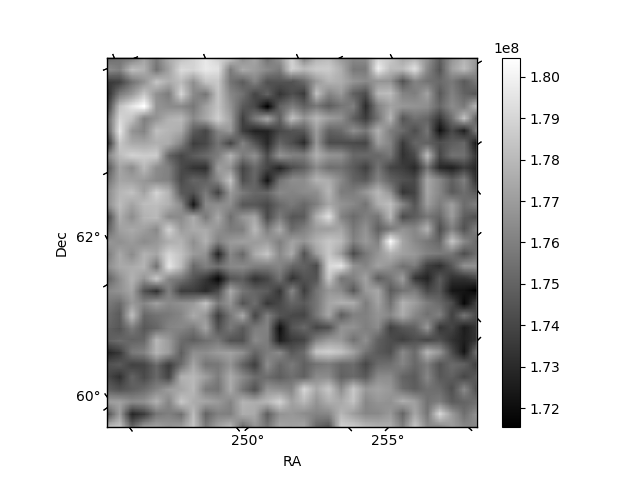
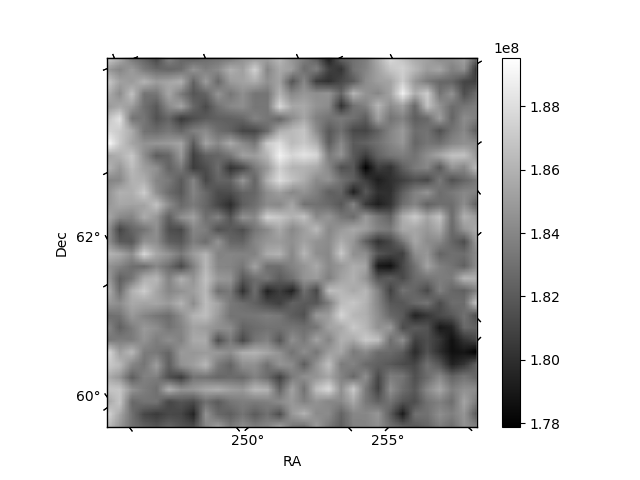
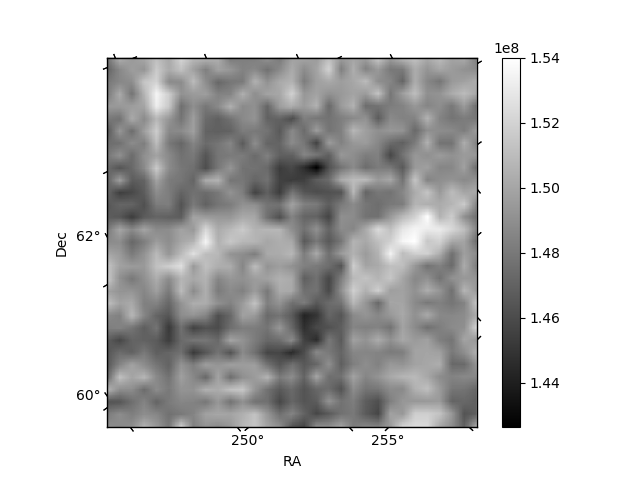
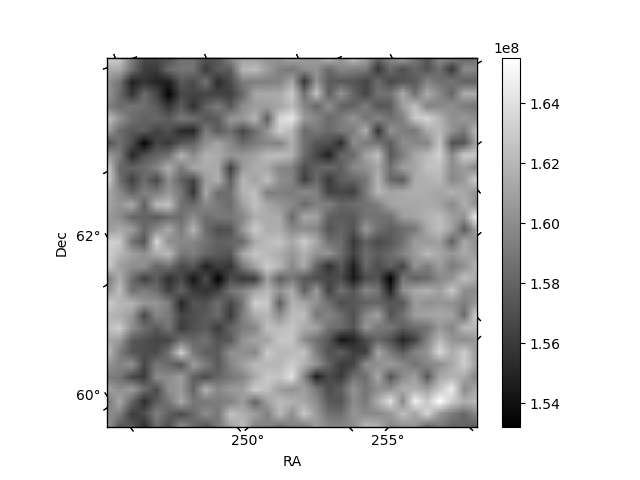
Histogram calculated using DETX and DETY for each event in the final _common_clean file
| Quadrant A | 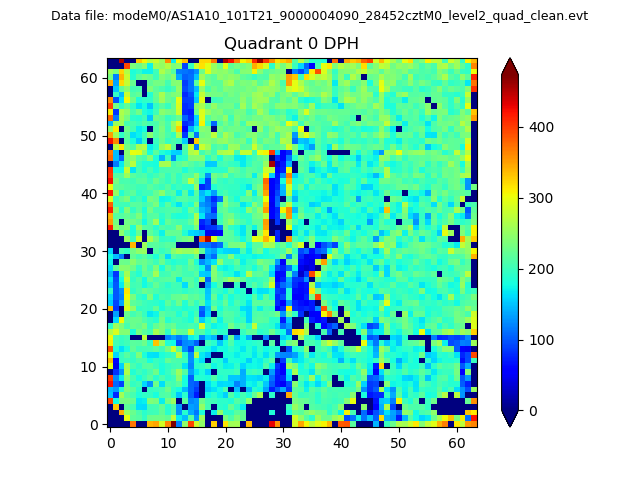 |
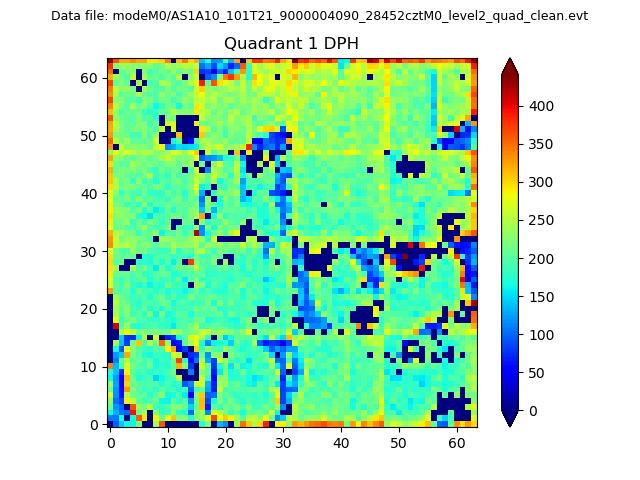 |
Quadrant B |
|---|---|---|---|
| Quadrant D | 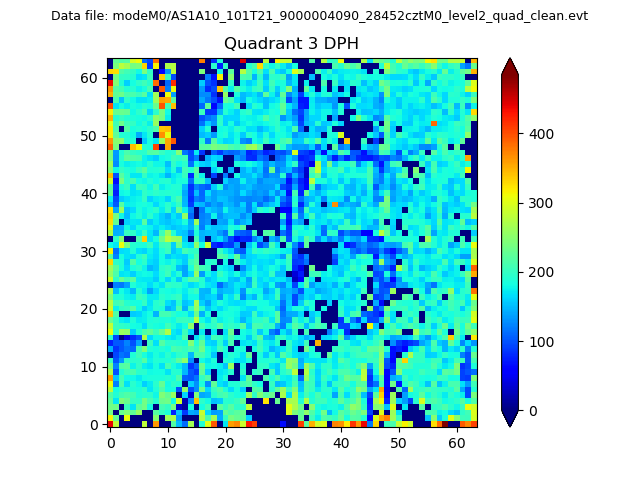 |
 |
Quadrant C |
| Plot type | Count rate plots | Images |
|---|---|---|
| Comparison with Poisson distribution Blue bars denote a histogram of data divided into 1 sec bins. Red curve is a Poisson curve with rate = median count rate of data. |
 |
 |
| Quadrant-wise count rates Data is divided into 100 sec bins |
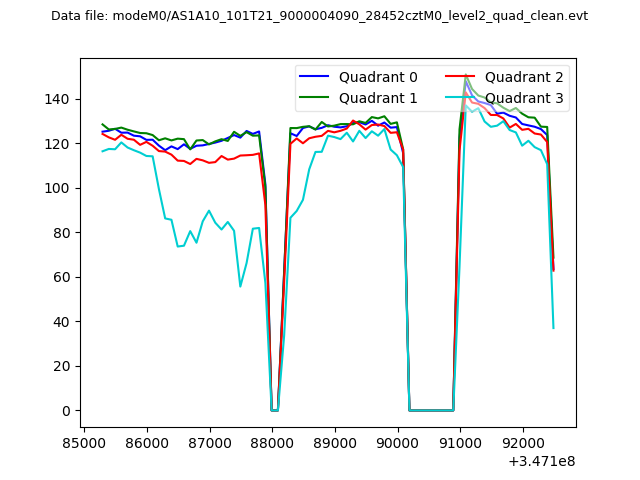 |
|
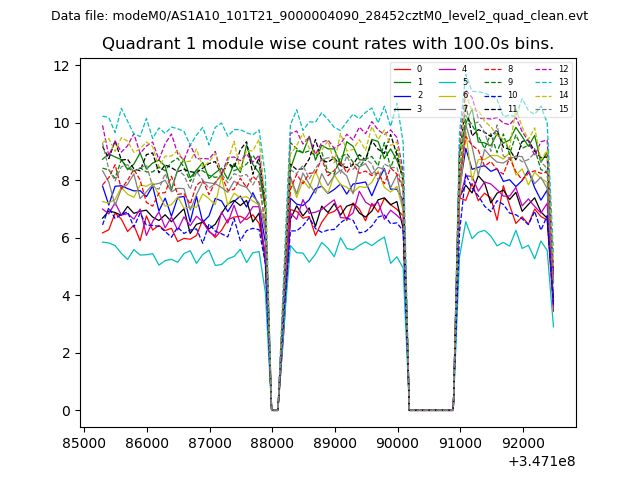
| Module-wise count rates for Quadrant A Data is divided into 100 sec bins |
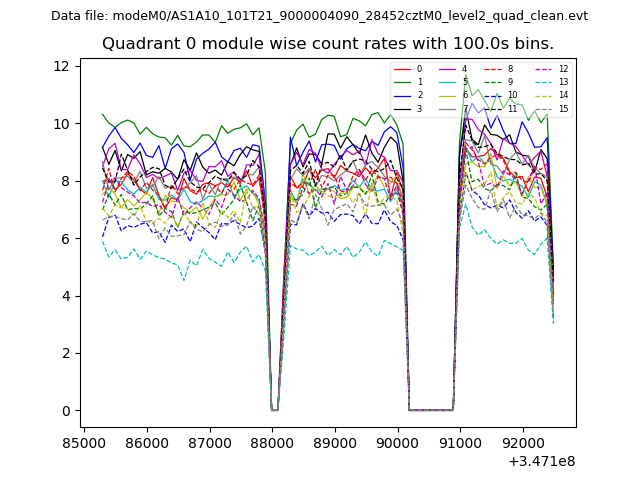 |
 |
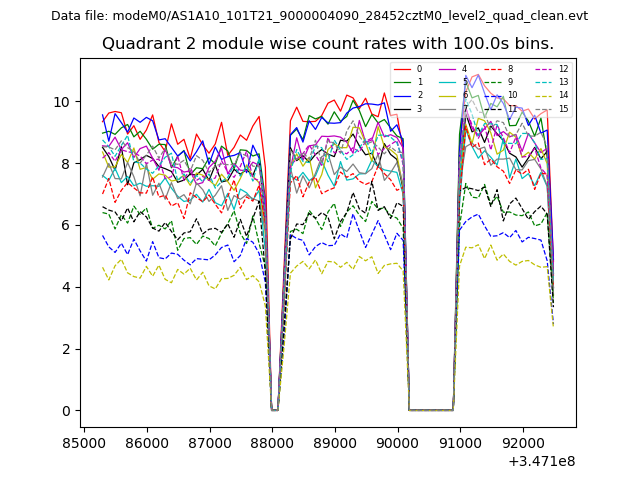
| Module-wise count rates for Quadrant B Data is divided into 100 sec bins |
 |
 |
| Module-wise count rates for Quadrant C Data is divided into 100 sec bins |
 |
 |
| Module-wise count rates for Quadrant D Data is divided into 100 sec bins |
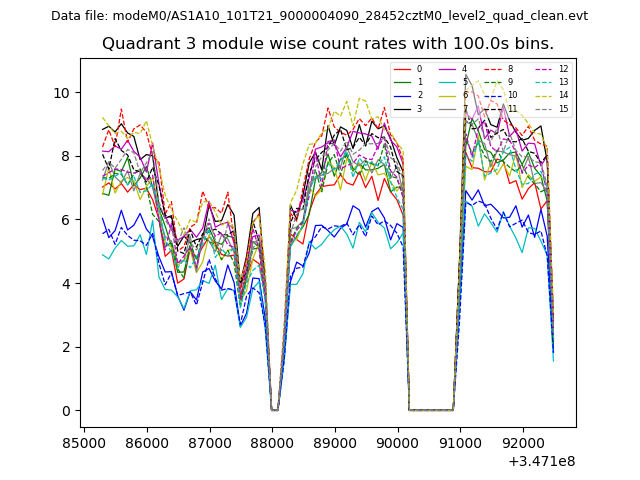 |
 |
| Parameter | Plot |
|---|---|
| CZT HV Monitor | 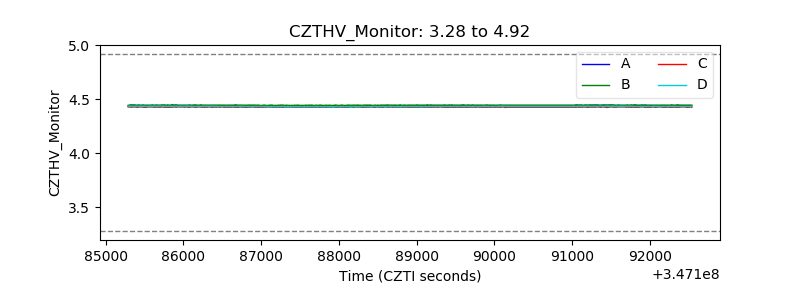 |
| D_VDD | 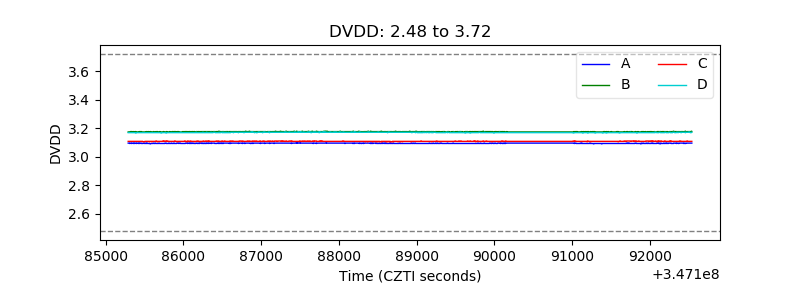 |
| Temperature 1 | 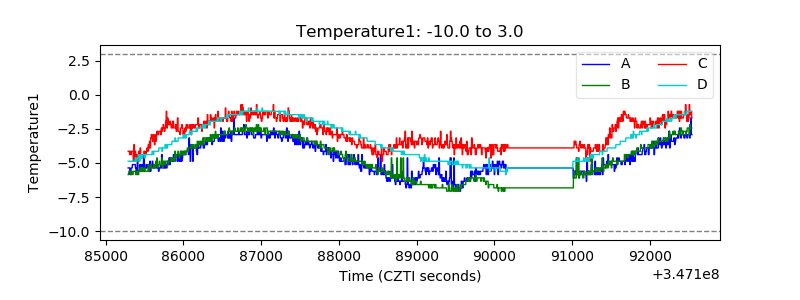 |
| Veto HV Monitor | 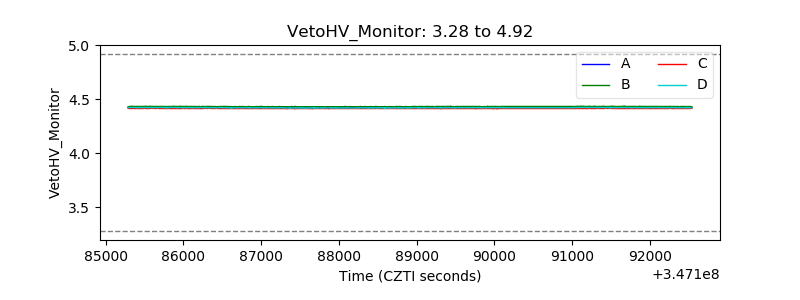 |
| Veto LLD | 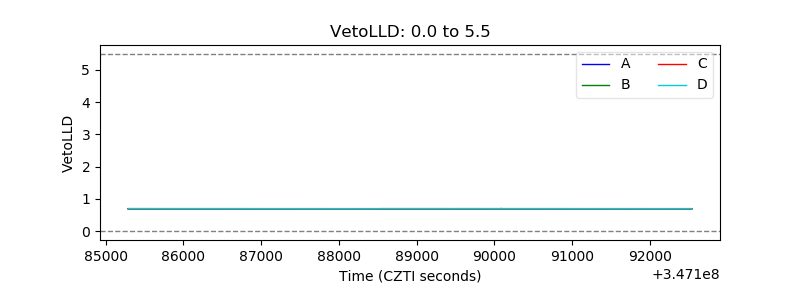 |
| Alpha Counter |  |
| _CPM_Rate |  |
| CZT Counter | 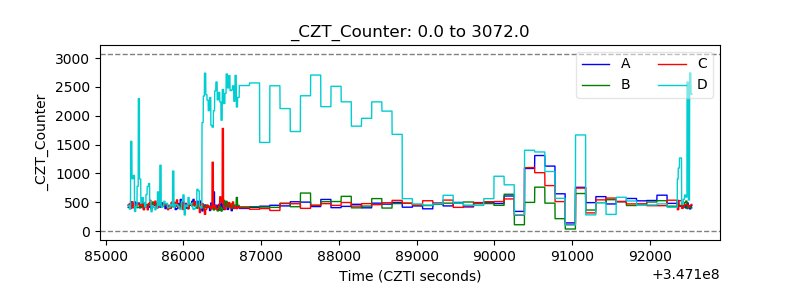 |
| +2.5 Volts monitor |  |
| +5 Volts monitor |  |
| _ROLL_ROT | 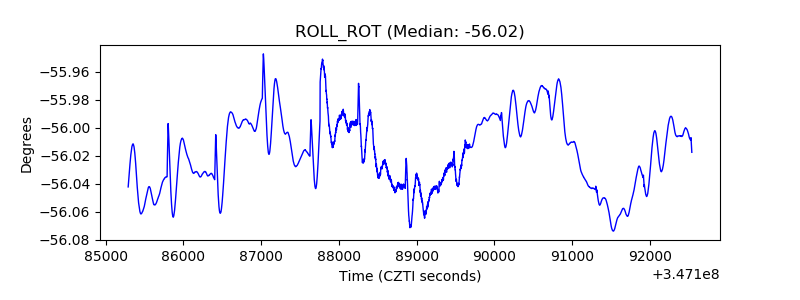 |
| _Roll_DEC | 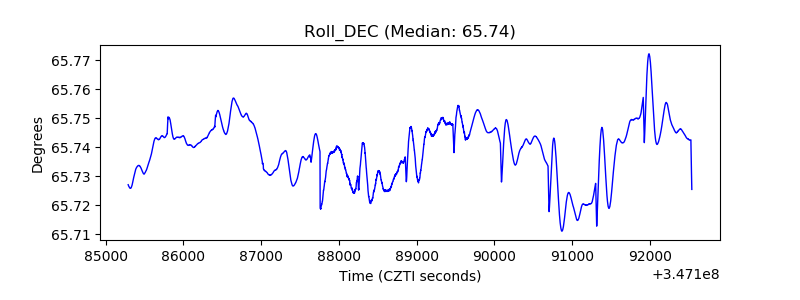 |
| _Roll_RA | 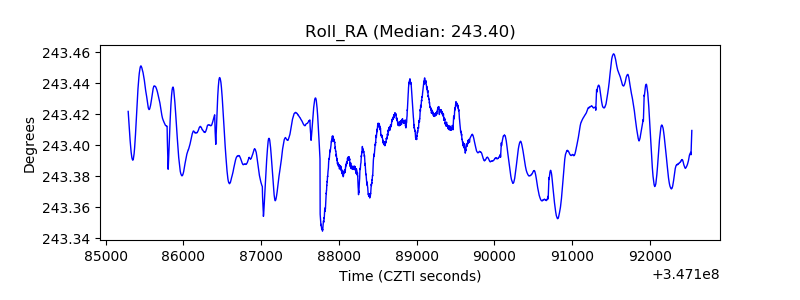 |
| Veto Counter | 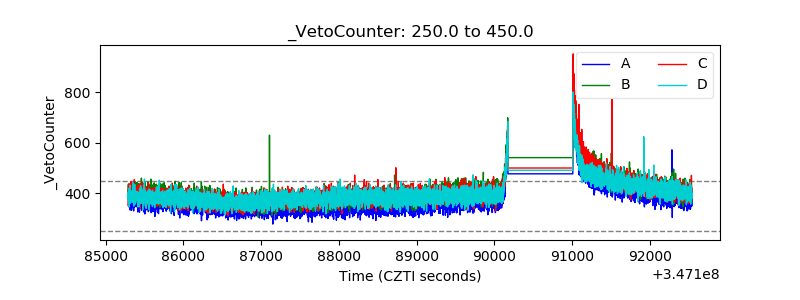 |