| Param | Original file | Final file |
|---|---|---|
| Filename | modeM0/AS1A10_101T21_9000004090_28453cztM0_level2.evt | modeM0/AS1A10_101T21_9000004090_28453cztM0_level2_quad_clean.evt |
| Size (bytes) | 536,132,160 | 115,776,000 |
| Size | 511.3 MB | 110.4 MB |
| Events in quadrant A | 2,961,709 | 799,248 |
| Events in quadrant B | 3,018,056 | 810,317 |
| Events in quadrant C | 3,654,544 | 763,411 |
| Events in quadrant D | 6,175,291 | 693,818 |
| Mode M0 | |||
|---|---|---|---|
| Quadrant | BADHDUFLAG | Total packets | Discarded packets |
| A | 0 | 12889 | 0 |
| B | 0 | 12977 | 0 |
| C | 0 | 14840 | 0 |
| D | 0 | 22400 | 0 |
| Mode M9 | |||
|---|---|---|---|
| Quadrant | BADHDUFLAG | Total packets | Discarded packets |
| A | 0 | 10 | 0 |
| B | 0 | 10 | 0 |
| C | 0 | 10 | 0 |
| D | 0 | 10 | 0 |
| Quadrant | Total seconds | Saturated seconds | Saturation percentage |
|---|---|---|---|
| A | 6292 | 46 | 0.731087% |
| B | 6293 | 42 | 0.667408% |
| C | 6293 | 401 | 6.372160% |
| D | 6293 | 1035 | 16.446846% |
Noise dominated data is calculated using 1-second bins in cleaned event files. If a bin has >2000 counts, and if more than 50% of those come from <1% of pixels, then it is considered to be noise-dominated and hence unusable.
| Quadrant | # 1 sec bins | Bins with >0 counts | Bins with >2000 counts | High rate bins dominated by noise | Noise dominated (total time) | Noise dominated (detector-on time) | Marked lightcurve |
|---|---|---|---|---|---|---|---|
| A | 7292 | 6292 | 2 | 2 | 0.03% | 0.03% |  |
| B | 7293 | 6293 | 3 | 3 | 0.04% | 0.05% |  |
| C | 7293 | 6293 | 191 | 191 | 2.62% | 3.04% |  |
| D | 7293 | 6293 | 996 | 996 | 13.66% | 15.83% | 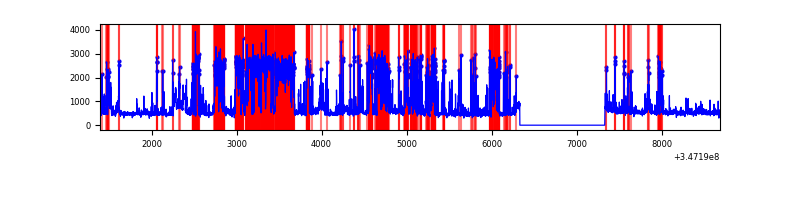 |
Top three noisy pixels from each quadrant. If the there are fewer than three noisy pixels in the level2.evt file, extra rows are filled as -1
| Pixel properties | Quadrant properties | ||||||
|---|---|---|---|---|---|---|---|
| Quadrant | DetID | PixID | Counts | Sigma | Mean | Median | Sigma |
| A | 4 | 2 | 10016 | 60.43 | 763 | 747 | 153.4 |
| A | 13 | 254 | 9747 | 58.68 | 763 | 747 | 153.4 |
| A | 3 | 137 | 7401 | 43.38 | 763 | 747 | 153.4 |
| B | 12 | 111 | 17656 | 118.93 | 750 | 731 | 142.3 |
| B | 15 | 222 | 17011 | 114.39 | 750 | 731 | 142.3 |
| B | 5 | 255 | 16402 | 110.11 | 750 | 731 | 142.3 |
| C | 3 | 233 | 721184 | 4336.98 | 719 | 722 | 166.1 |
| C | 14 | 238 | 116030 | 694.12 | 719 | 722 | 166.1 |
| C | 7 | 220 | 17386 | 100.31 | 719 | 722 | 166.1 |
| D | 1 | 52 | 2759407 | 16533.66 | 689 | 670 | 166.9 |
| D | 8 | 195 | 383784 | 2296.08 | 689 | 670 | 166.9 |
| D | 2 | 250 | 246658 | 1474.26 | 689 | 670 | 166.9 |
Histogram calculated using DETX and DETY for each event in the final _common_clean file
| Quadrant A | 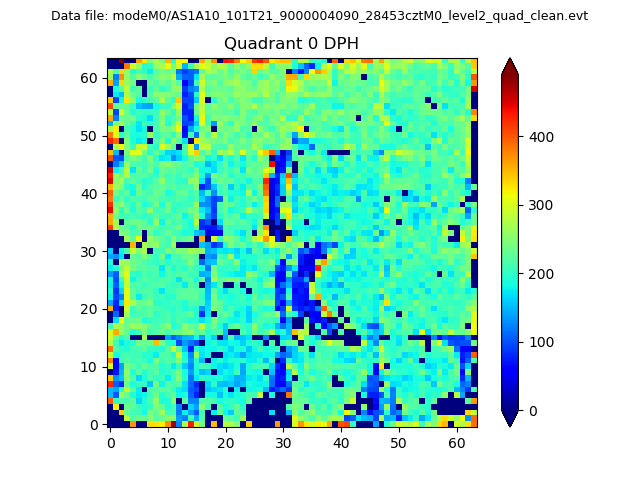 |
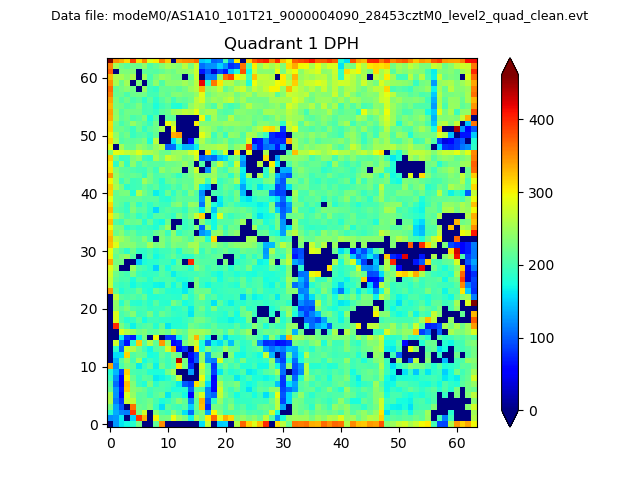 |
Quadrant B |
|---|---|---|---|
| Quadrant D |  |
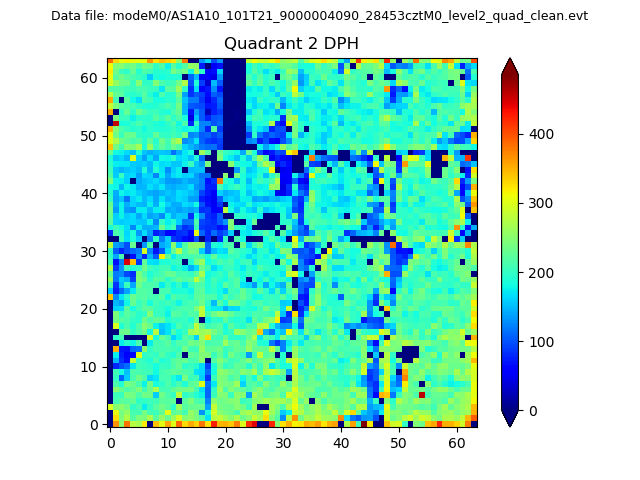 |
Quadrant C |
| Plot type | Count rate plots | Images |
|---|---|---|
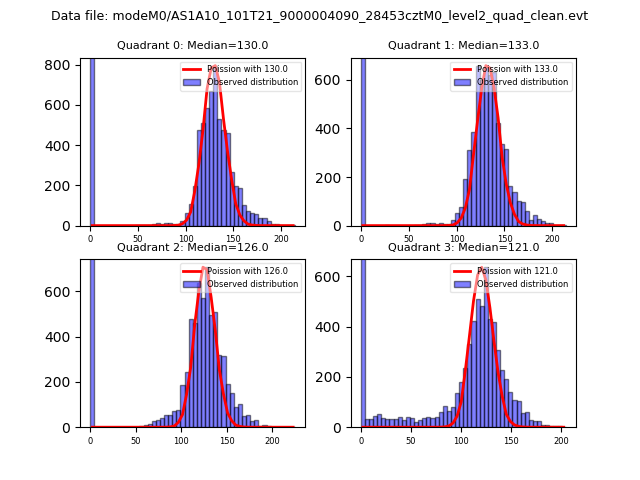
| Comparison with Poisson distribution Blue bars denote a histogram of data divided into 1 sec bins. Red curve is a Poisson curve with rate = median count rate of data. |
 |
 |
| Quadrant-wise count rates Data is divided into 100 sec bins |
 |
|
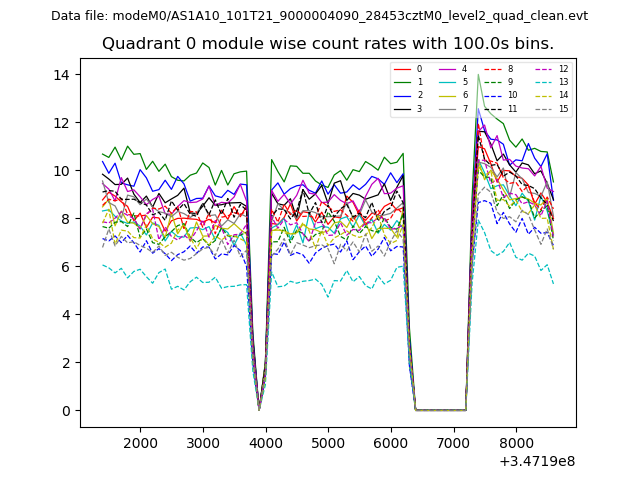
| Module-wise count rates for Quadrant A Data is divided into 100 sec bins |
 |
 |
| Module-wise count rates for Quadrant B Data is divided into 100 sec bins |
 |
 |
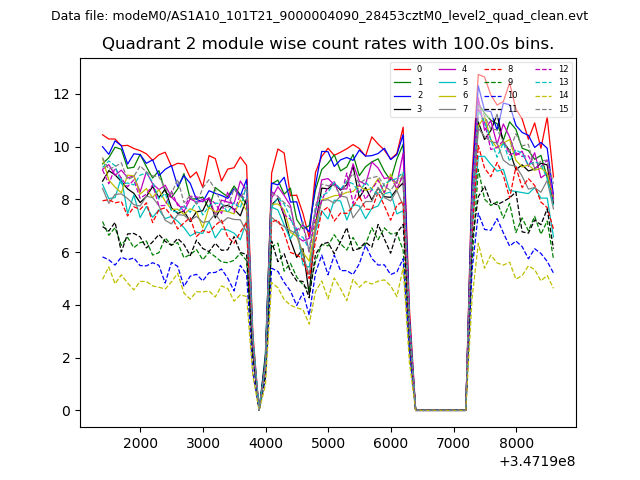
| Module-wise count rates for Quadrant C Data is divided into 100 sec bins |
 |
 |
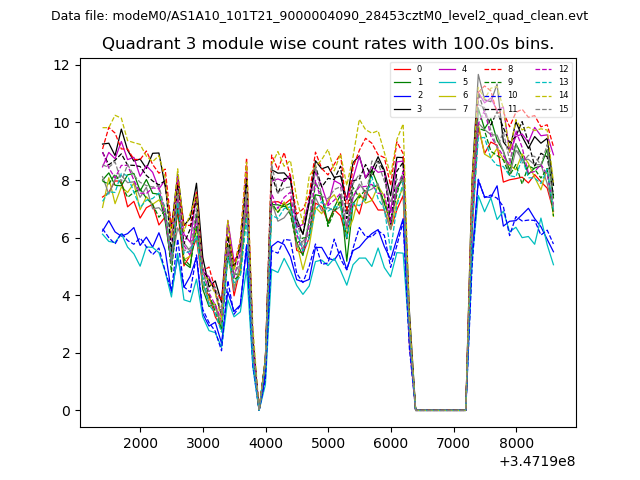
| Module-wise count rates for Quadrant D Data is divided into 100 sec bins |
 |
 |
| Parameter | Plot |
|---|---|
| CZT HV Monitor | 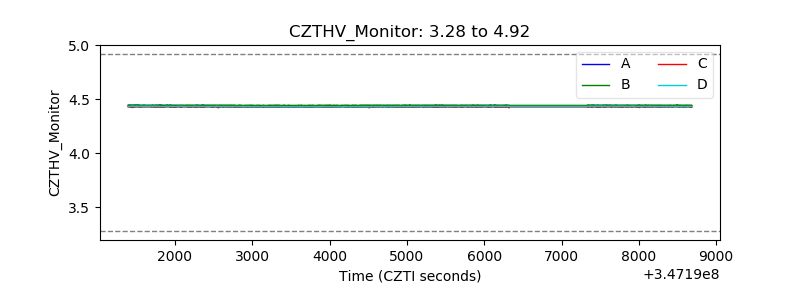 |
| D_VDD | 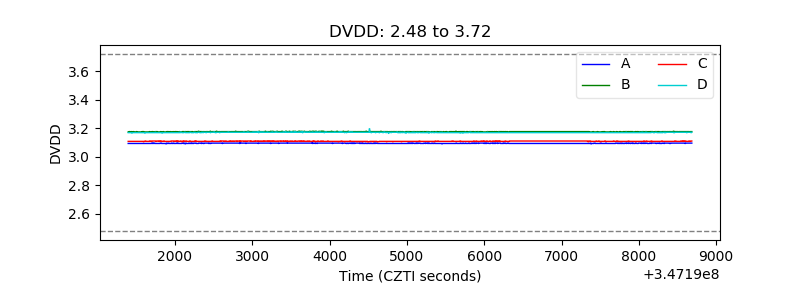 |
| Temperature 1 | 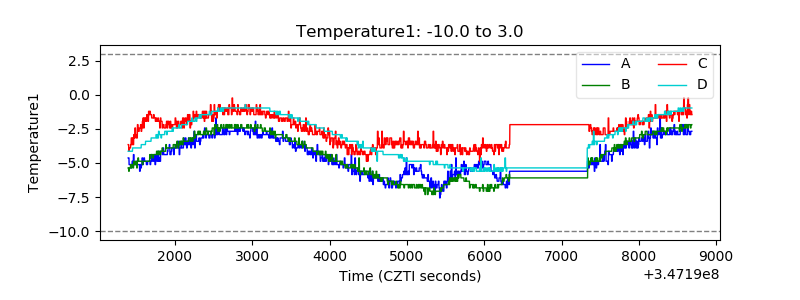 |
| Veto HV Monitor | 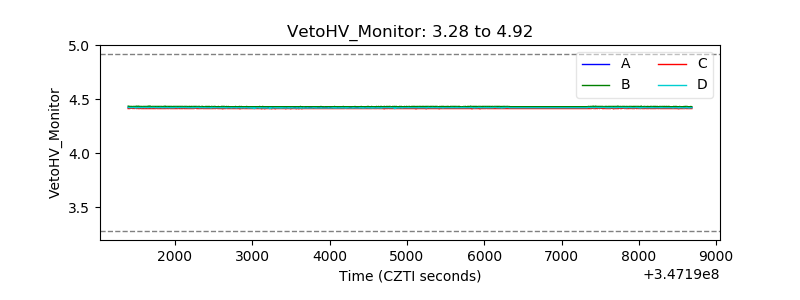 |
| Veto LLD | 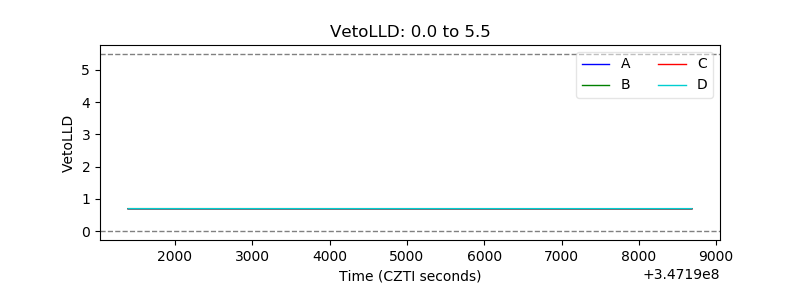 |
| Alpha Counter |  |
| _CPM_Rate | 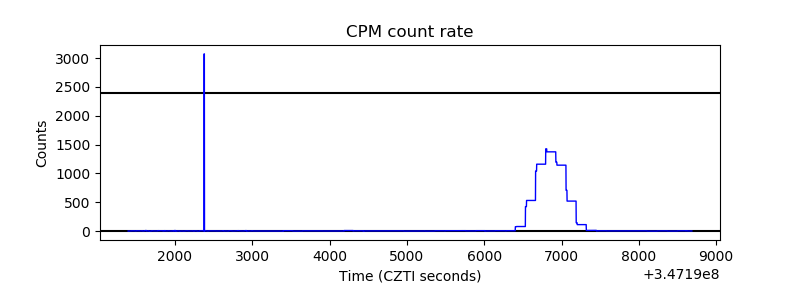 |
| CZT Counter | 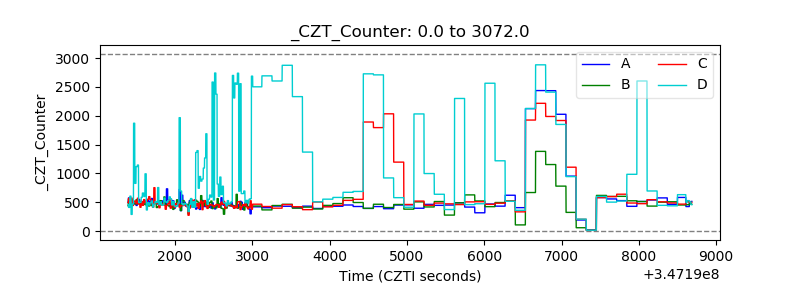 |
| +2.5 Volts monitor |  |
| +5 Volts monitor |  |
| _ROLL_ROT | 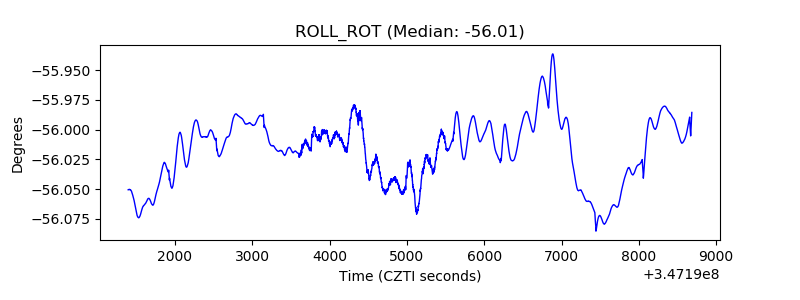 |
| _Roll_DEC | 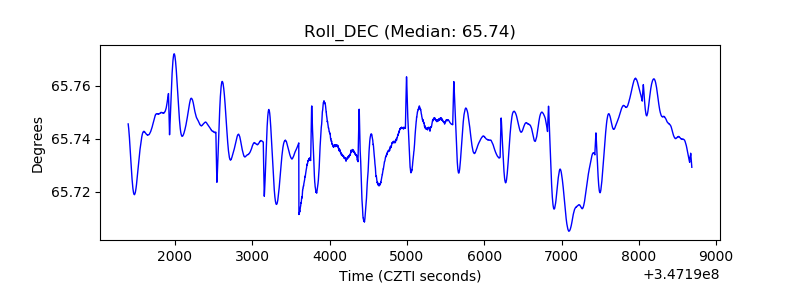 |
| _Roll_RA | 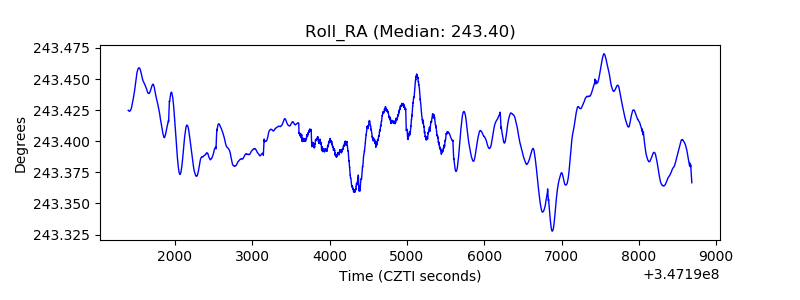 |
| Veto Counter | 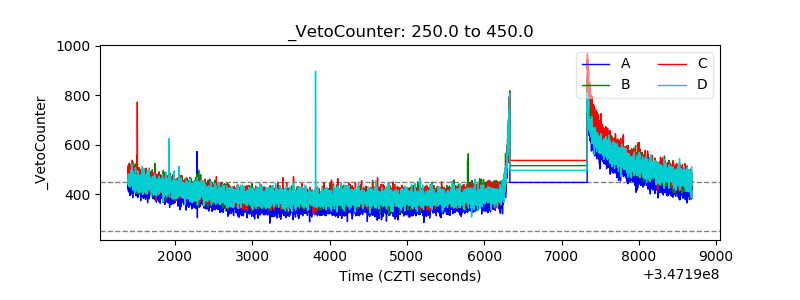 |