| Param | Original file | Final file |
|---|---|---|
| Filename | modeM0/AS1A10_101T21_9000004090_28455cztM0_level2.evt | modeM0/AS1A10_101T21_9000004090_28455cztM0_level2_quad_clean.evt |
| Size (bytes) | 491,316,480 | 120,769,920 |
| Size | 468.6 MB | 115.2 MB |
| Events in quadrant A | 2,989,499 | 831,754 |
| Events in quadrant B | 3,025,433 | 841,147 |
| Events in quadrant C | 3,118,944 | 806,932 |
| Events in quadrant D | 5,330,547 | 750,827 |
| Mode M0 | |||
|---|---|---|---|
| Quadrant | BADHDUFLAG | Total packets | Discarded packets |
| A | 0 | 12826 | 0 |
| B | 0 | 12855 | 0 |
| C | 0 | 13143 | 0 |
| D | 0 | 19894 | 0 |
| Mode M9 | |||
|---|---|---|---|
| Quadrant | BADHDUFLAG | Total packets | Discarded packets |
| A | 0 | 12 | 0 |
| B | 0 | 12 | 0 |
| C | 0 | 12 | 0 |
| D | 0 | 12 | 0 |
| Quadrant | Total seconds | Saturated seconds | Saturation percentage |
|---|---|---|---|
| A | 6115 | 40 | 0.654129% |
| B | 6116 | 36 | 0.588620% |
| C | 6115 | 90 | 1.471791% |
| D | 6115 | 682 | 11.152903% |
Noise dominated data is calculated using 1-second bins in cleaned event files. If a bin has >2000 counts, and if more than 50% of those come from <1% of pixels, then it is considered to be noise-dominated and hence unusable.
| Quadrant | # 1 sec bins | Bins with >0 counts | Bins with >2000 counts | High rate bins dominated by noise | Noise dominated (total time) | Noise dominated (detector-on time) | Marked lightcurve |
|---|---|---|---|---|---|---|---|
| A | 7265 | 6115 | 0 | 0 | 0.00% | 0.00% | 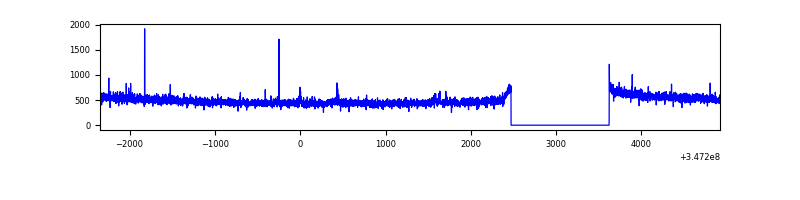 |
| B | 7266 | 6116 | 0 | 0 | 0.00% | 0.00% | 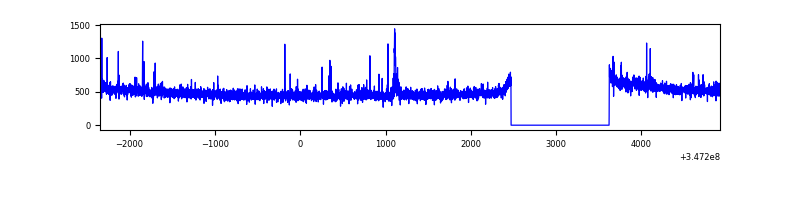 |
| C | 7265 | 6115 | 26 | 26 | 0.36% | 0.43% | 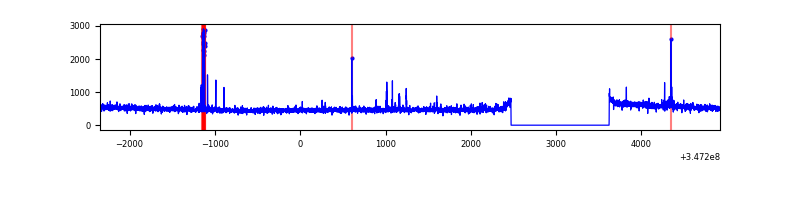 |
| D | 7265 | 6115 | 592 | 592 | 8.15% | 9.68% | 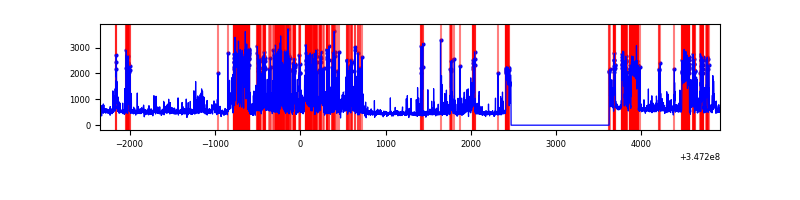 |
Top three noisy pixels from each quadrant. If the there are fewer than three noisy pixels in the level2.evt file, extra rows are filled as -1
| Pixel properties | Quadrant properties | ||||||
|---|---|---|---|---|---|---|---|
| Quadrant | DetID | PixID | Counts | Sigma | Mean | Median | Sigma |
| A | 15 | 174 | 15104 | 94.05 | 768 | 754 | 152.6 |
| A | 13 | 254 | 9681 | 58.51 | 768 | 754 | 152.6 |
| A | 3 | 137 | 7191 | 42.19 | 768 | 754 | 152.6 |
| B | 15 | 222 | 20835 | 141.77 | 754 | 735 | 141.8 |
| B | 10 | 245 | 20702 | 140.83 | 754 | 735 | 141.8 |
| B | 12 | 111 | 16952 | 114.38 | 754 | 735 | 141.8 |
| C | 7 | 220 | 120945 | 707.79 | 737 | 743 | 169.8 |
| C | 14 | 238 | 120141 | 703.06 | 737 | 743 | 169.8 |
| C | 3 | 233 | 6310 | 32.78 | 737 | 743 | 169.8 |
| D | 1 | 52 | 1876363 | 11056.3 | 716 | 696 | 169.6 |
| D | 8 | 195 | 410244 | 2414.12 | 716 | 696 | 169.6 |
| D | 2 | 250 | 130711 | 766.39 | 716 | 696 | 169.6 |
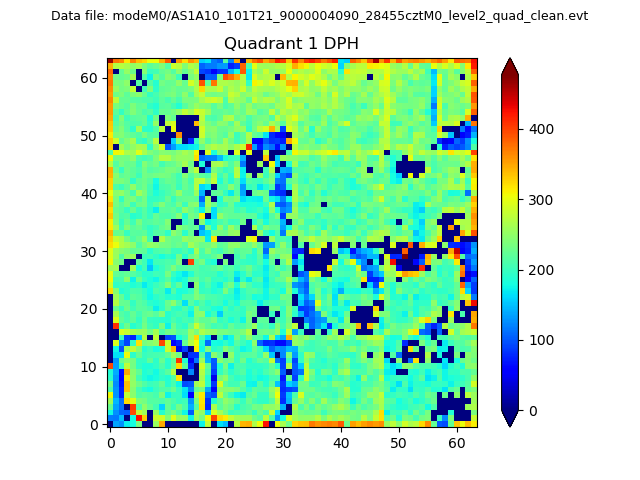
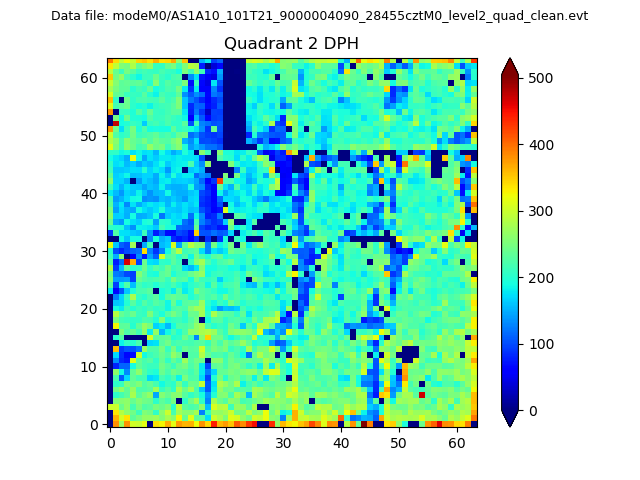
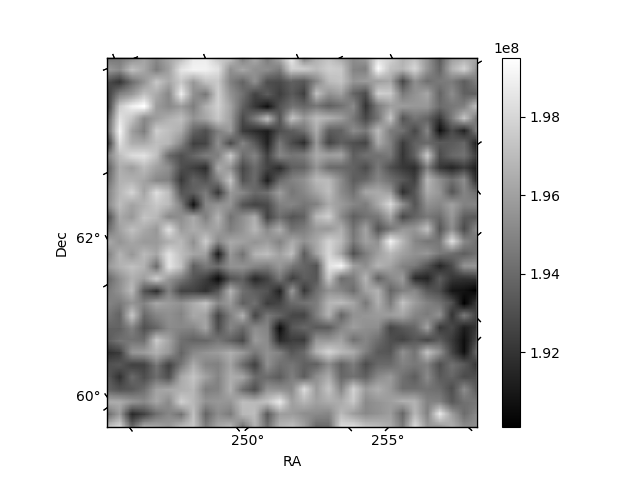
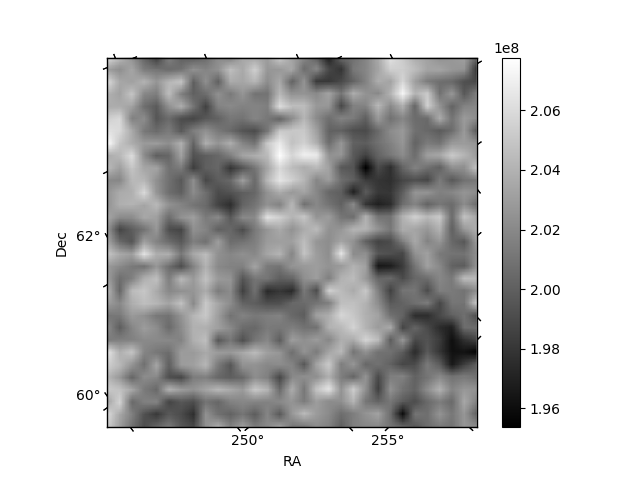
Histogram calculated using DETX and DETY for each event in the final _common_clean file
| Quadrant A |  |
 |
Quadrant B |
|---|---|---|---|
| Quadrant D | 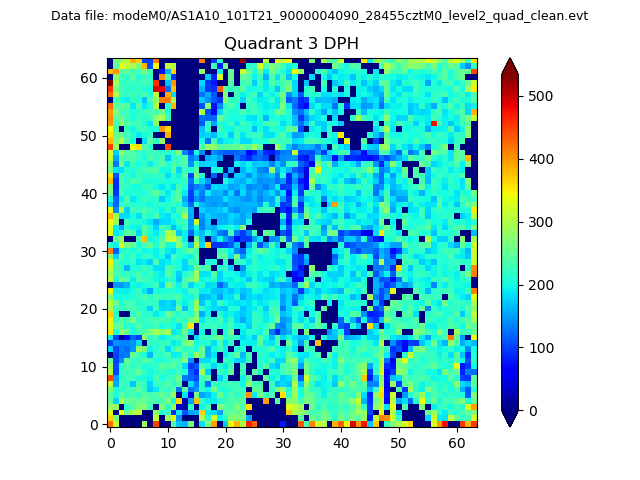 |
 |
Quadrant C |
| Plot type | Count rate plots | Images |
|---|---|---|
| Comparison with Poisson distribution Blue bars denote a histogram of data divided into 1 sec bins. Red curve is a Poisson curve with rate = median count rate of data. |
 |
 |
| Quadrant-wise count rates Data is divided into 100 sec bins |
 |
|
| Module-wise count rates for Quadrant A Data is divided into 100 sec bins |
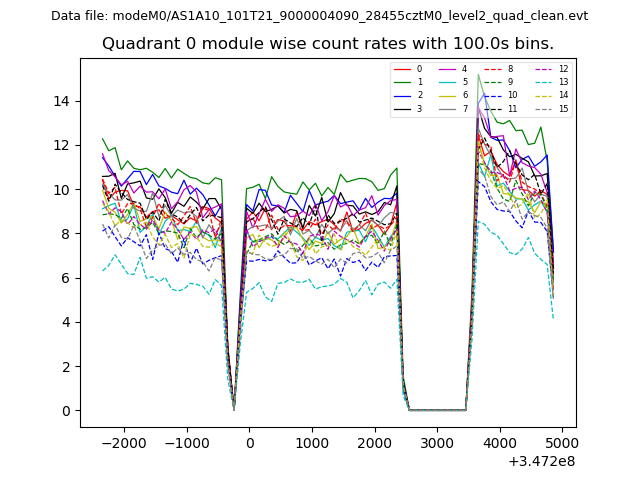 |
 |
| Module-wise count rates for Quadrant B Data is divided into 100 sec bins |
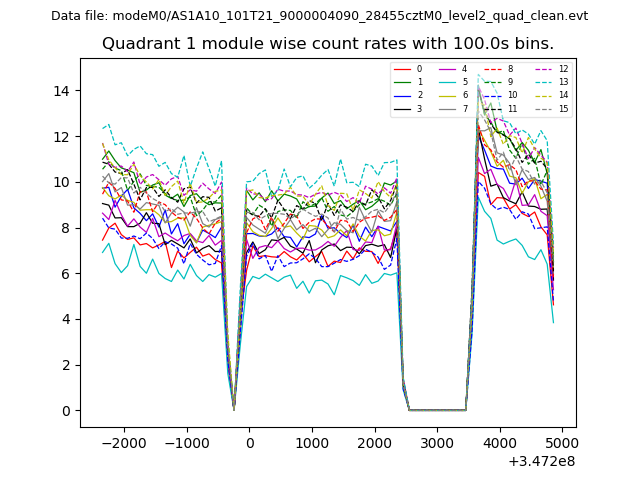 |
 |
| Module-wise count rates for Quadrant C Data is divided into 100 sec bins |
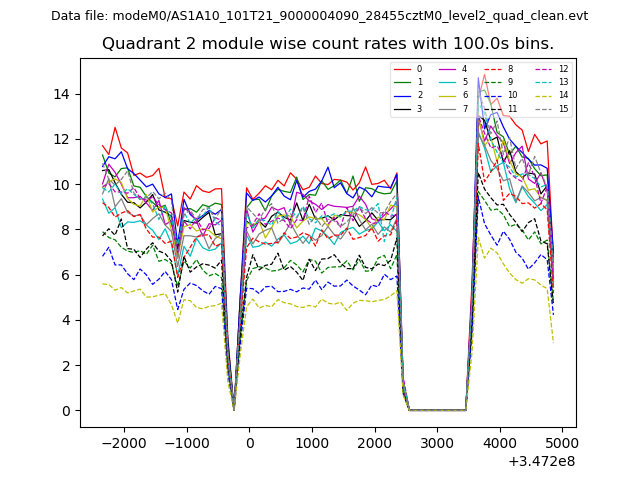 |
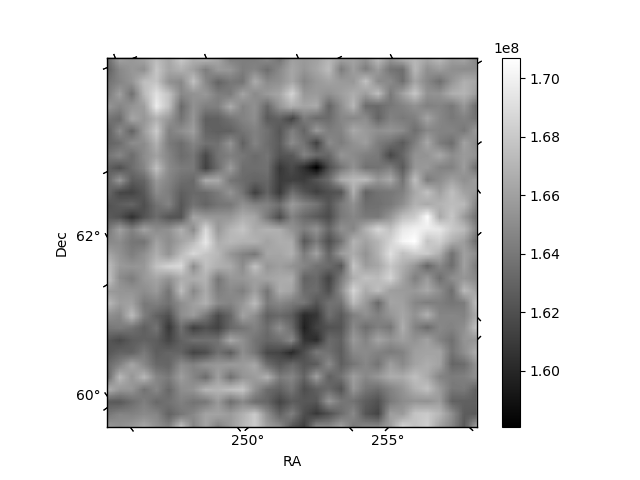 |
| Module-wise count rates for Quadrant D Data is divided into 100 sec bins |
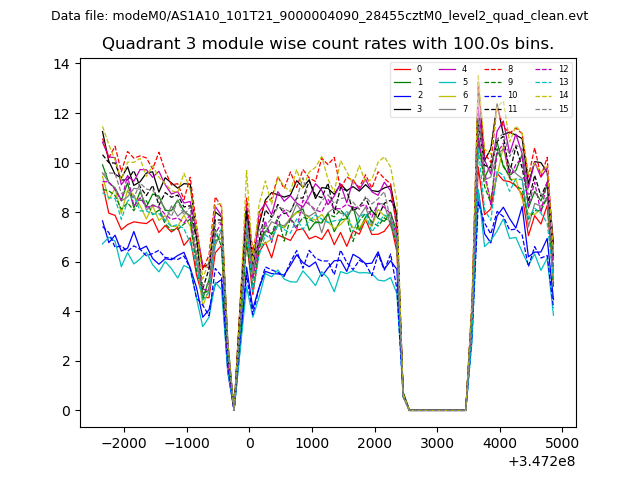 |
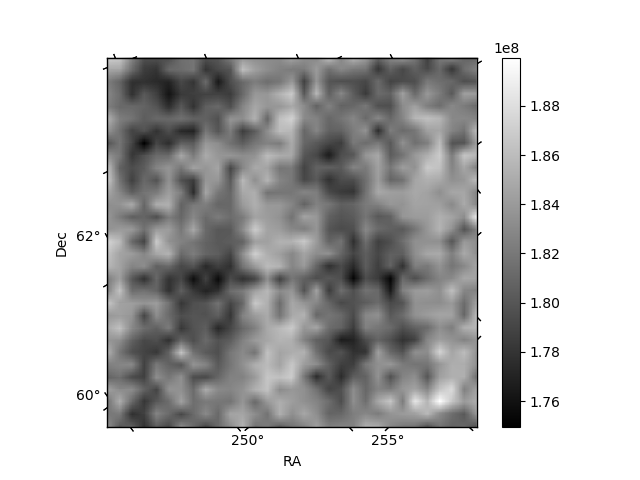 |
| Parameter | Plot |
|---|---|
| CZT HV Monitor | 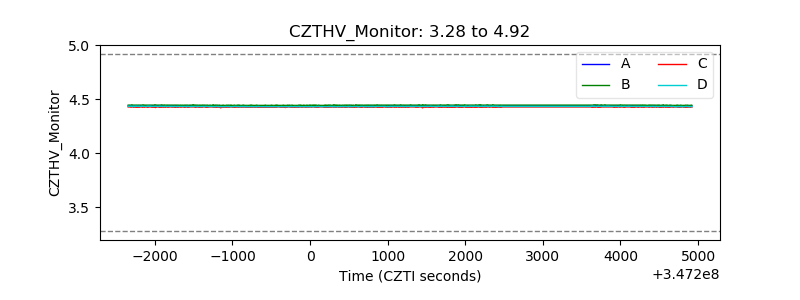 |
| D_VDD | 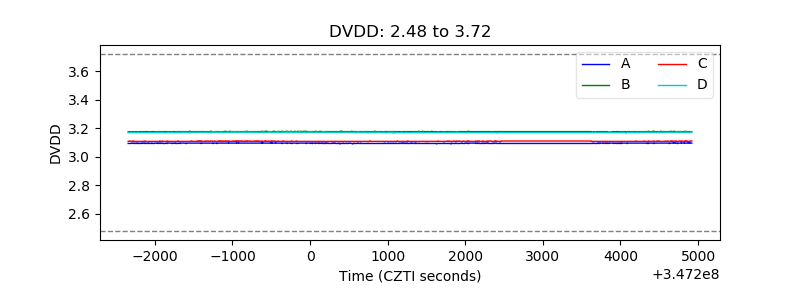 |
| Temperature 1 | 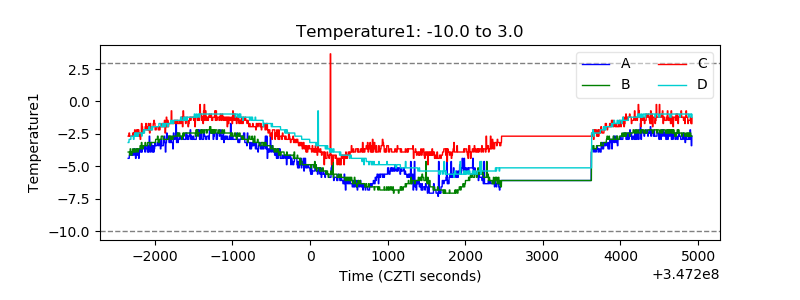 |
| Veto HV Monitor | 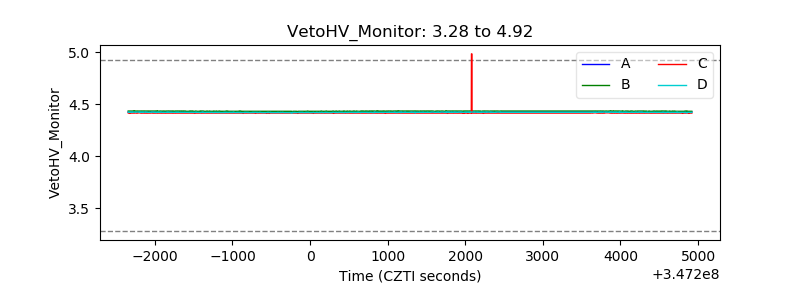 |
| Veto LLD | 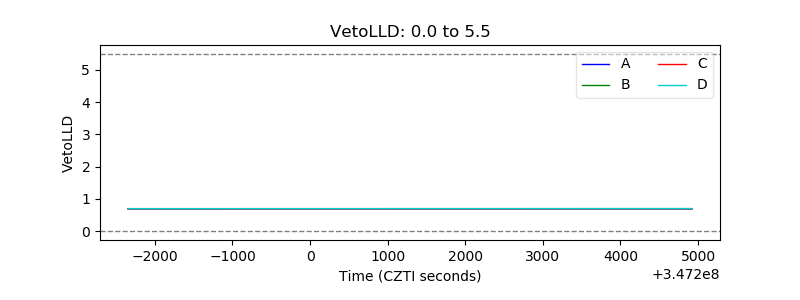 |
| Alpha Counter | 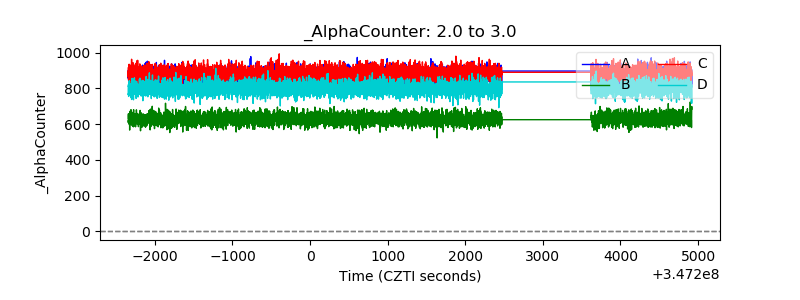 |
| _CPM_Rate | 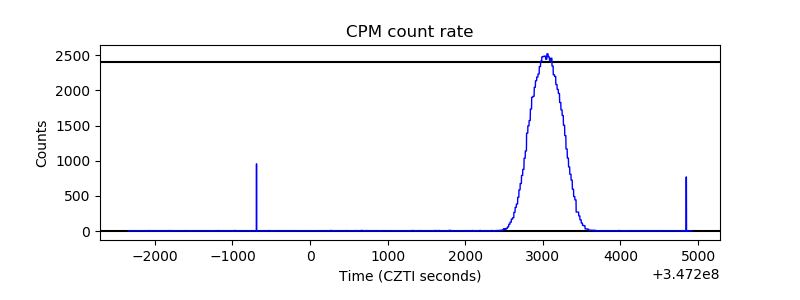 |
| CZT Counter | 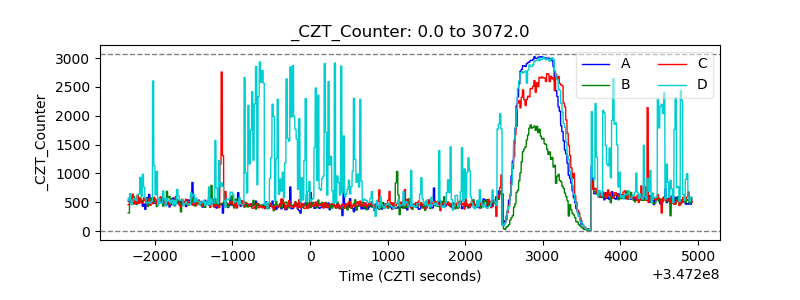 |
| +2.5 Volts monitor |  |
| +5 Volts monitor |  |
| _ROLL_ROT | 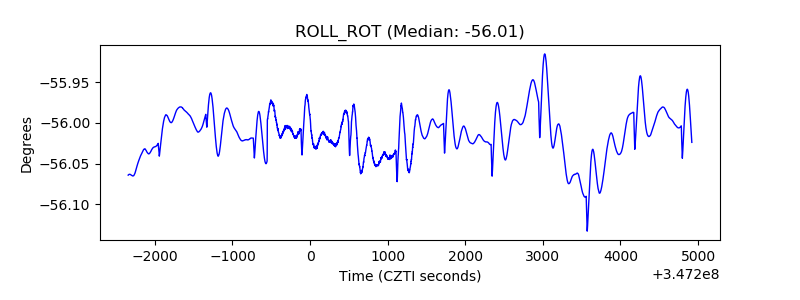 |
| _Roll_DEC | 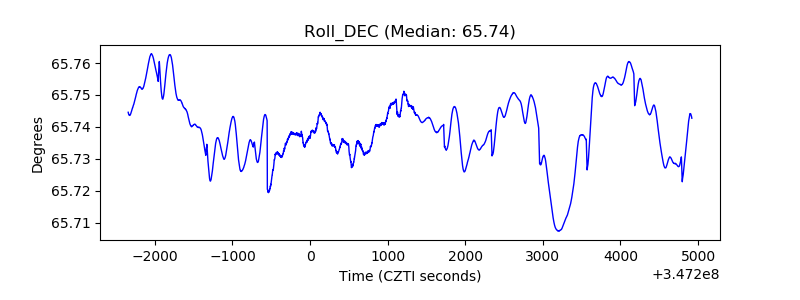 |
| _Roll_RA | 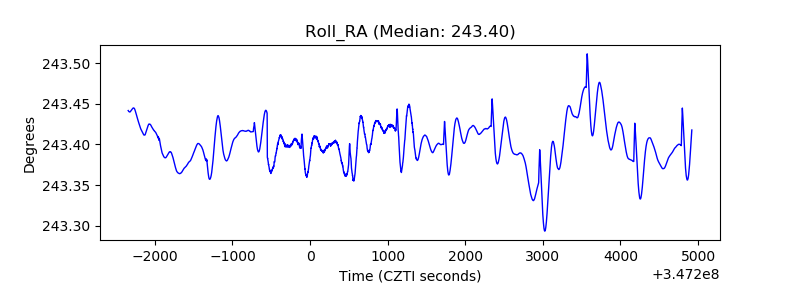 |
| Veto Counter | 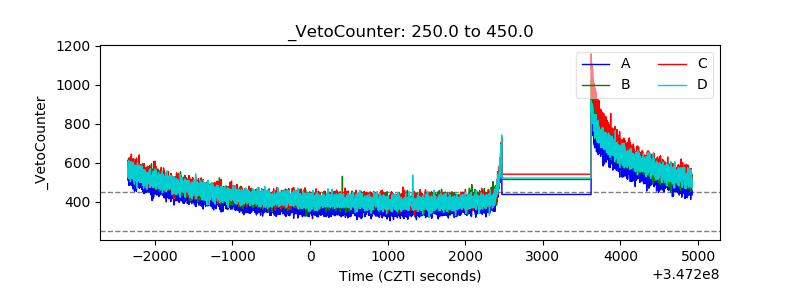 |