| Param | Original file | Final file |
|---|---|---|
| Filename | modeM0/AS1A10_101T21_9000004090_28456cztM0_level2.evt | modeM0/AS1A10_101T21_9000004090_28456cztM0_level2_quad_clean.evt |
| Size (bytes) | 501,632,640 | 123,776,640 |
| Size | 478.4 MB | 118.0 MB |
| Events in quadrant A | 2,975,593 | 859,865 |
| Events in quadrant B | 3,007,534 | 867,525 |
| Events in quadrant C | 3,075,166 | 836,772 |
| Events in quadrant D | 5,732,796 | 771,755 |
| Mode M0 | |||
|---|---|---|---|
| Quadrant | BADHDUFLAG | Total packets | Discarded packets |
| A | 0 | 12665 | 0 |
| B | 0 | 12653 | 0 |
| C | 0 | 12869 | 0 |
| D | 0 | 21093 | 0 |
| Mode M9 | |||
|---|---|---|---|
| Quadrant | BADHDUFLAG | Total packets | Discarded packets |
| A | 0 | 13 | 0 |
| B | 0 | 13 | 0 |
| C | 0 | 13 | 0 |
| D | 0 | 13 | 0 |
| Quadrant | Total seconds | Saturated seconds | Saturation percentage |
|---|---|---|---|
| A | 5914 | 52 | 0.879270% |
| B | 5914 | 55 | 0.929997% |
| C | 5914 | 74 | 1.251268% |
| D | 5915 | 791 | 13.372781% |
Noise dominated data is calculated using 1-second bins in cleaned event files. If a bin has >2000 counts, and if more than 50% of those come from <1% of pixels, then it is considered to be noise-dominated and hence unusable.
| Quadrant | # 1 sec bins | Bins with >0 counts | Bins with >2000 counts | High rate bins dominated by noise | Noise dominated (total time) | Noise dominated (detector-on time) | Marked lightcurve |
|---|---|---|---|---|---|---|---|
| A | 7179 | 5914 | 1 | 1 | 0.01% | 0.02% | 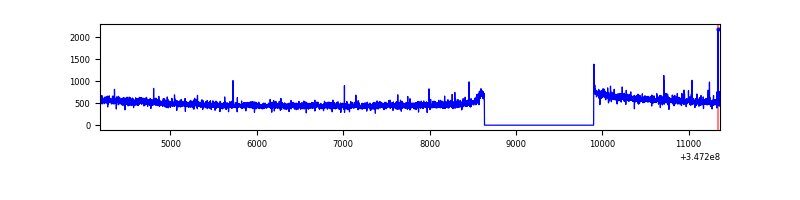 |
| B | 7179 | 5914 | 1 | 1 | 0.01% | 0.02% | 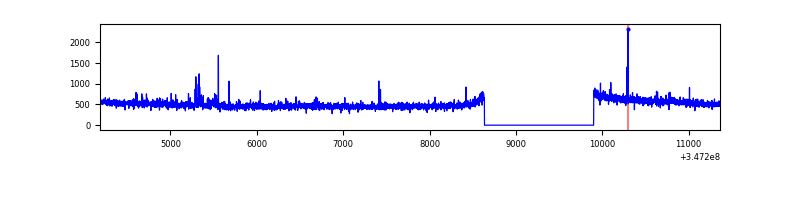 |
| C | 7179 | 5914 | 1 | 1 | 0.01% | 0.02% | 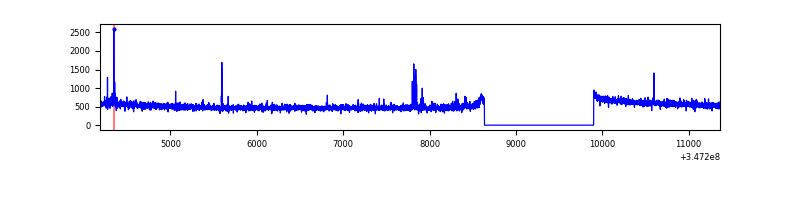 |
| D | 7180 | 5915 | 685 | 685 | 9.54% | 11.58% | 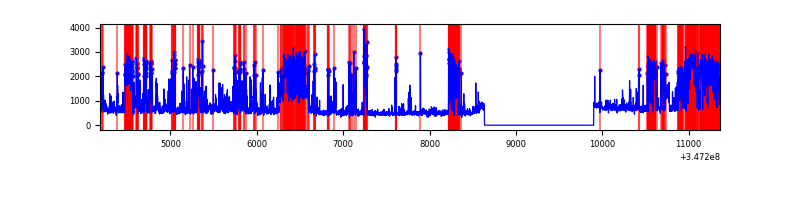 |
Top three noisy pixels from each quadrant. If the there are fewer than three noisy pixels in the level2.evt file, extra rows are filled as -1
| Pixel properties | Quadrant properties | ||||||
|---|---|---|---|---|---|---|---|
| Quadrant | DetID | PixID | Counts | Sigma | Mean | Median | Sigma |
| A | 12 | 96 | 15217 | 94.97 | 766 | 754 | 152.3 |
| A | 13 | 254 | 9879 | 59.92 | 766 | 754 | 152.3 |
| A | 3 | 137 | 7007 | 41.06 | 766 | 754 | 152.3 |
| B | 10 | 245 | 36570 | 257.51 | 753 | 735 | 139.2 |
| B | 12 | 111 | 16326 | 112.04 | 753 | 735 | 139.2 |
| B | 11 | 111 | 15183 | 103.83 | 753 | 735 | 139.2 |
| C | 14 | 238 | 121861 | 701.22 | 744 | 749 | 172.7 |
| C | 7 | 220 | 52326 | 298.62 | 744 | 749 | 172.7 |
| C | 13 | 61 | 5036 | 24.82 | 744 | 749 | 172.7 |
| D | 1 | 52 | 1732943 | 10132.71 | 723 | 705 | 171.0 |
| D | 8 | 195 | 680668 | 3977.44 | 723 | 705 | 171.0 |
| D | 2 | 250 | 295114 | 1722.14 | 723 | 705 | 171.0 |
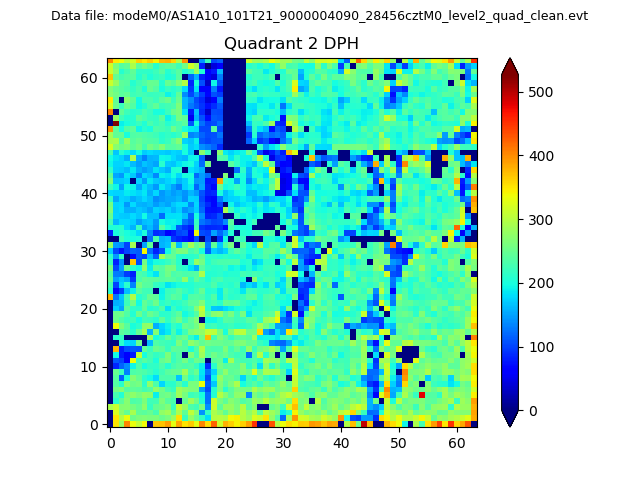
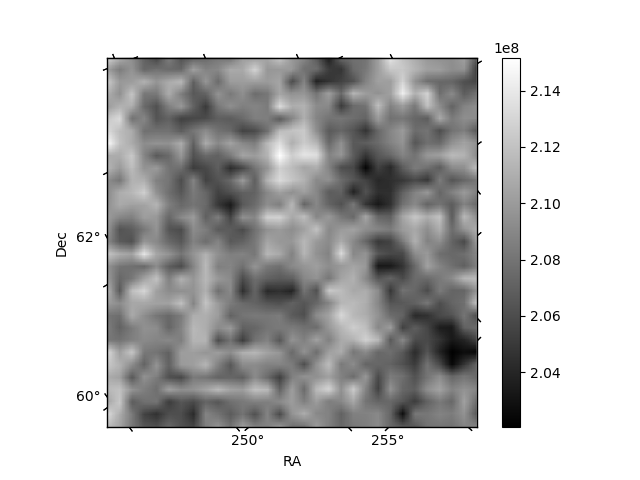
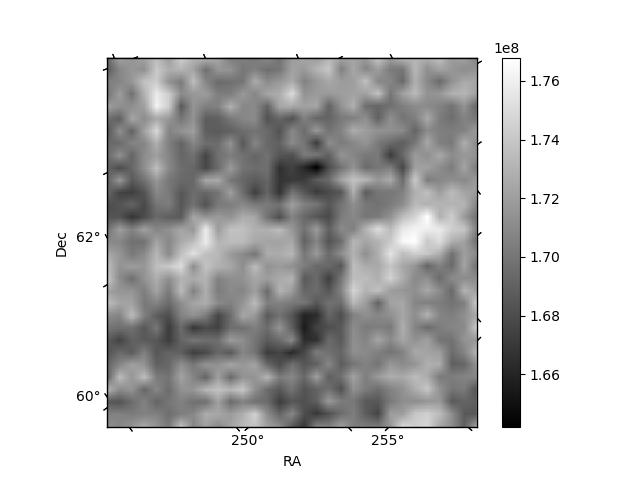
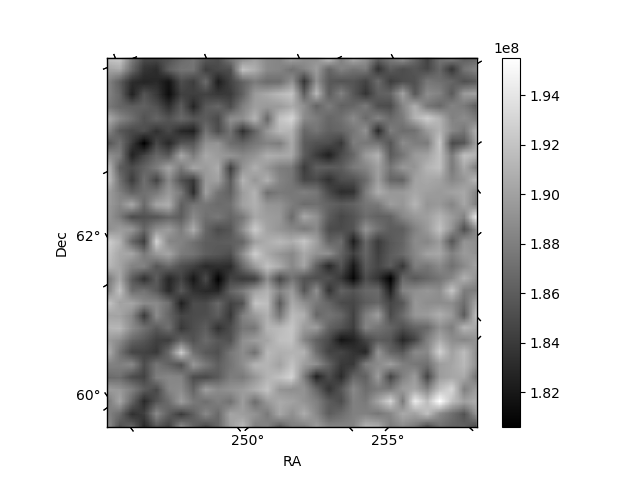
Histogram calculated using DETX and DETY for each event in the final _common_clean file
| Quadrant A | 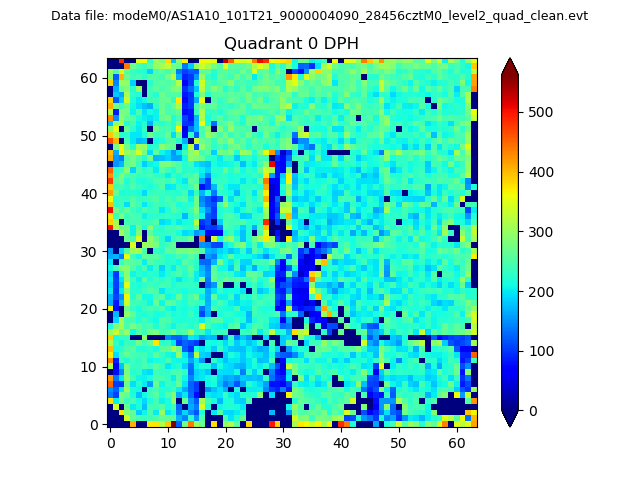 |
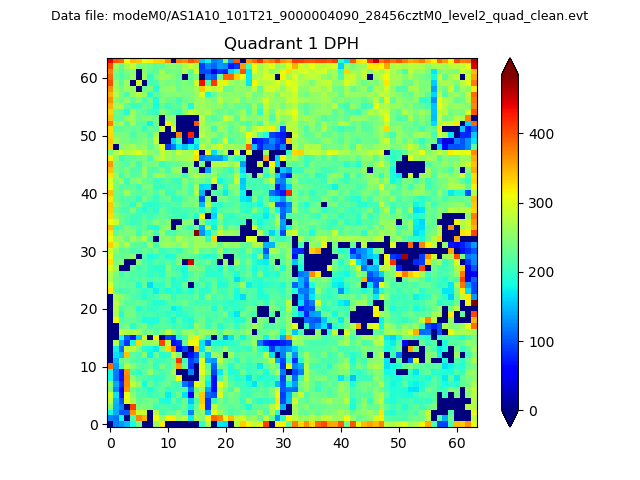 |
Quadrant B |
|---|---|---|---|
| Quadrant D | 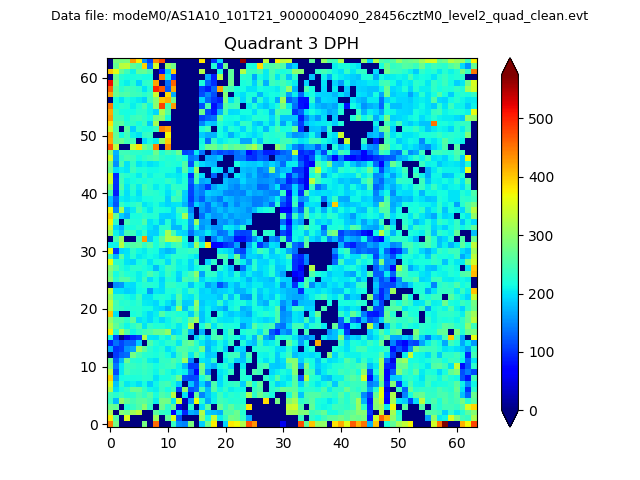 |
 |
Quadrant C |
| Plot type | Count rate plots | Images |
|---|---|---|
| Comparison with Poisson distribution Blue bars denote a histogram of data divided into 1 sec bins. Red curve is a Poisson curve with rate = median count rate of data. |
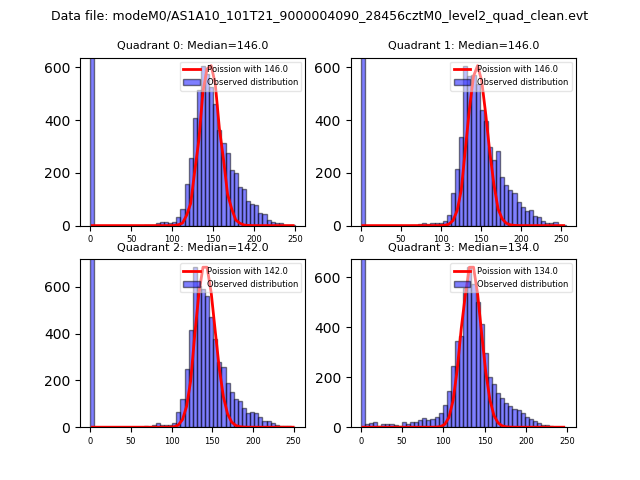 |
 |
| Quadrant-wise count rates Data is divided into 100 sec bins |
 |
|
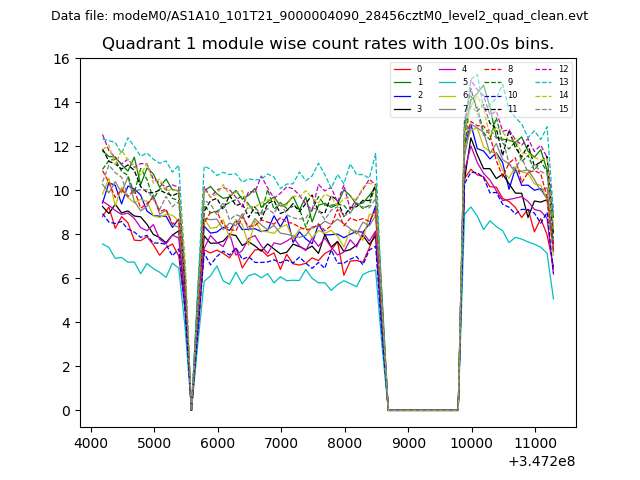
| Module-wise count rates for Quadrant A Data is divided into 100 sec bins |
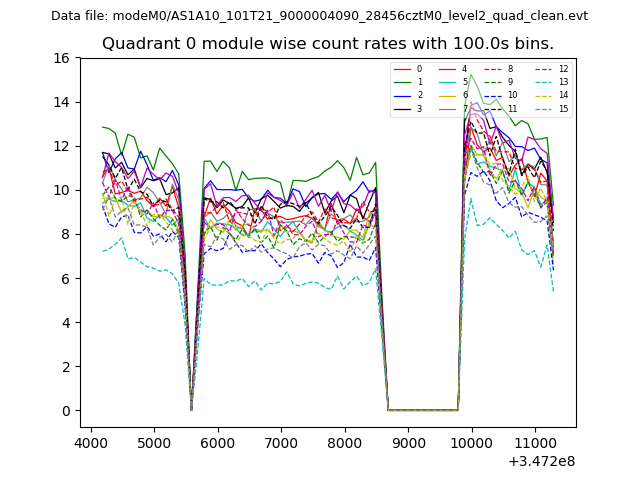 |
 |
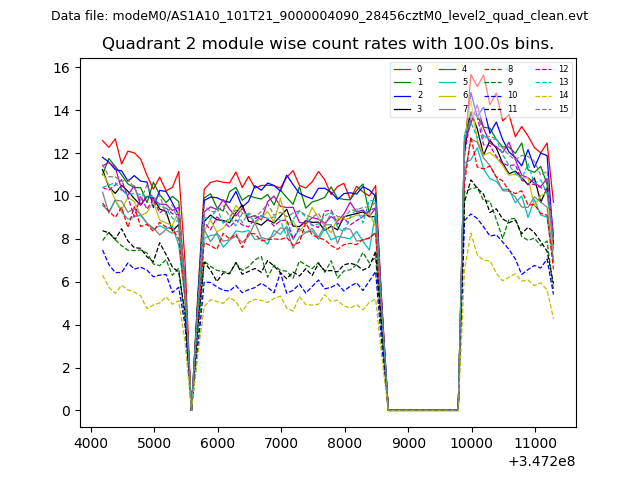
| Module-wise count rates for Quadrant B Data is divided into 100 sec bins |
 |
 |
| Module-wise count rates for Quadrant C Data is divided into 100 sec bins |
 |
 |
| Module-wise count rates for Quadrant D Data is divided into 100 sec bins |
 |
 |
| Parameter | Plot |
|---|---|
| CZT HV Monitor | 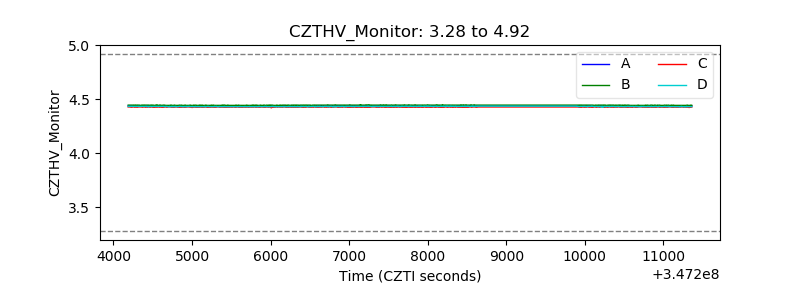 |
| D_VDD | 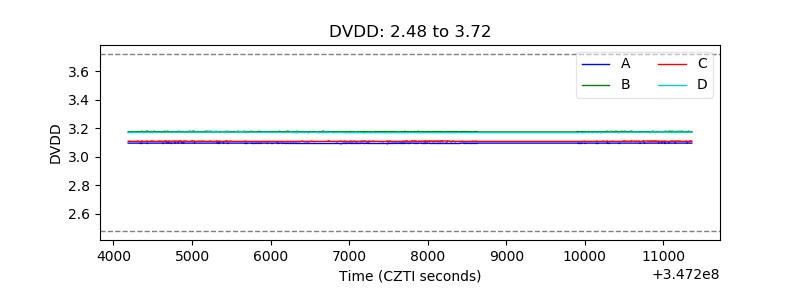 |
| Temperature 1 | 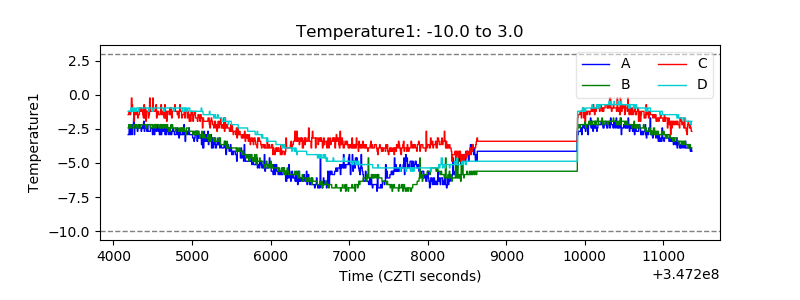 |
| Veto HV Monitor | 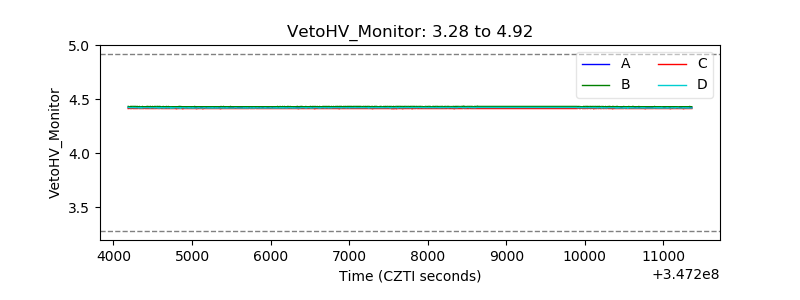 |
| Veto LLD | 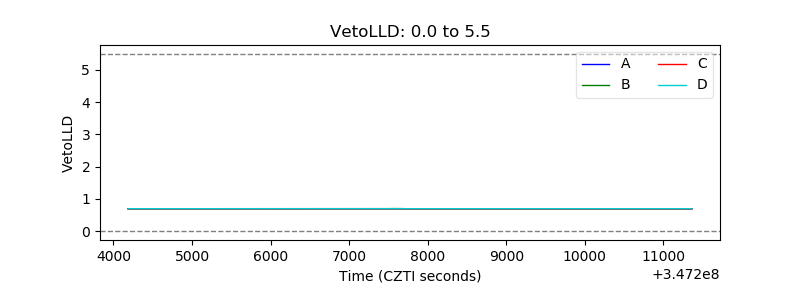 |
| Alpha Counter | 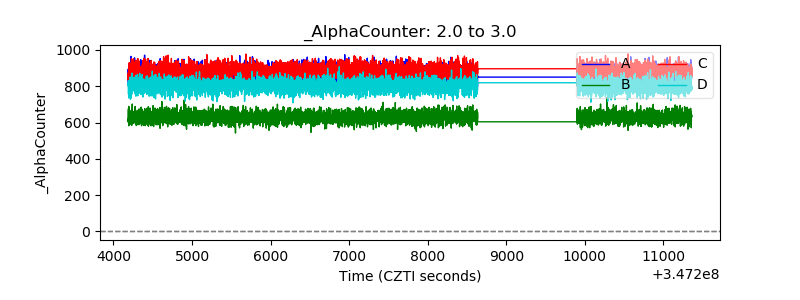 |
| _CPM_Rate | 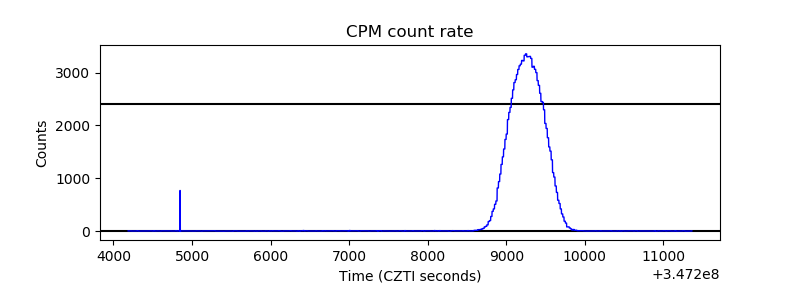 |
| CZT Counter | 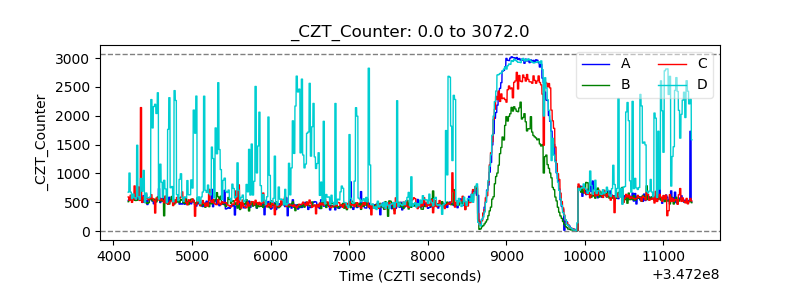 |
| +2.5 Volts monitor |  |
| +5 Volts monitor |  |
| _ROLL_ROT | 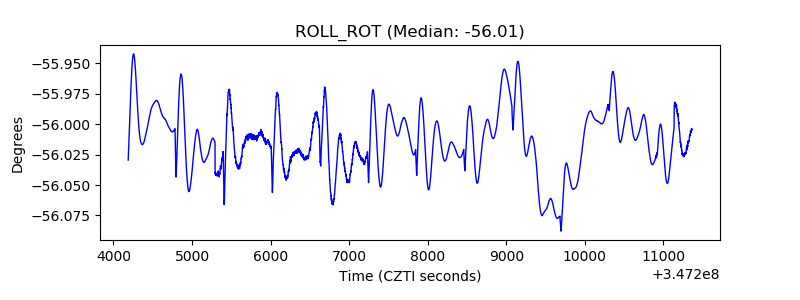 |
| _Roll_DEC | 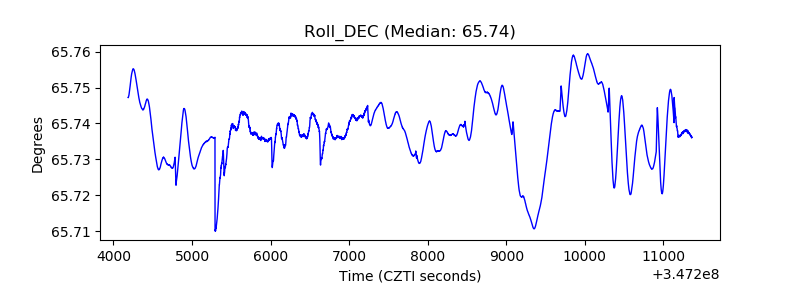 |
| _Roll_RA | 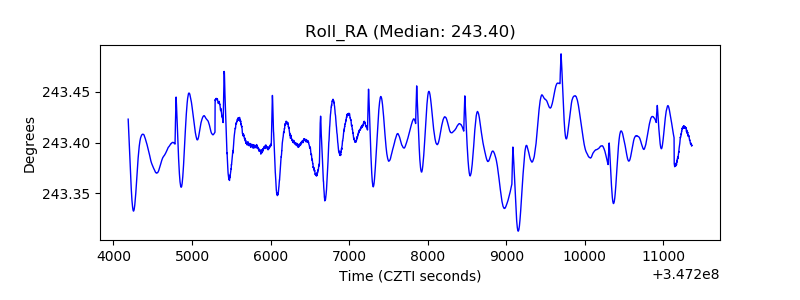 |
| Veto Counter | 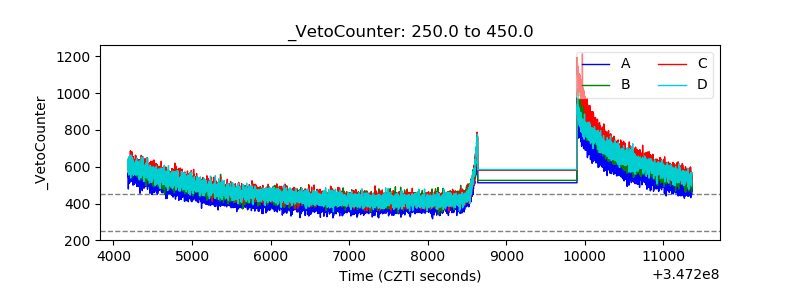 |