| Param | Original file | Final file |
|---|---|---|
| Filename | modeM0/AS1A10_101T21_9000004090_28457cztM0_level2.evt | modeM0/AS1A10_101T21_9000004090_28457cztM0_level2_quad_clean.evt |
| Size (bytes) | 587,761,920 | 131,996,160 |
| Size | 560.5 MB | 125.9 MB |
| Events in quadrant A | 3,237,842 | 919,949 |
| Events in quadrant B | 3,493,749 | 933,067 |
| Events in quadrant C | 3,291,546 | 909,472 |
| Events in quadrant D | 7,362,599 | 807,245 |
| Mode M0 | |||
|---|---|---|---|
| Quadrant | BADHDUFLAG | Total packets | Discarded packets |
| A | 0 | 13668 | 0 |
| B | 0 | 14340 | 0 |
| C | 0 | 13704 | 0 |
| D | 0 | 26206 | 0 |
| Mode M9 | |||
|---|---|---|---|
| Quadrant | BADHDUFLAG | Total packets | Discarded packets |
| A | 0 | 13 | 0 |
| B | 0 | 13 | 0 |
| C | 0 | 13 | 0 |
| D | 0 | 13 | 0 |
| Quadrant | Total seconds | Saturated seconds | Saturation percentage |
|---|---|---|---|
| A | 6128 | 89 | 1.452350% |
| B | 6129 | 111 | 1.811062% |
| C | 6129 | 128 | 2.088432% |
| D | 6129 | 1077 | 17.572198% |
Noise dominated data is calculated using 1-second bins in cleaned event files. If a bin has >2000 counts, and if more than 50% of those come from <1% of pixels, then it is considered to be noise-dominated and hence unusable.
| Quadrant | # 1 sec bins | Bins with >0 counts | Bins with >2000 counts | High rate bins dominated by noise | Noise dominated (total time) | Noise dominated (detector-on time) | Marked lightcurve |
|---|---|---|---|---|---|---|---|
| A | 7428 | 6128 | 1 | 1 | 0.01% | 0.02% | 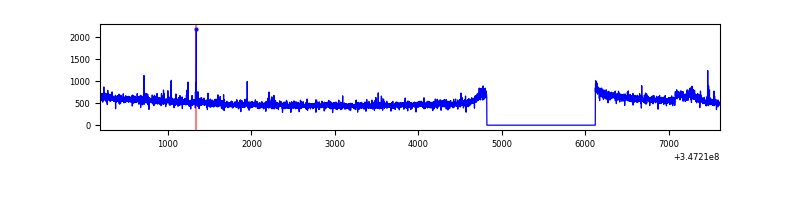 |
| B | 7429 | 6129 | 4 | 4 | 0.05% | 0.07% | 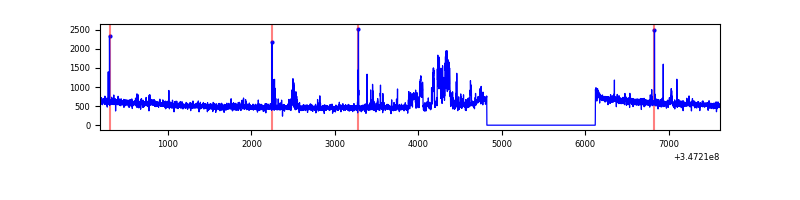 |
| C | 7429 | 6129 | 0 | 0 | 0.00% | 0.00% | 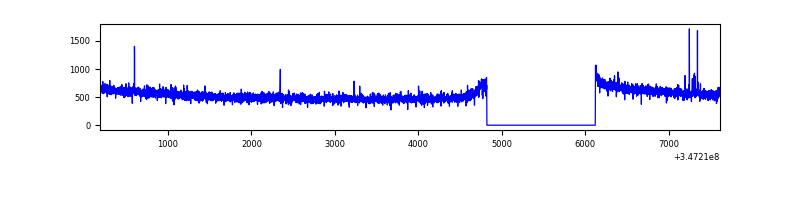 |
| D | 7429 | 6129 | 937 | 937 | 12.61% | 15.29% | 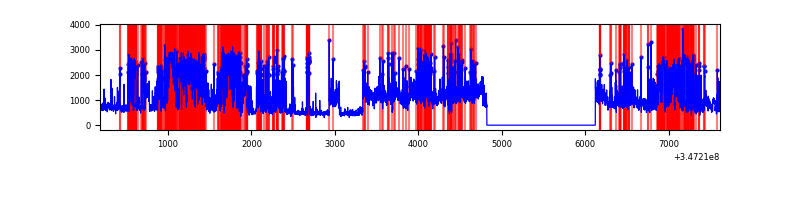 |
Top three noisy pixels from each quadrant. If the there are fewer than three noisy pixels in the level2.evt file, extra rows are filled as -1
| Pixel properties | Quadrant properties | ||||||
|---|---|---|---|---|---|---|---|
| Quadrant | DetID | PixID | Counts | Sigma | Mean | Median | Sigma |
| A | 15 | 174 | 51372 | 313.68 | 818 | 804 | 161.2 |
| A | 12 | 96 | 22826 | 136.6 | 818 | 804 | 161.2 |
| A | 13 | 254 | 10782 | 61.89 | 818 | 804 | 161.2 |
| B | 15 | 222 | 229992 | 1542.74 | 809 | 792 | 148.6 |
| B | 10 | 245 | 77709 | 517.73 | 809 | 792 | 148.6 |
| B | 12 | 111 | 17329 | 111.31 | 809 | 792 | 148.6 |
| C | 14 | 238 | 132668 | 714.52 | 803 | 807 | 184.5 |
| C | 7 | 220 | 22845 | 119.42 | 803 | 807 | 184.5 |
| C | 3 | 233 | 6290 | 29.71 | 803 | 807 | 184.5 |
| D | 1 | 52 | 2369790 | 13338.51 | 761 | 743 | 177.6 |
| D | 8 | 195 | 1293342 | 7277.75 | 761 | 743 | 177.6 |
| D | 2 | 250 | 674523 | 3793.6 | 761 | 743 | 177.6 |
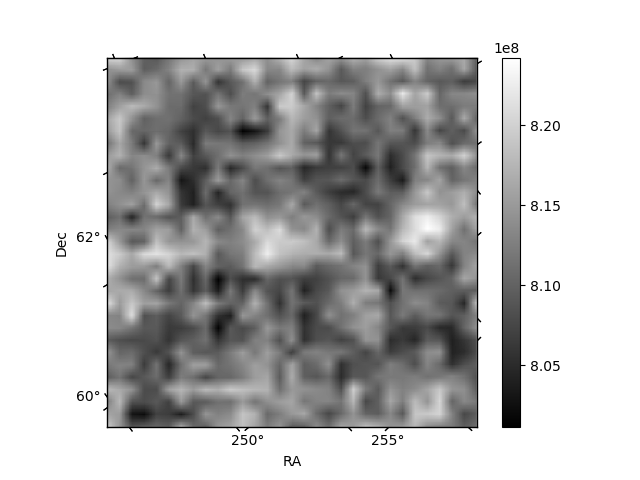
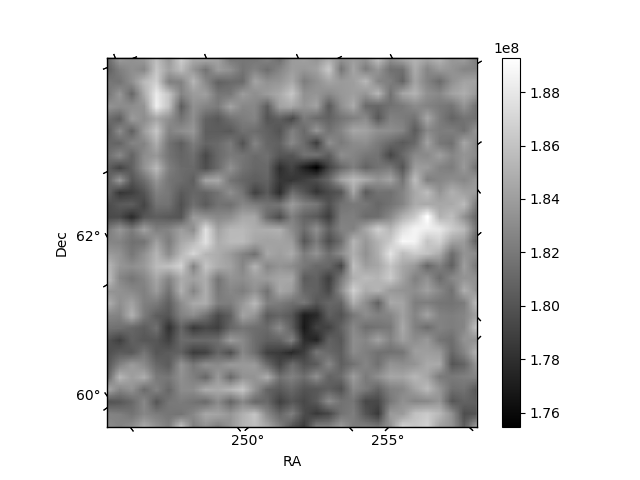
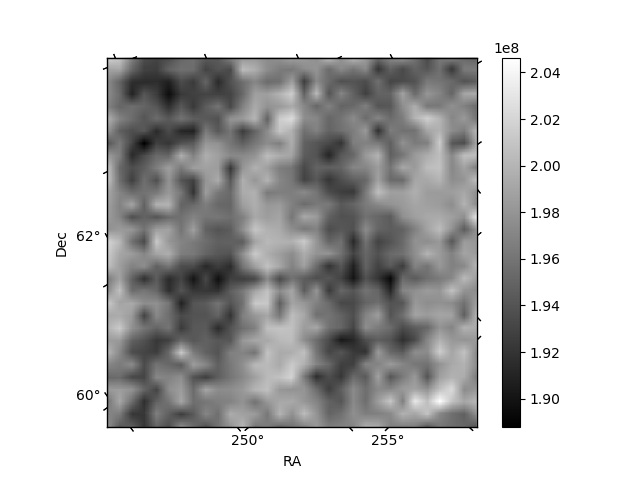
Histogram calculated using DETX and DETY for each event in the final _common_clean file
| Quadrant A | 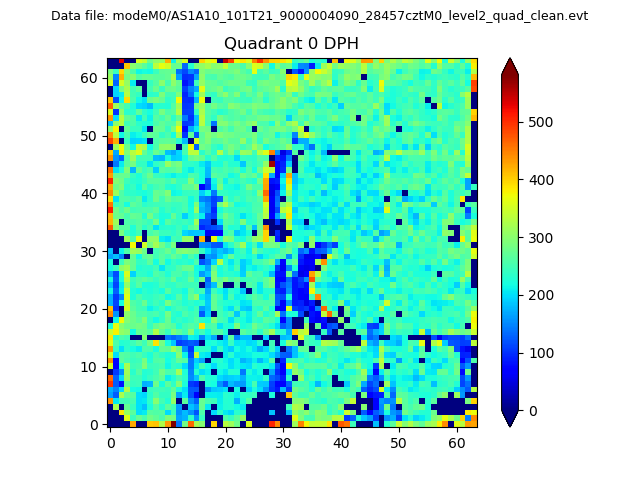 |
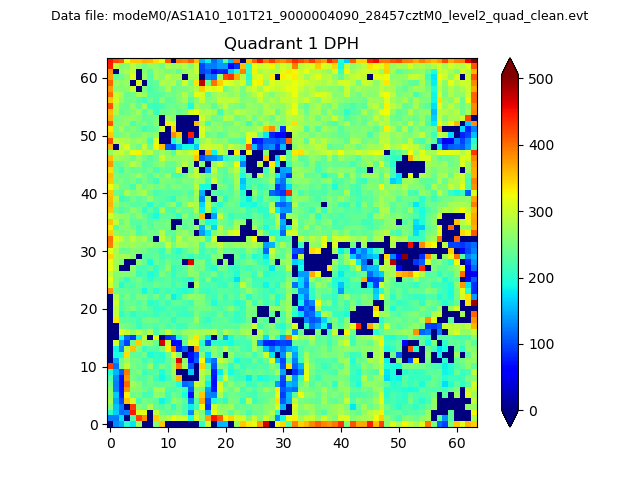 |
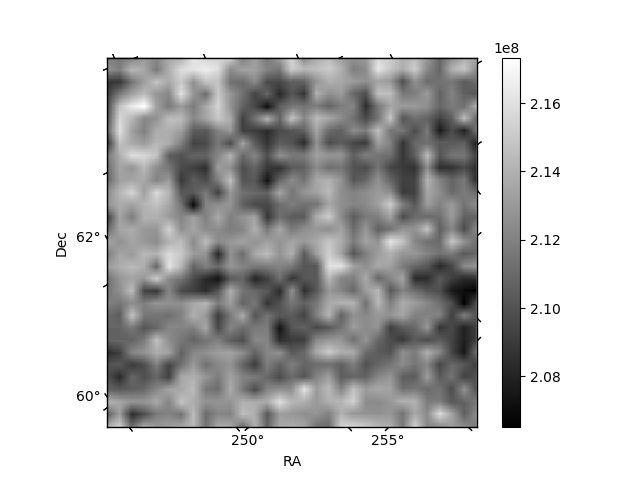
Quadrant B |
|---|---|---|---|
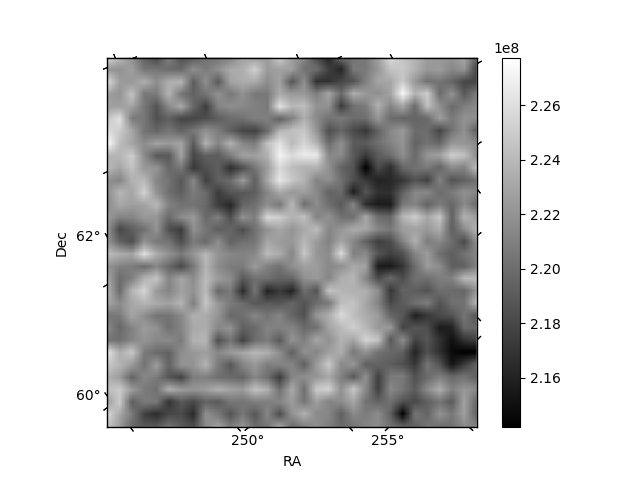
| Quadrant D | 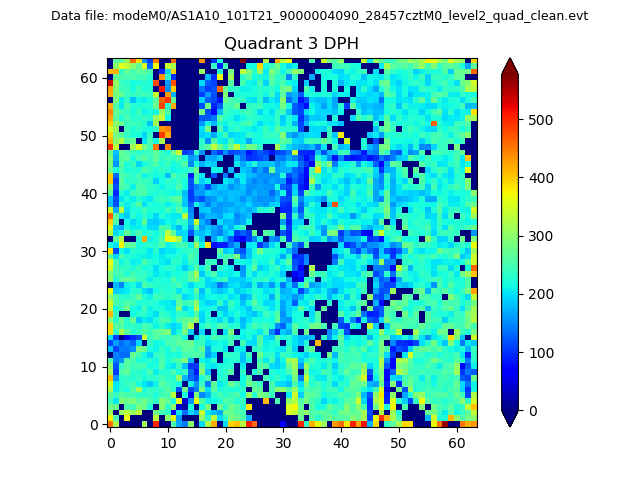 |
 |
Quadrant C |
| Plot type | Count rate plots | Images |
|---|---|---|
| Comparison with Poisson distribution Blue bars denote a histogram of data divided into 1 sec bins. Red curve is a Poisson curve with rate = median count rate of data. |
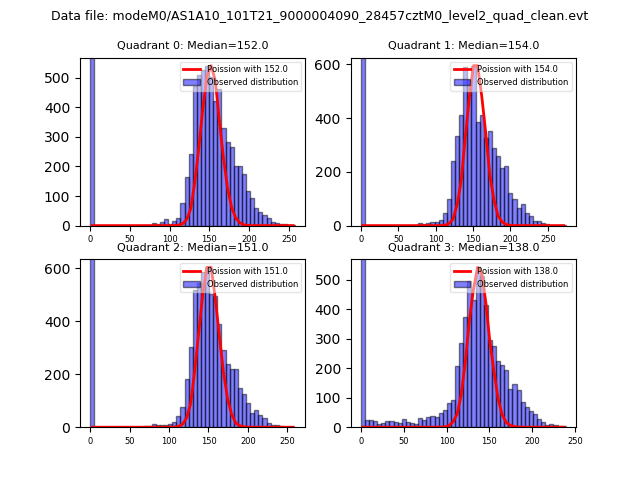 |
 |
| Quadrant-wise count rates Data is divided into 100 sec bins |
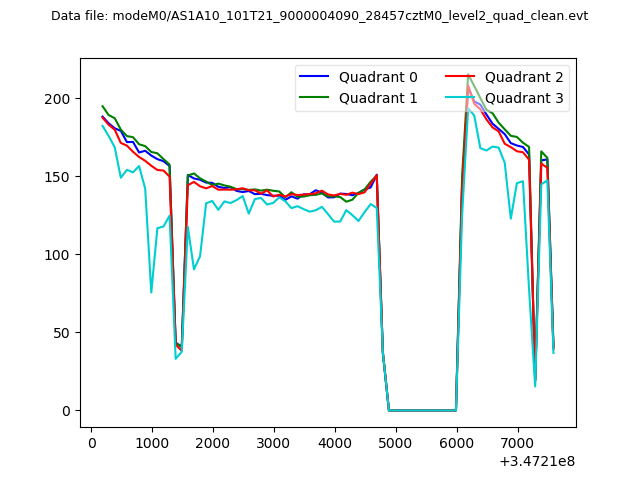 |
|
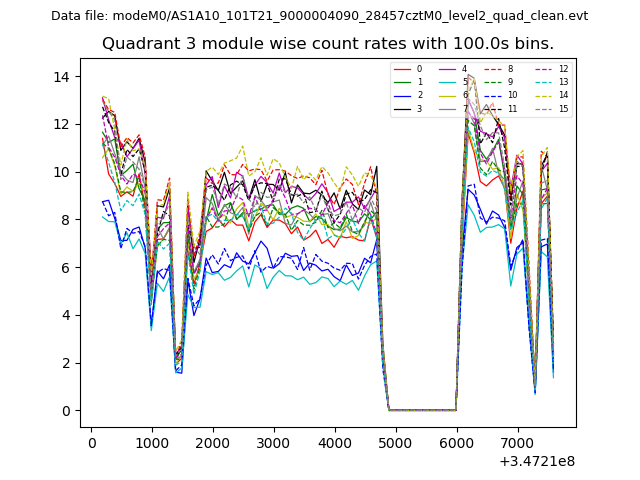
| Module-wise count rates for Quadrant A Data is divided into 100 sec bins |
 |
 |
| Module-wise count rates for Quadrant B Data is divided into 100 sec bins |
 |
 |
| Module-wise count rates for Quadrant C Data is divided into 100 sec bins |
 |
 |
| Module-wise count rates for Quadrant D Data is divided into 100 sec bins |
 |
 |
| Parameter | Plot |
|---|---|
| CZT HV Monitor | 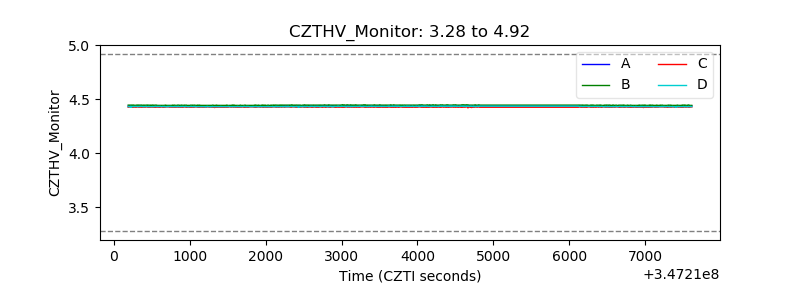 |
| D_VDD | 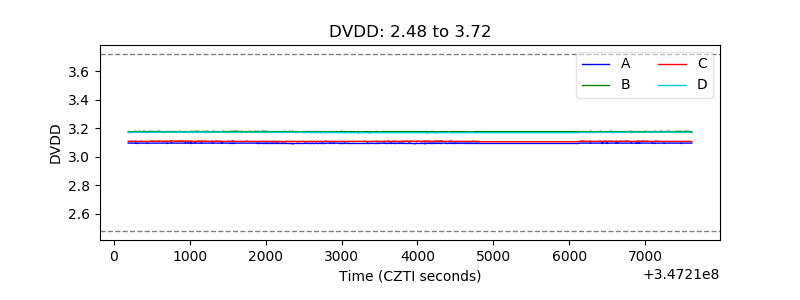 |
| Temperature 1 | 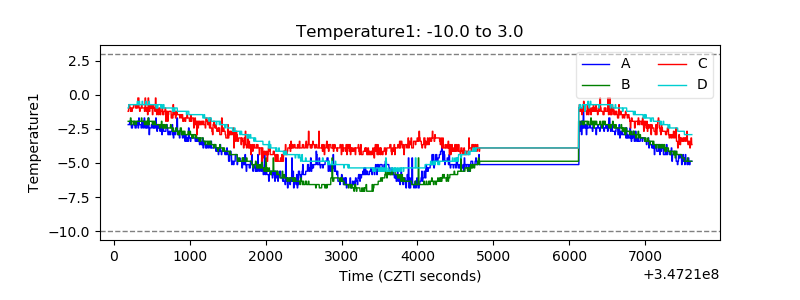 |
| Veto HV Monitor | 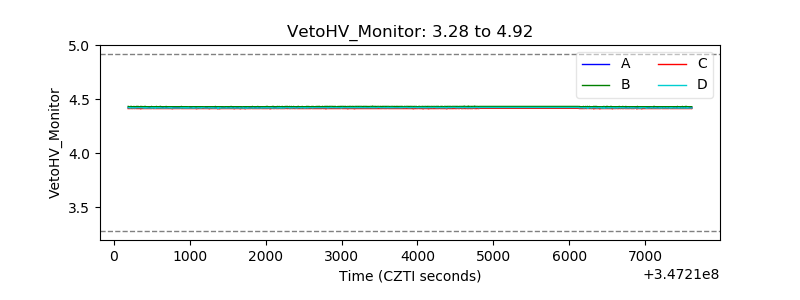 |
| Veto LLD | 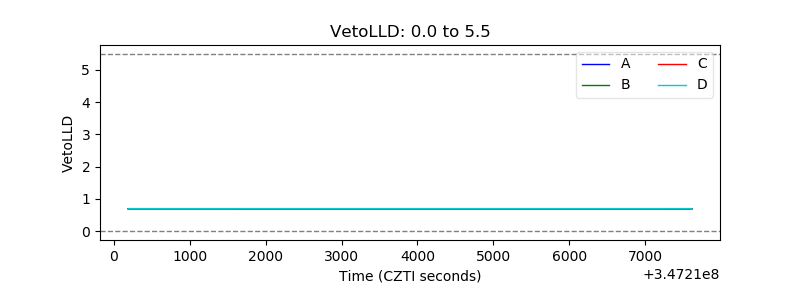 |
| Alpha Counter | 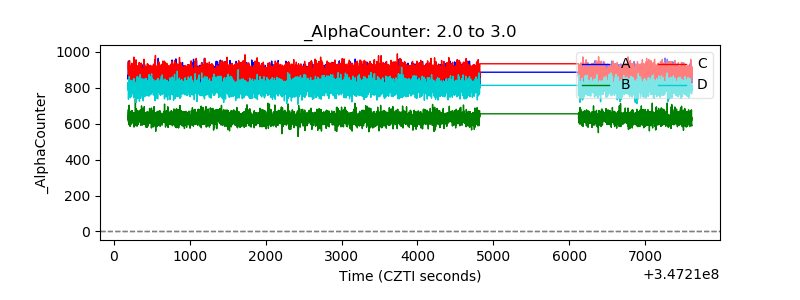 |
| _CPM_Rate | 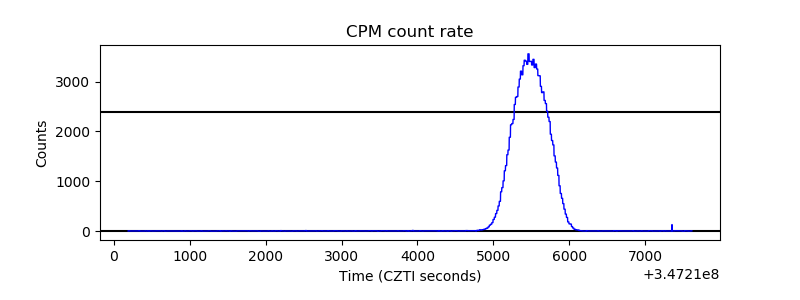 |
| CZT Counter | 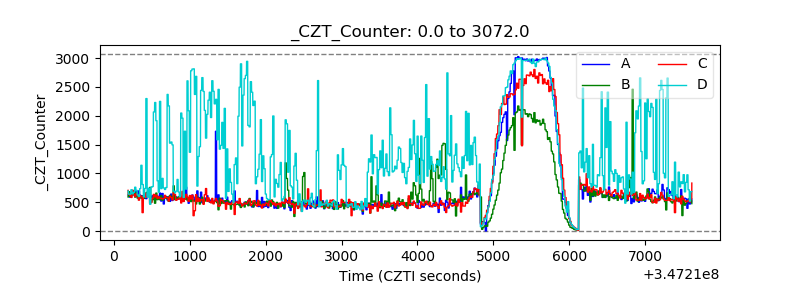 |
| +2.5 Volts monitor |  |
| +5 Volts monitor |  |
| _ROLL_ROT | 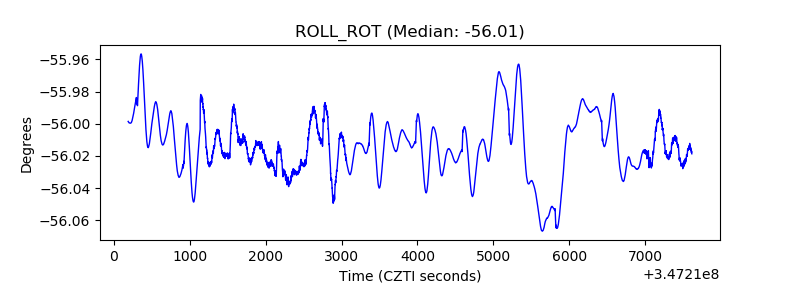 |
| _Roll_DEC | 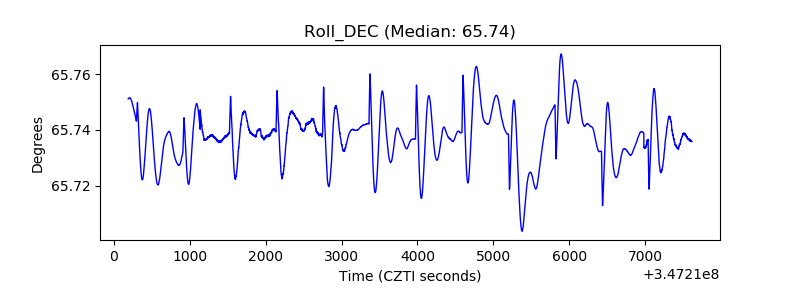 |
| _Roll_RA | 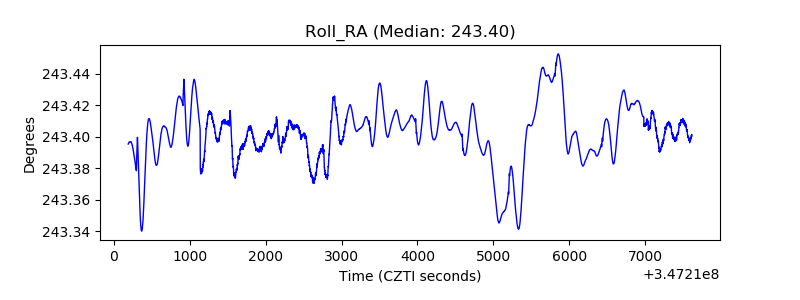 |
| Veto Counter |  |