| Param | Original file | Final file |
|---|---|---|
| Filename | modeM0/AS1A10_101T21_9000004090_28458cztM0_level2.evt | modeM0/AS1A10_101T21_9000004090_28458cztM0_level2_quad_clean.evt |
| Size (bytes) | 605,157,120 | 138,962,880 |
| Size | 577.1 MB | 132.5 MB |
| Events in quadrant A | 3,718,401 | 965,484 |
| Events in quadrant B | 3,385,348 | 992,694 |
| Events in quadrant C | 3,466,330 | 963,630 |
| Events in quadrant D | 7,332,243 | 848,657 |
| Mode M0 | |||
|---|---|---|---|
| Quadrant | BADHDUFLAG | Total packets | Discarded packets |
| A | 0 | 15226 | 0 |
| B | 0 | 14129 | 0 |
| C | 0 | 14440 | 0 |
| D | 0 | 26177 | 0 |
| Mode M9 | |||
|---|---|---|---|
| Quadrant | BADHDUFLAG | Total packets | Discarded packets |
| A | 0 | 14 | 0 |
| B | 0 | 15 | 0 |
| C | 0 | 15 | 0 |
| D | 0 | 15 | 0 |
| Quadrant | Total seconds | Saturated seconds | Saturation percentage |
|---|---|---|---|
| A | 6283 | 119 | 1.894000% |
| B | 6283 | 117 | 1.862168% |
| C | 6283 | 176 | 2.801210% |
| D | 6283 | 1126 | 17.921375% |
Noise dominated data is calculated using 1-second bins in cleaned event files. If a bin has >2000 counts, and if more than 50% of those come from <1% of pixels, then it is considered to be noise-dominated and hence unusable.
| Quadrant | # 1 sec bins | Bins with >0 counts | Bins with >2000 counts | High rate bins dominated by noise | Noise dominated (total time) | Noise dominated (detector-on time) | Marked lightcurve |
|---|---|---|---|---|---|---|---|
| A | 7613 | 6283 | 18 | 18 | 0.24% | 0.29% | 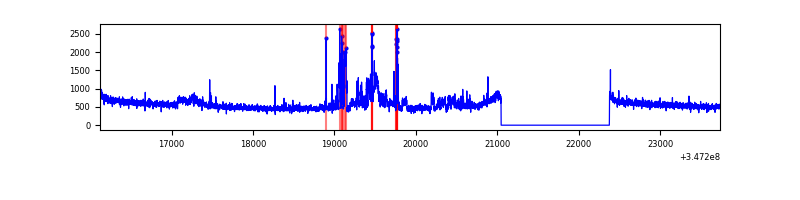 |
| B | 7613 | 6283 | 2 | 2 | 0.03% | 0.03% | 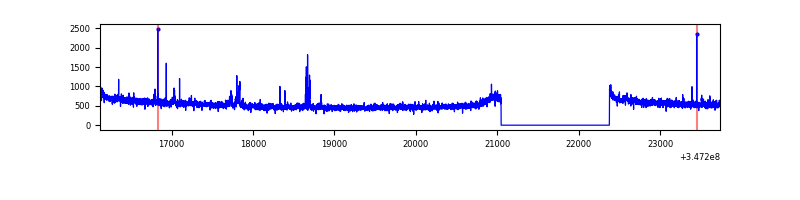 |
| C | 7613 | 6283 | 2 | 2 | 0.03% | 0.03% | 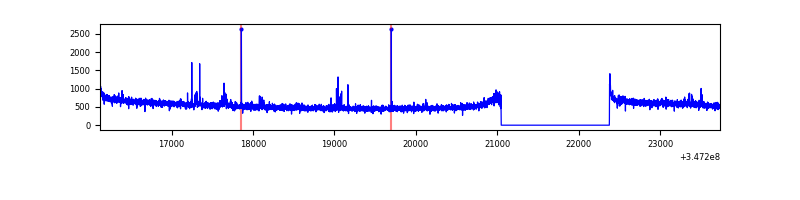 |
| D | 7613 | 6283 | 996 | 996 | 13.08% | 15.85% | 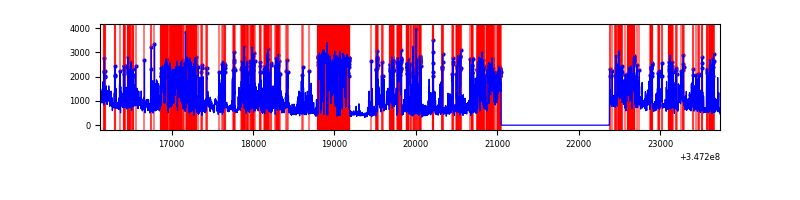 |
Top three noisy pixels from each quadrant. If the there are fewer than three noisy pixels in the level2.evt file, extra rows are filled as -1
| Pixel properties | Quadrant properties | ||||||
|---|---|---|---|---|---|---|---|
| Quadrant | DetID | PixID | Counts | Sigma | Mean | Median | Sigma |
| A | 15 | 174 | 444982 | 2696.56 | 843 | 829 | 164.7 |
| A | 12 | 96 | 10669 | 59.74 | 843 | 829 | 164.7 |
| A | 13 | 254 | 10387 | 58.03 | 843 | 829 | 164.7 |
| B | 10 | 245 | 50852 | 325.75 | 841 | 824 | 153.6 |
| B | 10 | 246 | 28850 | 182.49 | 841 | 824 | 153.6 |
| B | 12 | 111 | 17990 | 111.77 | 841 | 824 | 153.6 |
| C | 14 | 238 | 139312 | 723.74 | 833 | 839 | 191.3 |
| C | 7 | 220 | 46723 | 239.82 | 833 | 839 | 191.3 |
| C | 3 | 233 | 30981 | 157.54 | 833 | 839 | 191.3 |
| D | 1 | 52 | 3285131 | 18047.2 | 777 | 760 | 182.0 |
| D | 2 | 250 | 468916 | 2572.46 | 777 | 760 | 182.0 |
| D | 13 | 104 | 271981 | 1490.33 | 777 | 760 | 182.0 |
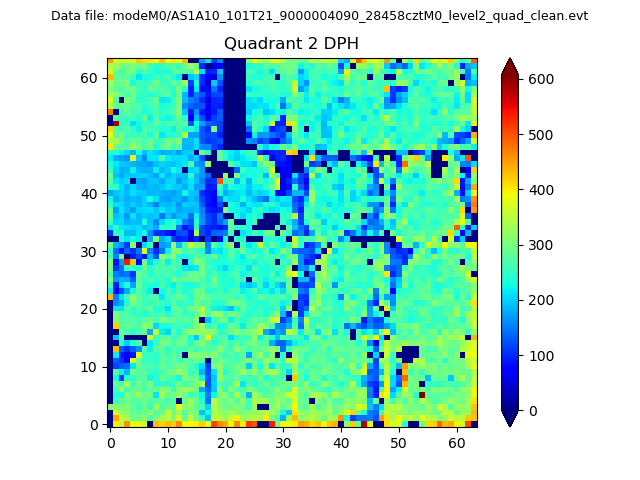
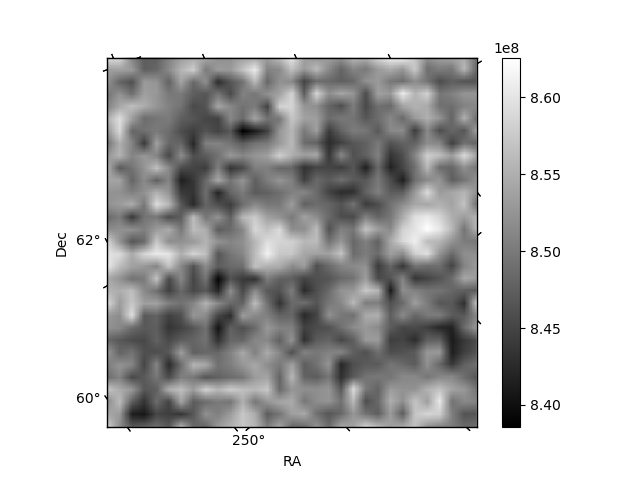
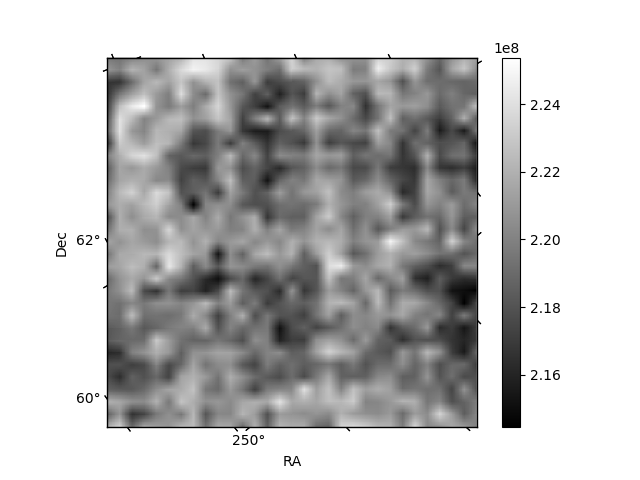
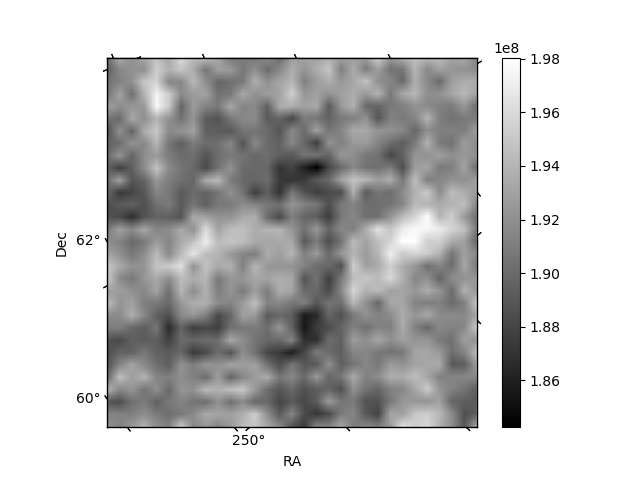
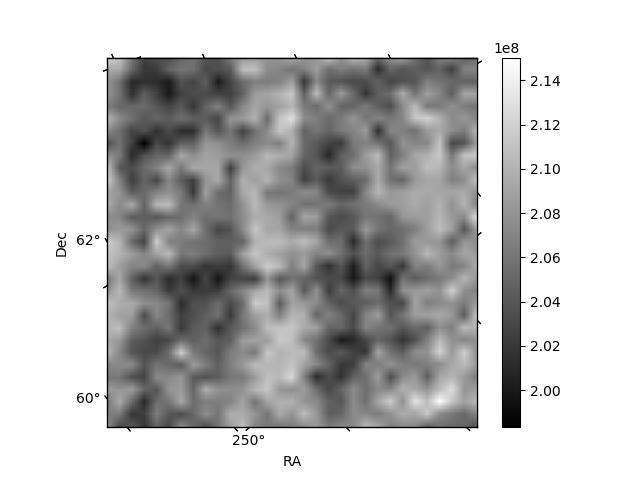
Histogram calculated using DETX and DETY for each event in the final _common_clean file
| Quadrant A | 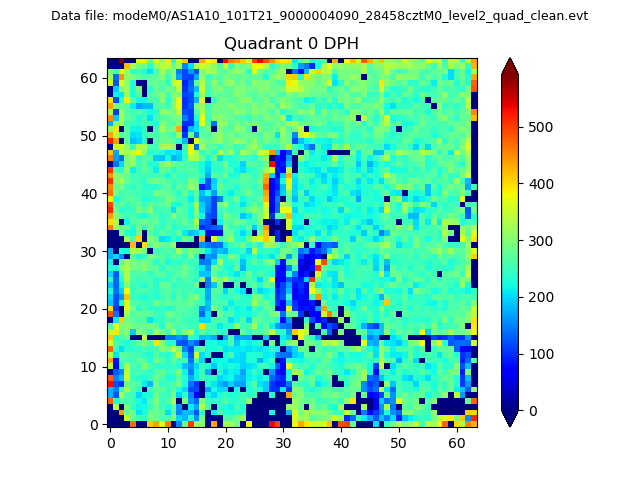 |
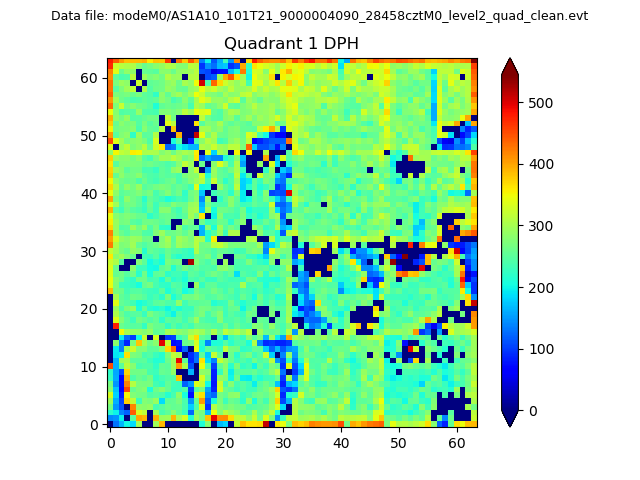 |
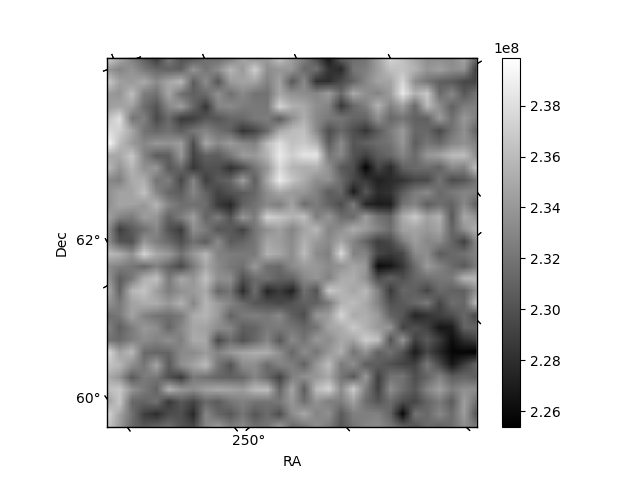
Quadrant B |
|---|---|---|---|
| Quadrant D | 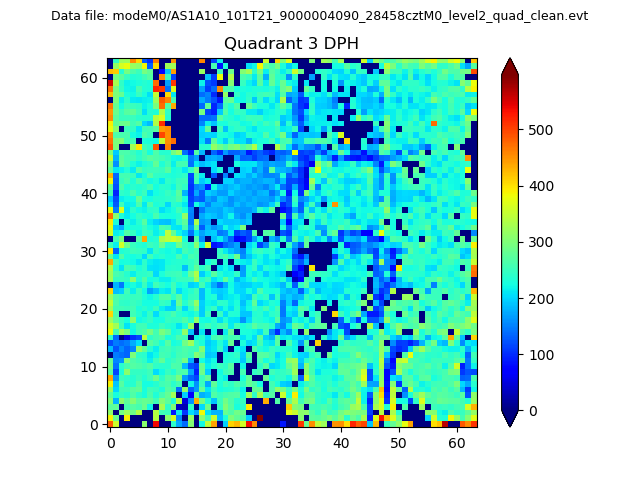 |
 |
Quadrant C |
| Plot type | Count rate plots | Images |
|---|---|---|
| Comparison with Poisson distribution Blue bars denote a histogram of data divided into 1 sec bins. Red curve is a Poisson curve with rate = median count rate of data. |
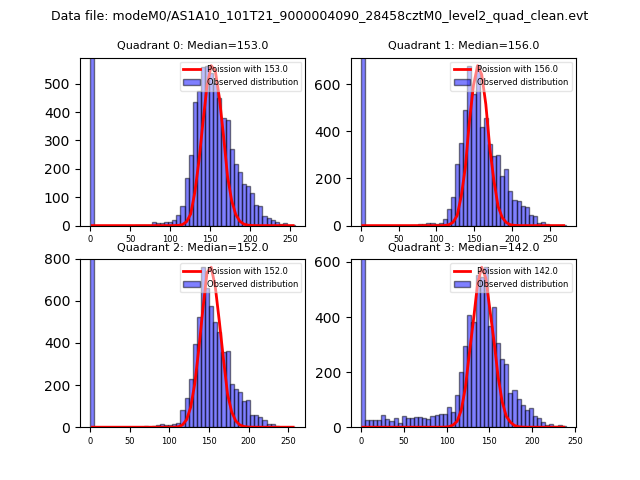 |
 |
| Quadrant-wise count rates Data is divided into 100 sec bins |
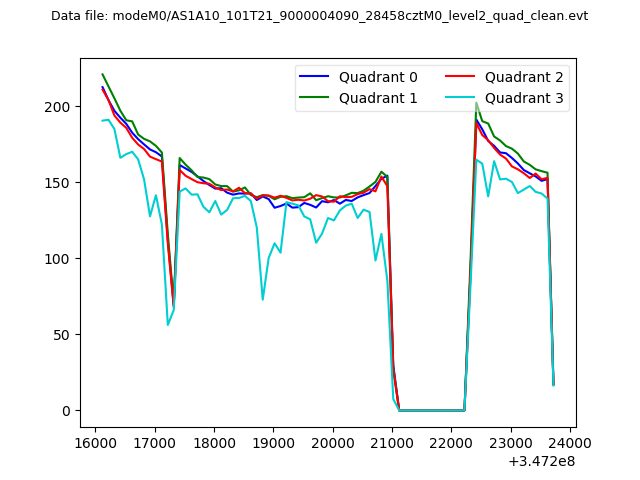 |
|
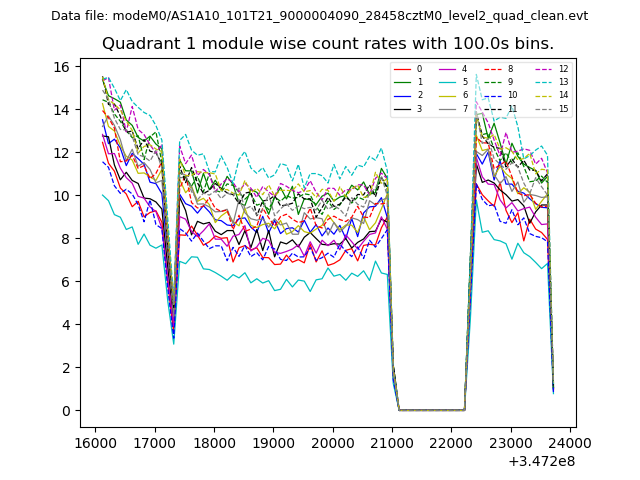
| Module-wise count rates for Quadrant A Data is divided into 100 sec bins |
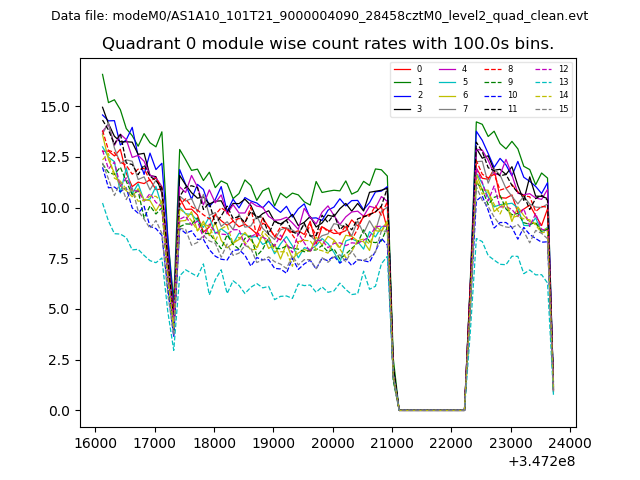 |
 |
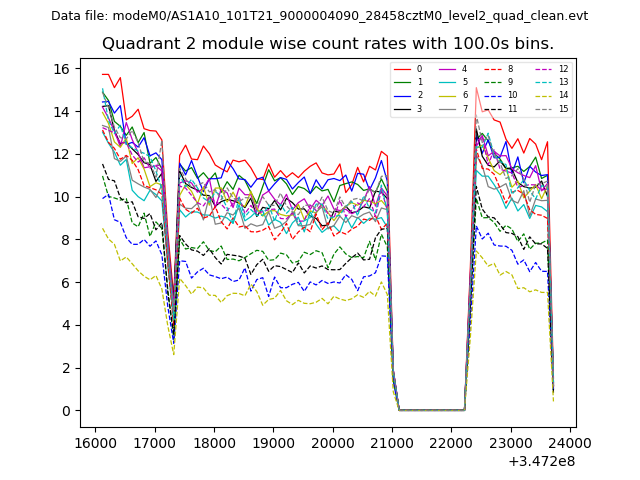
| Module-wise count rates for Quadrant B Data is divided into 100 sec bins |
 |
 |
| Module-wise count rates for Quadrant C Data is divided into 100 sec bins |
 |
 |
| Module-wise count rates for Quadrant D Data is divided into 100 sec bins |
 |
 |
| Parameter | Plot |
|---|---|
| CZT HV Monitor |  |
| D_VDD | 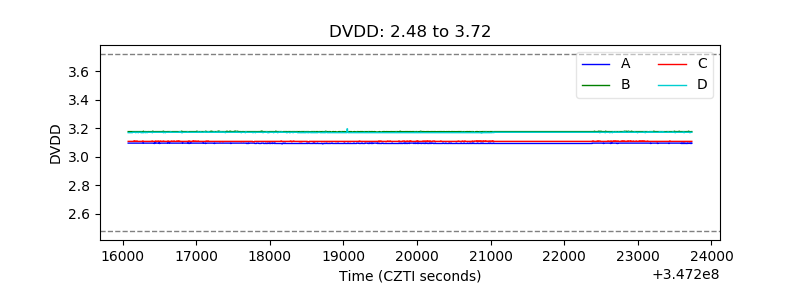 |
| Temperature 1 | 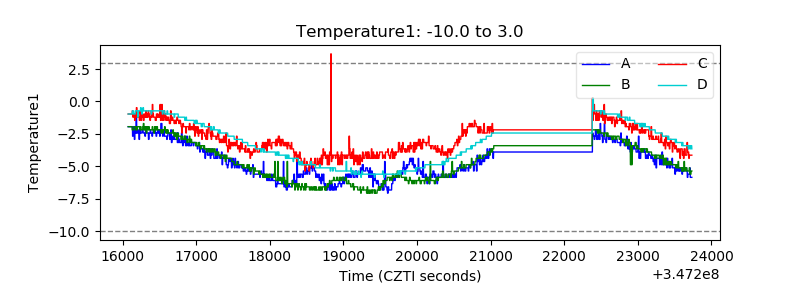 |
| Veto HV Monitor | 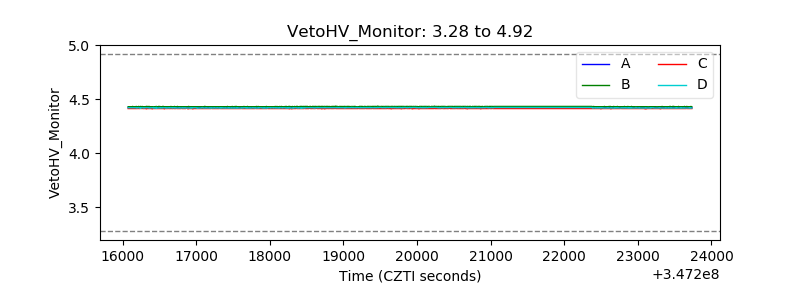 |
| Veto LLD | 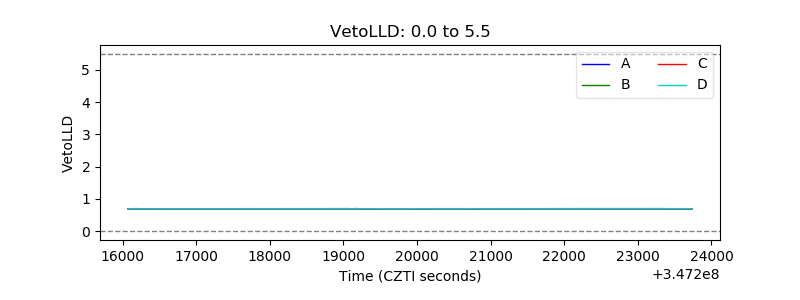 |
| Alpha Counter | 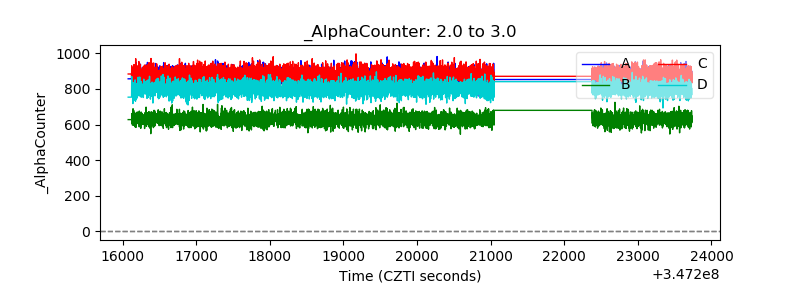 |
| _CPM_Rate | 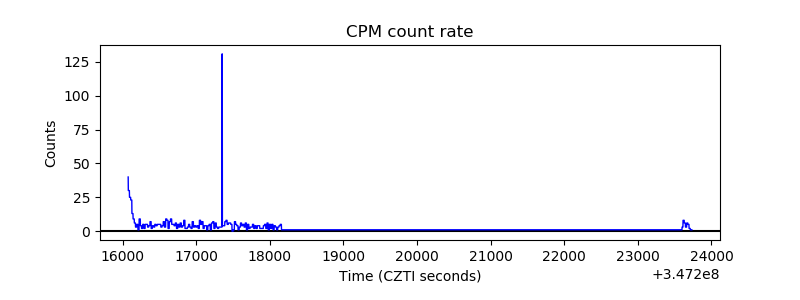 |
| CZT Counter | 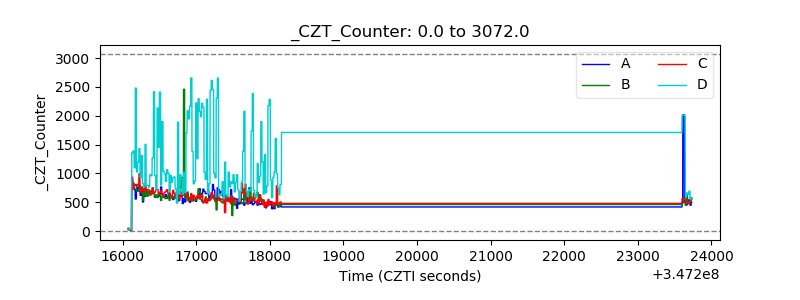 |
| +2.5 Volts monitor | 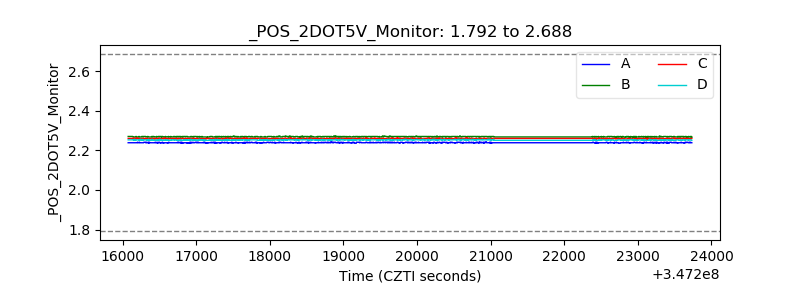 |
| +5 Volts monitor | 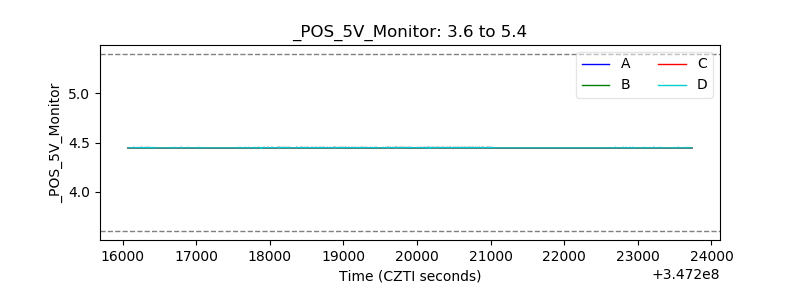 |
| _ROLL_ROT | 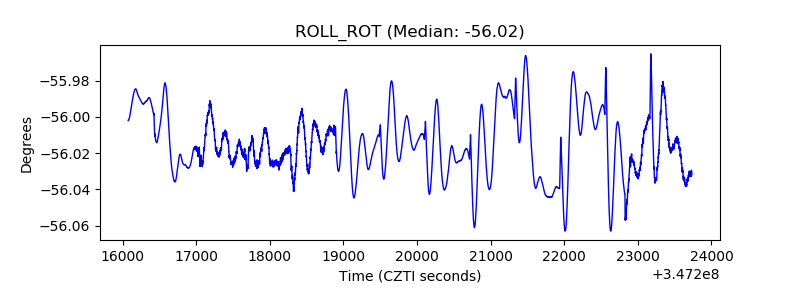 |
| _Roll_DEC | 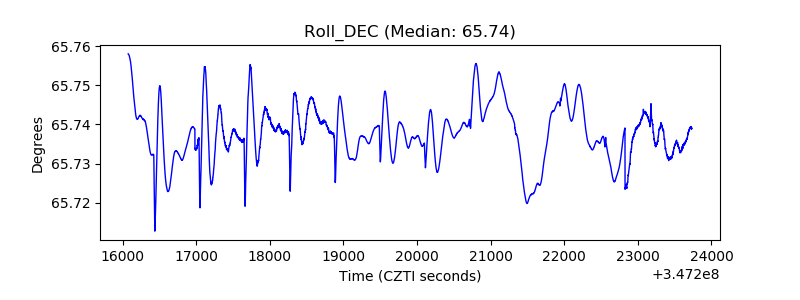 |
| _Roll_RA | 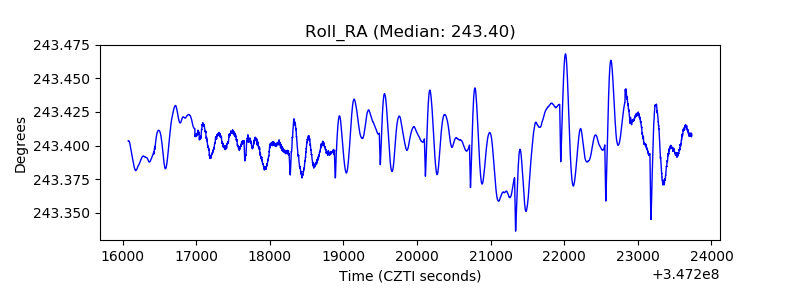 |
| Veto Counter | 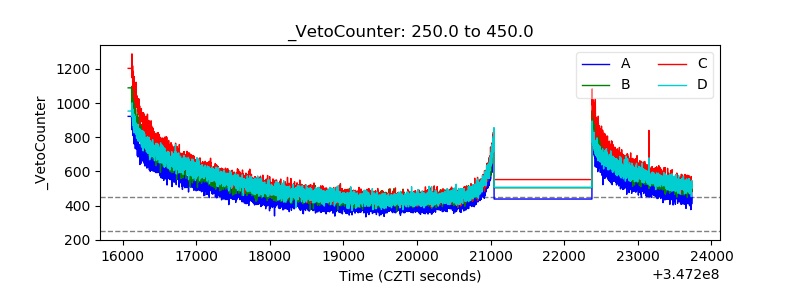 |