| Param | Original file | Final file |
|---|---|---|
| Filename | modeM0/AS1A10_101T21_9000004090_28461cztM0_level2.evt | modeM0/AS1A10_101T21_9000004090_28461cztM0_level2_quad_clean.evt |
| Size (bytes) | 526,492,800 | 138,205,440 |
| Size | 502.1 MB | 131.8 MB |
| Events in quadrant A | 3,386,198 | 934,923 |
| Events in quadrant B | 3,579,032 | 954,222 |
| Events in quadrant C | 3,378,549 | 922,377 |
| Events in quadrant D | 5,111,781 | 872,646 |
| Mode M0 | |||
|---|---|---|---|
| Quadrant | BADHDUFLAG | Total packets | Discarded packets |
| A | 0 | 14975 | 0 |
| B | 0 | 15348 | 0 |
| C | 0 | 14802 | 0 |
| D | 0 | 20166 | 0 |
| Mode M9 | |||
|---|---|---|---|
| Quadrant | BADHDUFLAG | Total packets | Discarded packets |
| A | 0 | 7 | 0 |
| B | 0 | 8 | 0 |
| C | 0 | 8 | 0 |
| D | 0 | 8 | 0 |
| Quadrant | Total seconds | Saturated seconds | Saturation percentage |
|---|---|---|---|
| A | 7209 | 26 | 0.360660% |
| B | 7209 | 60 | 0.832293% |
| C | 7209 | 70 | 0.971008% |
| D | 7209 | 399 | 5.534748% |
Noise dominated data is calculated using 1-second bins in cleaned event files. If a bin has >2000 counts, and if more than 50% of those come from <1% of pixels, then it is considered to be noise-dominated and hence unusable.
| Quadrant | # 1 sec bins | Bins with >0 counts | Bins with >2000 counts | High rate bins dominated by noise | Noise dominated (total time) | Noise dominated (detector-on time) | Marked lightcurve |
|---|---|---|---|---|---|---|---|
| A | 7874 | 7210 | 5 | 5 | 0.06% | 0.07% | 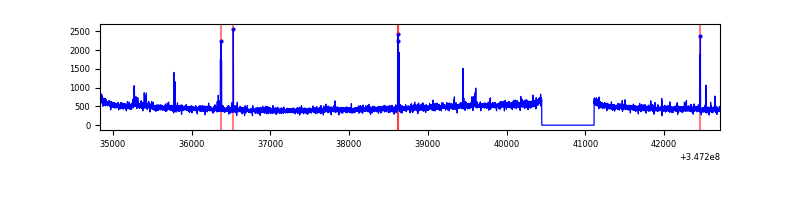 |
| B | 7874 | 7210 | 16 | 16 | 0.20% | 0.22% | 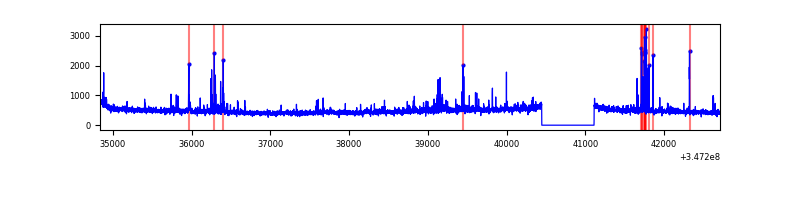 |
| C | 7874 | 7210 | 0 | 0 | 0.00% | 0.00% | 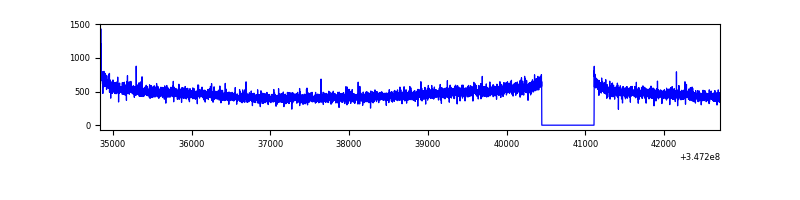 |
| D | 7874 | 7210 | 298 | 298 | 3.78% | 4.13% | 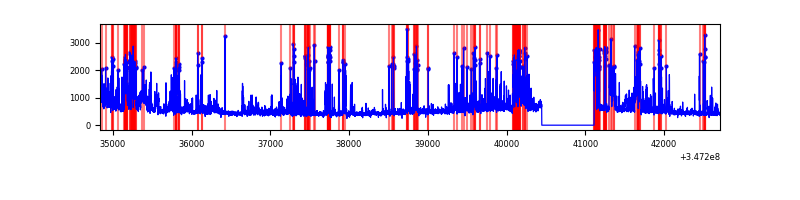 |
Top three noisy pixels from each quadrant. If the there are fewer than three noisy pixels in the level2.evt file, extra rows are filled as -1
| Pixel properties | Quadrant properties | ||||||
|---|---|---|---|---|---|---|---|
| Quadrant | DetID | PixID | Counts | Sigma | Mean | Median | Sigma |
| A | 15 | 174 | 41208 | 235.99 | 852 | 834 | 171.1 |
| A | 15 | 169 | 29081 | 165.11 | 852 | 834 | 171.1 |
| A | 12 | 96 | 26805 | 151.8 | 852 | 834 | 171.1 |
| B | 10 | 245 | 178774 | 1111.57 | 848 | 825 | 160.1 |
| B | 0 | 230 | 26370 | 159.57 | 848 | 825 | 160.1 |
| B | 5 | 255 | 24539 | 148.13 | 848 | 825 | 160.1 |
| C | 14 | 238 | 134798 | 694.12 | 827 | 832 | 193.0 |
| C | 3 | 233 | 15229 | 74.59 | 827 | 832 | 193.0 |
| C | 13 | 61 | 5643 | 24.92 | 827 | 832 | 193.0 |
| D | 1 | 52 | 1131146 | 5916.35 | 807 | 788 | 191.1 |
| D | 8 | 195 | 384915 | 2010.54 | 807 | 788 | 191.1 |
| D | 13 | 104 | 175434 | 914.1 | 807 | 788 | 191.1 |
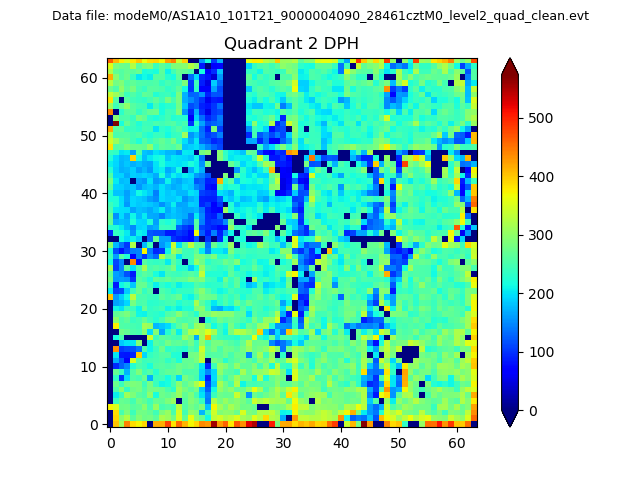
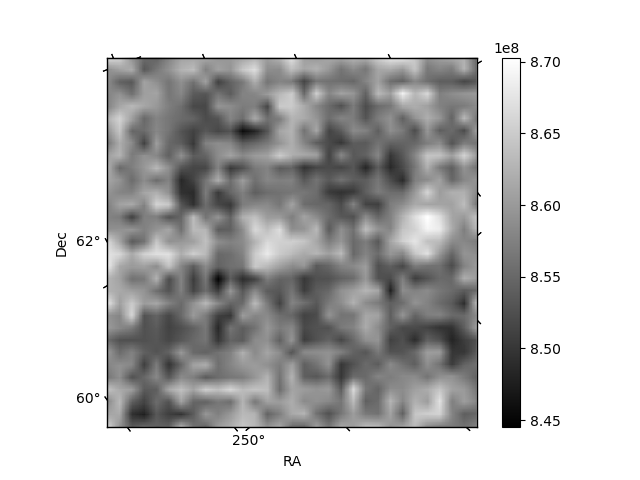
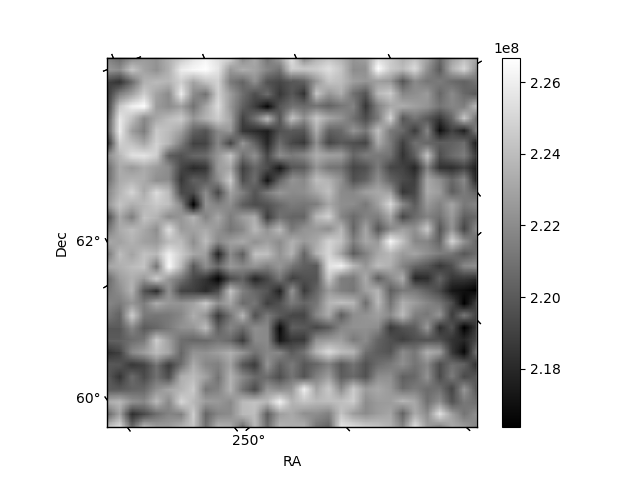
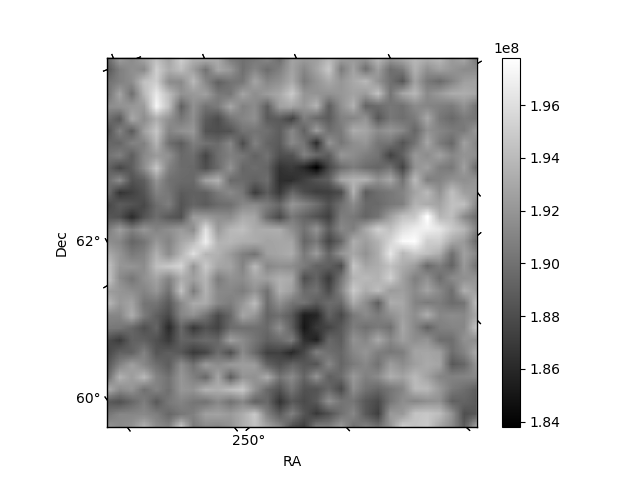
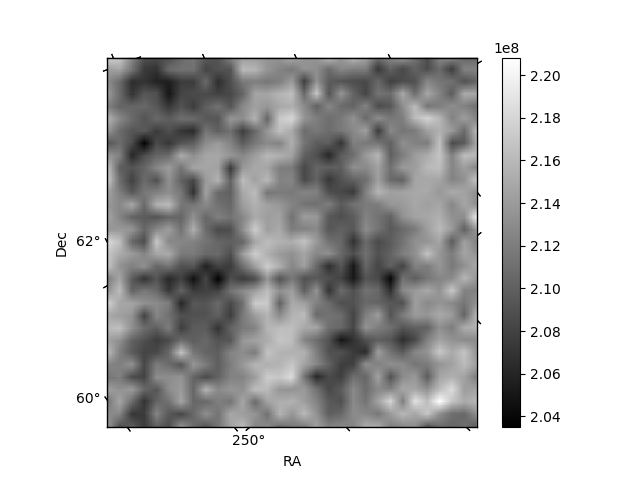
Histogram calculated using DETX and DETY for each event in the final _common_clean file
| Quadrant A | 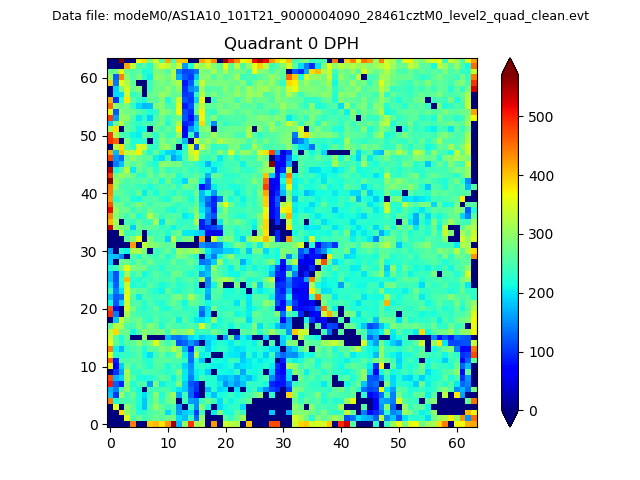 |
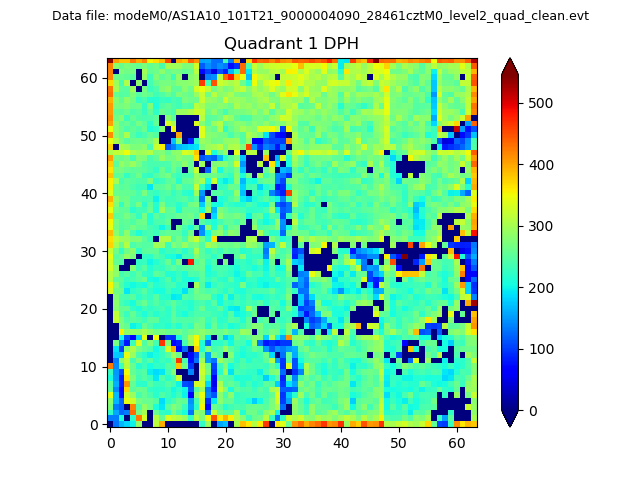 |
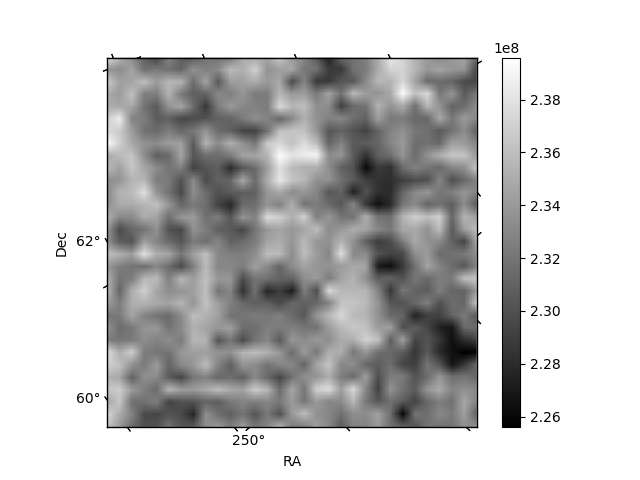
Quadrant B |
|---|---|---|---|
| Quadrant D | 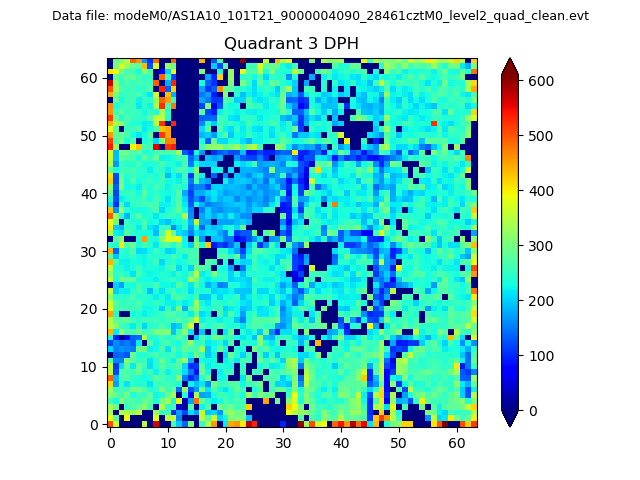 |
 |
Quadrant C |
| Plot type | Count rate plots | Images |
|---|---|---|
| Comparison with Poisson distribution Blue bars denote a histogram of data divided into 1 sec bins. Red curve is a Poisson curve with rate = median count rate of data. |
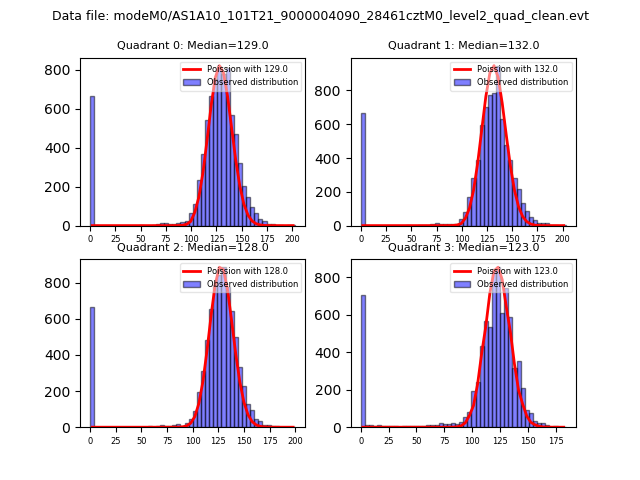 |
 |
| Quadrant-wise count rates Data is divided into 100 sec bins |
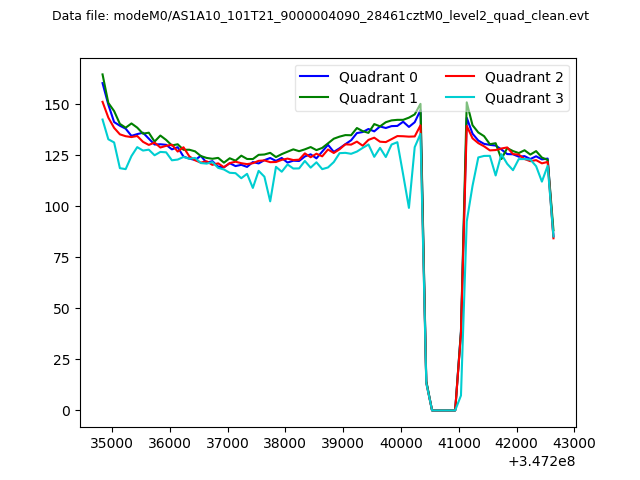 |
|
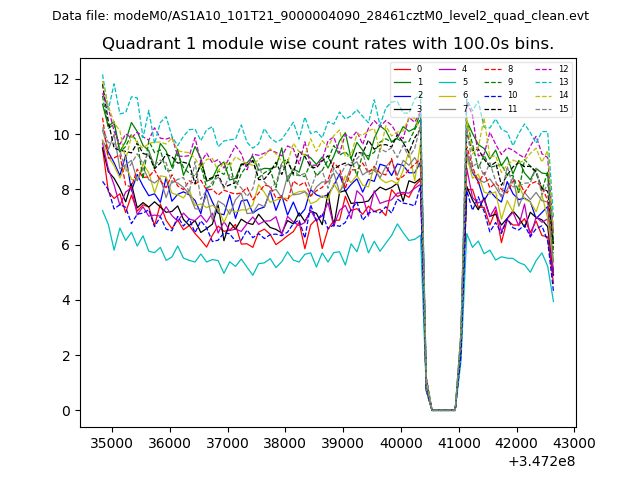
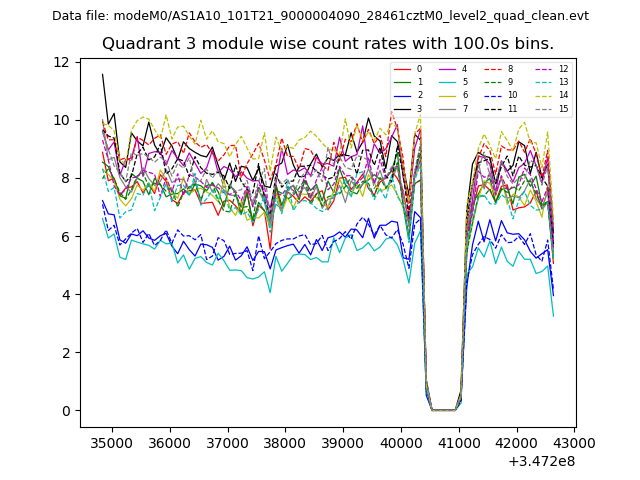
| Module-wise count rates for Quadrant A Data is divided into 100 sec bins |
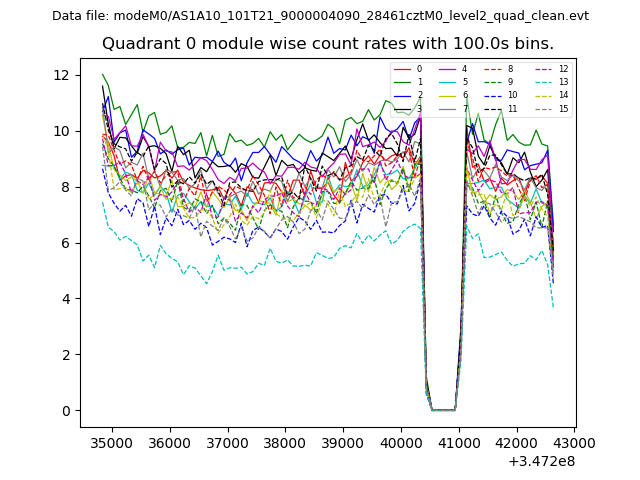 |
 |
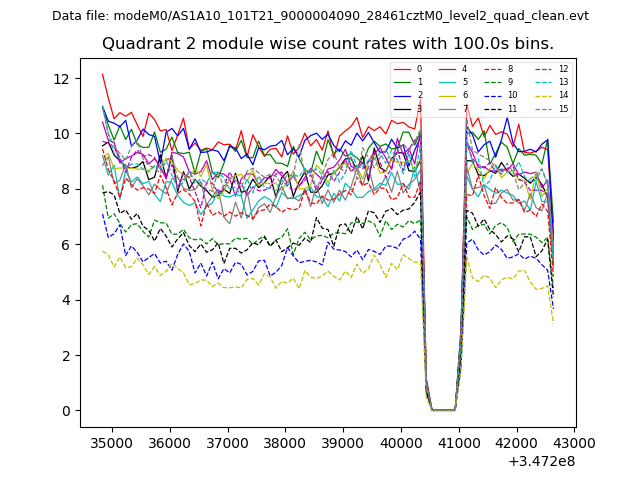
| Module-wise count rates for Quadrant B Data is divided into 100 sec bins |
 |
 |
| Module-wise count rates for Quadrant C Data is divided into 100 sec bins |
 |
 |
| Module-wise count rates for Quadrant D Data is divided into 100 sec bins |
 |
 |
| Parameter | Plot |
|---|---|
| CZT HV Monitor | 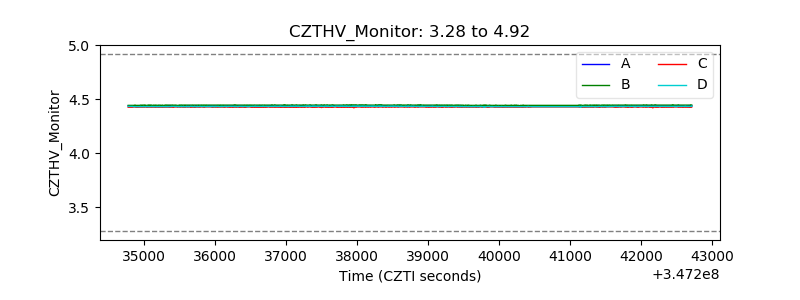 |
| D_VDD | 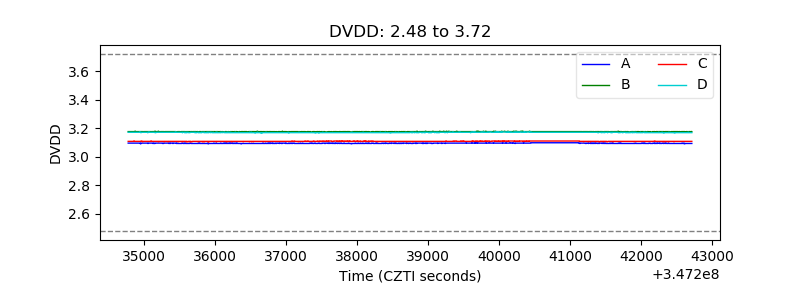 |
| Temperature 1 | 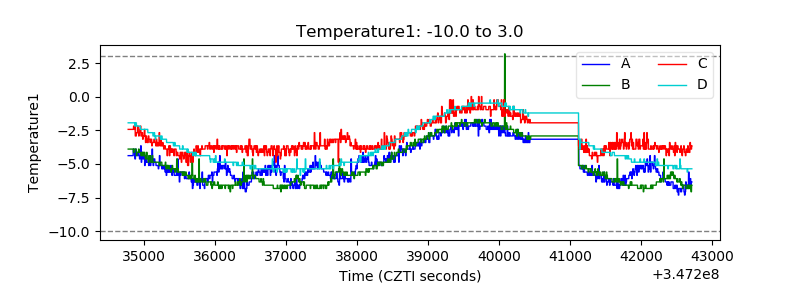 |
| Veto HV Monitor | 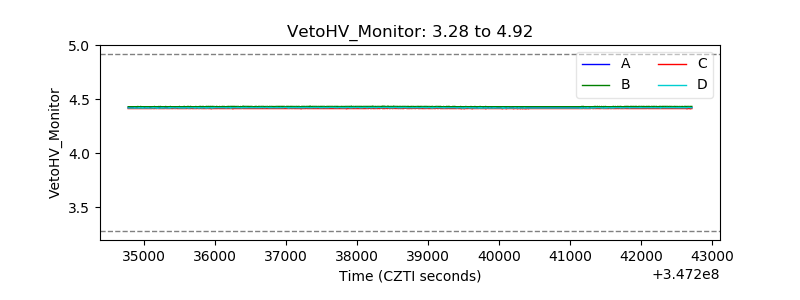 |
| Veto LLD | 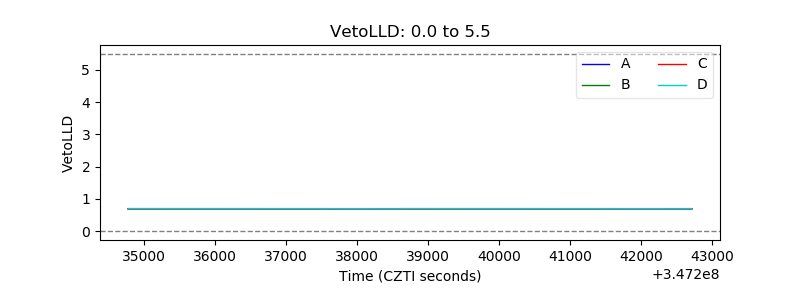 |
| Alpha Counter |  |
| _CPM_Rate |  |
| CZT Counter | 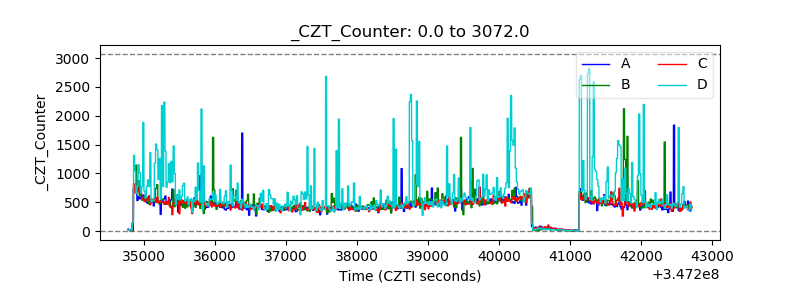 |
| +2.5 Volts monitor |  |
| +5 Volts monitor |  |
| _ROLL_ROT | 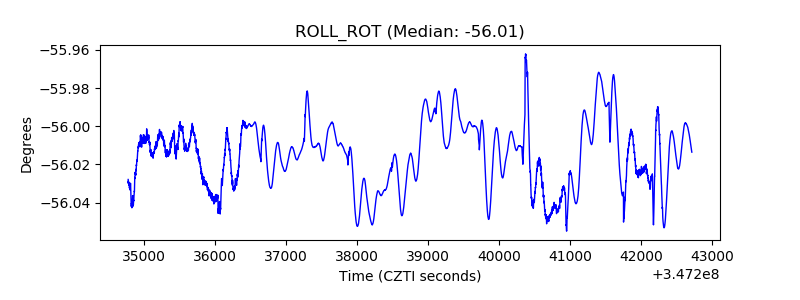 |
| _Roll_DEC | 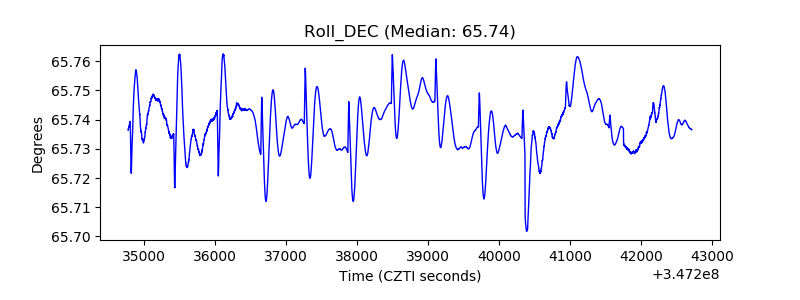 |
| _Roll_RA | 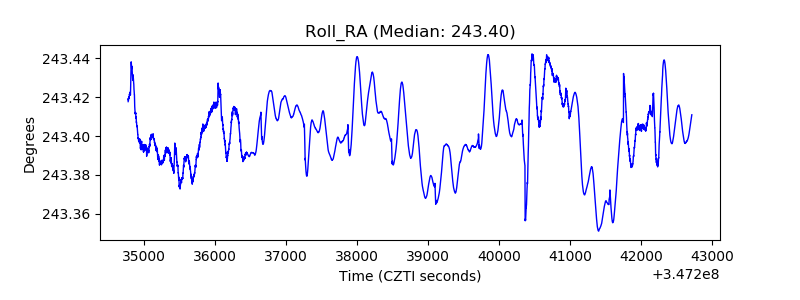 |
| Veto Counter | 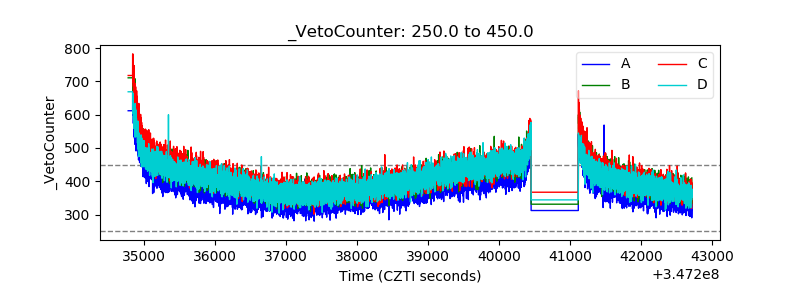 |