| Param | Original file | Final file |
|---|---|---|
| Filename | modeM0/AS1A10_101T21_9000004090_28462cztM0_level2.evt | modeM0/AS1A10_101T21_9000004090_28462cztM0_level2_quad_clean.evt |
| Size (bytes) | 621,296,640 | 148,962,240 |
| Size | 592.5 MB | 142.1 MB |
| Events in quadrant A | 4,435,626 | 1,004,235 |
| Events in quadrant B | 3,942,697 | 1,030,267 |
| Events in quadrant C | 3,752,799 | 995,399 |
| Events in quadrant D | 6,148,095 | 930,975 |
| Mode M0 | |||
|---|---|---|---|
| Quadrant | BADHDUFLAG | Total packets | Discarded packets |
| A | 0 | 18482 | 0 |
| B | 0 | 17056 | 0 |
| C | 0 | 16389 | 0 |
| D | 0 | 23913 | 0 |
| Mode M9 | |||
|---|---|---|---|
| Quadrant | BADHDUFLAG | Total packets | Discarded packets |
| A | 0 | 10 | 0 |
| B | 0 | 10 | 0 |
| C | 0 | 10 | 0 |
| D | 0 | 10 | 0 |
| Quadrant | Total seconds | Saturated seconds | Saturation percentage |
|---|---|---|---|
| A | 7925 | 131 | 1.652997% |
| B | 7926 | 76 | 0.958870% |
| C | 7926 | 85 | 1.072420% |
| D | 7926 | 523 | 6.598536% |
Noise dominated data is calculated using 1-second bins in cleaned event files. If a bin has >2000 counts, and if more than 50% of those come from <1% of pixels, then it is considered to be noise-dominated and hence unusable.
| Quadrant | # 1 sec bins | Bins with >0 counts | Bins with >2000 counts | High rate bins dominated by noise | Noise dominated (total time) | Noise dominated (detector-on time) | Marked lightcurve |
|---|---|---|---|---|---|---|---|
| A | 8890 | 7927 | 92 | 92 | 1.03% | 1.16% | 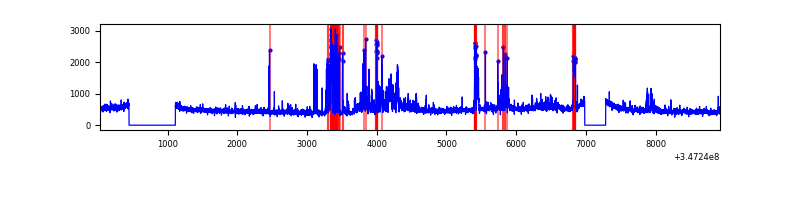 |
| B | 8891 | 7928 | 16 | 16 | 0.18% | 0.20% | 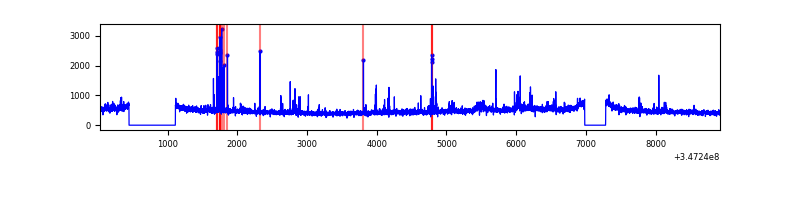 |
| C | 8891 | 7927 | 0 | 0 | 0.00% | 0.00% | 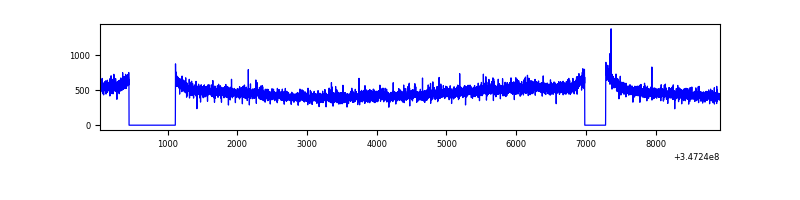 |
| D | 8891 | 7928 | 453 | 453 | 5.10% | 5.71% | 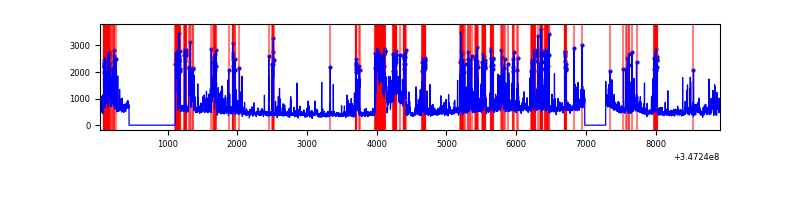 |
Top three noisy pixels from each quadrant. If the there are fewer than three noisy pixels in the level2.evt file, extra rows are filled as -1
| Pixel properties | Quadrant properties | ||||||
|---|---|---|---|---|---|---|---|
| Quadrant | DetID | PixID | Counts | Sigma | Mean | Median | Sigma |
| A | 15 | 174 | 791416 | 4209.58 | 937 | 918 | 187.8 |
| A | 13 | 254 | 13415 | 66.55 | 937 | 918 | 187.8 |
| A | 12 | 96 | 10936 | 53.35 | 937 | 918 | 187.8 |
| B | 10 | 245 | 191640 | 1069.88 | 939 | 914 | 178.3 |
| B | 0 | 230 | 41069 | 225.25 | 939 | 914 | 178.3 |
| B | 12 | 111 | 22552 | 121.38 | 939 | 914 | 178.3 |
| C | 14 | 238 | 147053 | 681.87 | 914 | 918 | 214.3 |
| C | 3 | 233 | 37679 | 171.53 | 914 | 918 | 214.3 |
| C | 13 | 61 | 6214 | 24.71 | 914 | 918 | 214.3 |
| D | 1 | 52 | 1264934 | 5992.24 | 888 | 864 | 211.0 |
| D | 8 | 195 | 853134 | 4040.13 | 888 | 864 | 211.0 |
| D | 12 | 233 | 227912 | 1076.31 | 888 | 864 | 211.0 |
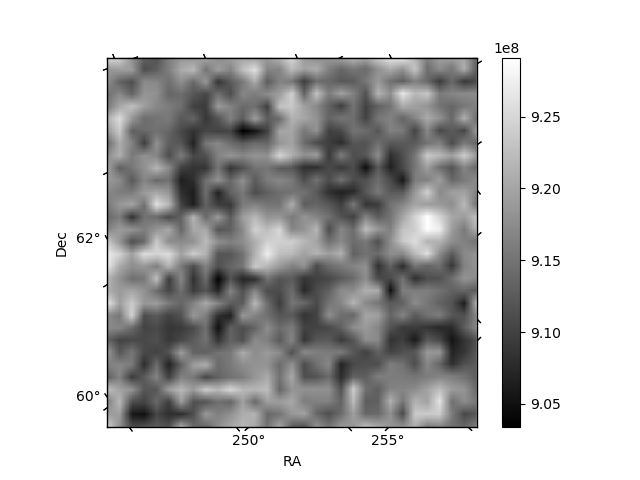
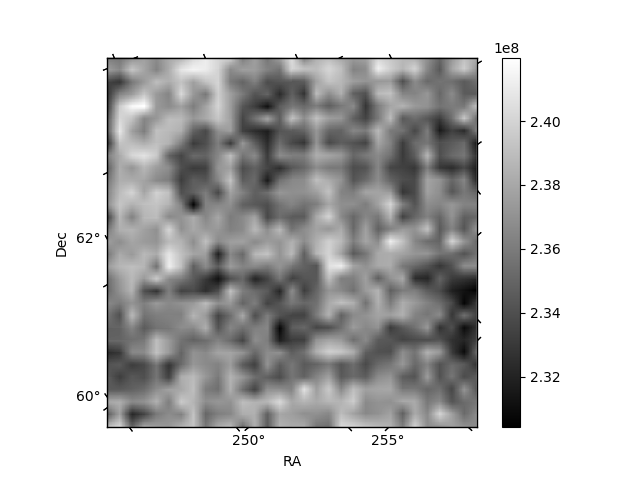
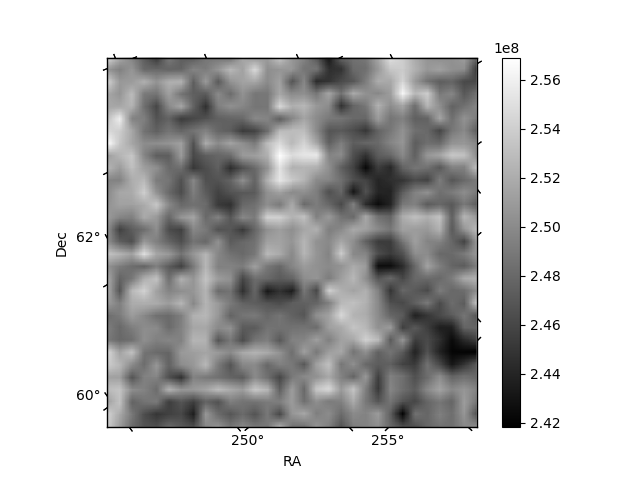
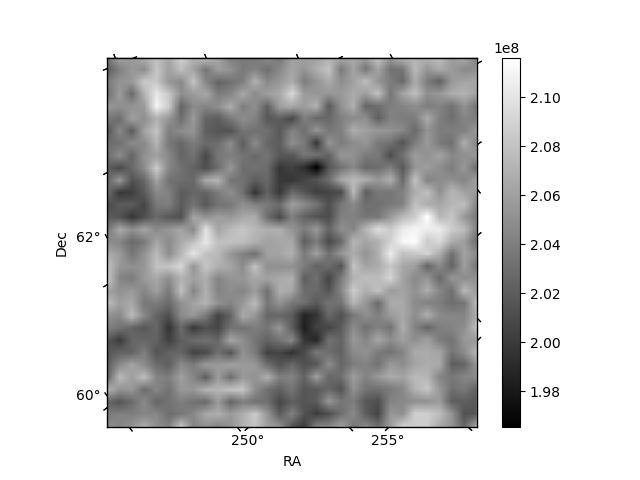
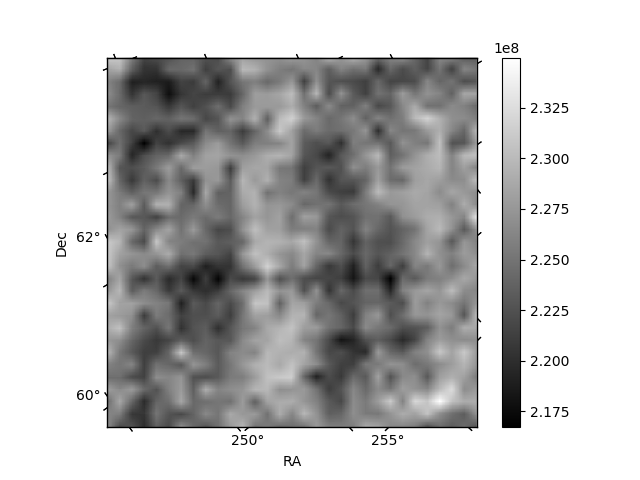
Histogram calculated using DETX and DETY for each event in the final _common_clean file
| Quadrant A | 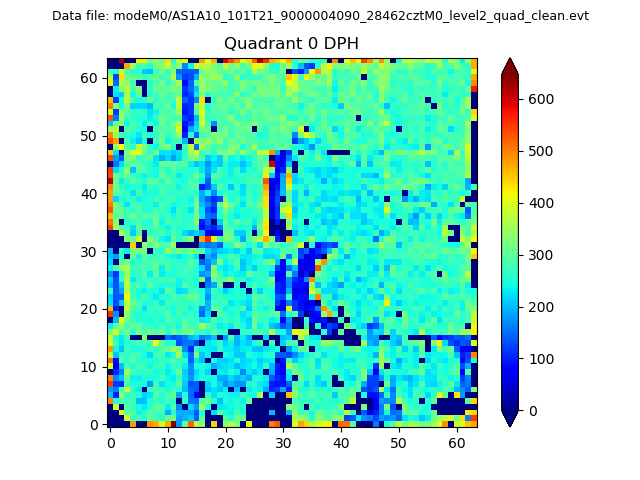 |
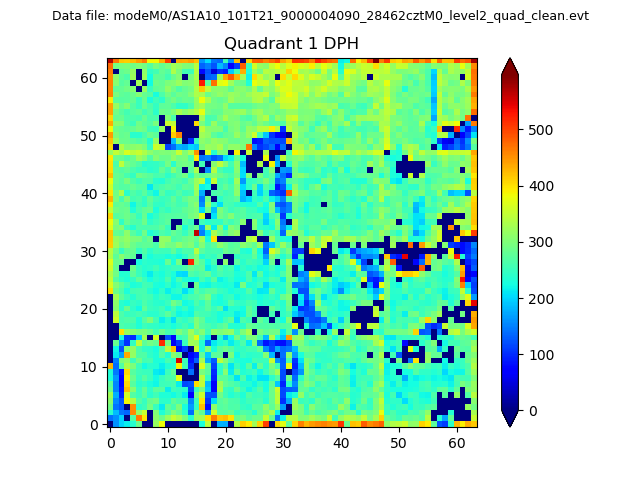 |
Quadrant B |
|---|---|---|---|
| Quadrant D | 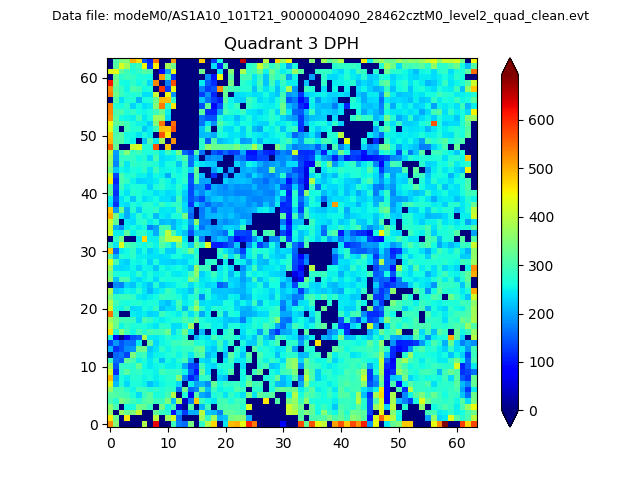 |
 |
Quadrant C |
| Plot type | Count rate plots | Images |
|---|---|---|
| Comparison with Poisson distribution Blue bars denote a histogram of data divided into 1 sec bins. Red curve is a Poisson curve with rate = median count rate of data. |
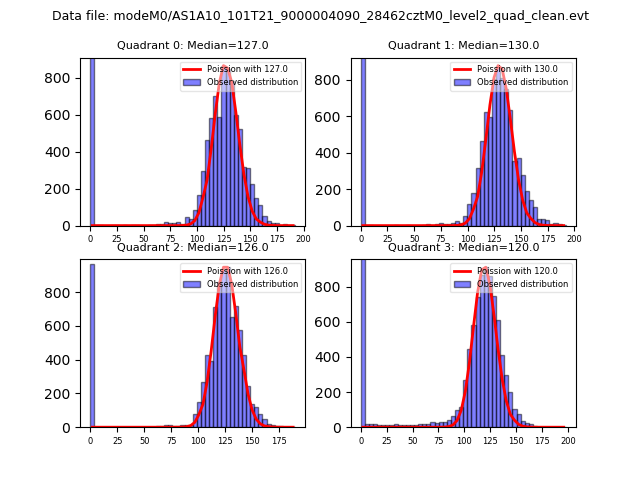 |
 |
| Quadrant-wise count rates Data is divided into 100 sec bins |
 |
|
| Module-wise count rates for Quadrant A Data is divided into 100 sec bins |
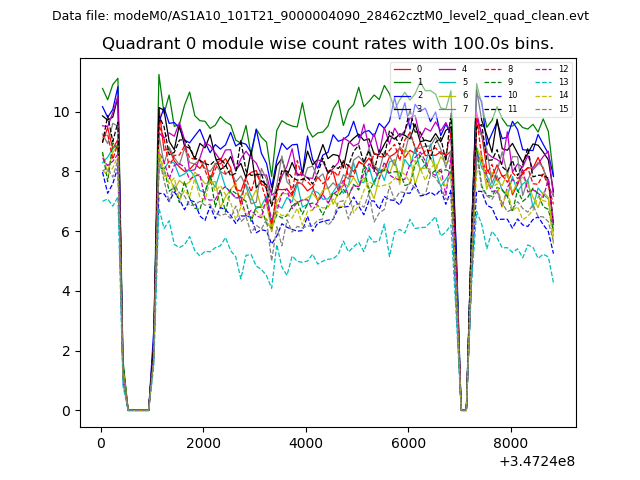 |
 |
| Module-wise count rates for Quadrant B Data is divided into 100 sec bins |
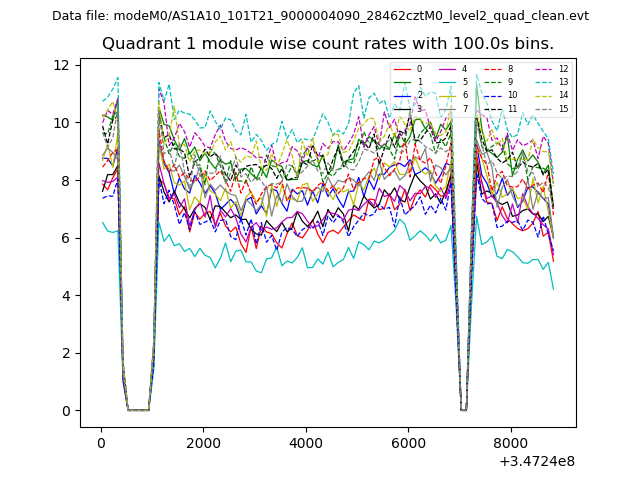 |
 |
| Module-wise count rates for Quadrant C Data is divided into 100 sec bins |
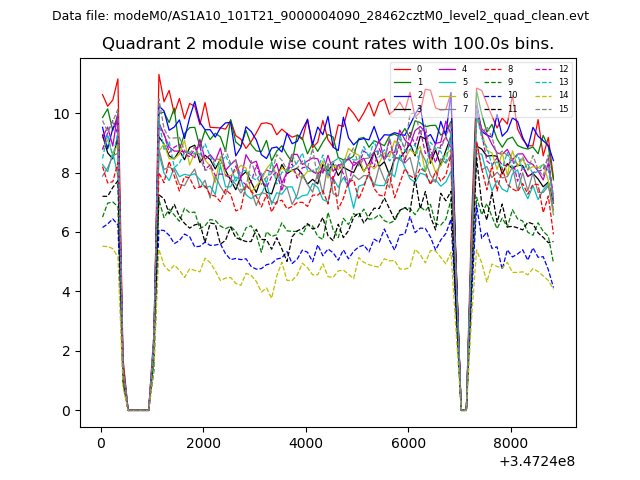 |
 |
| Module-wise count rates for Quadrant D Data is divided into 100 sec bins |
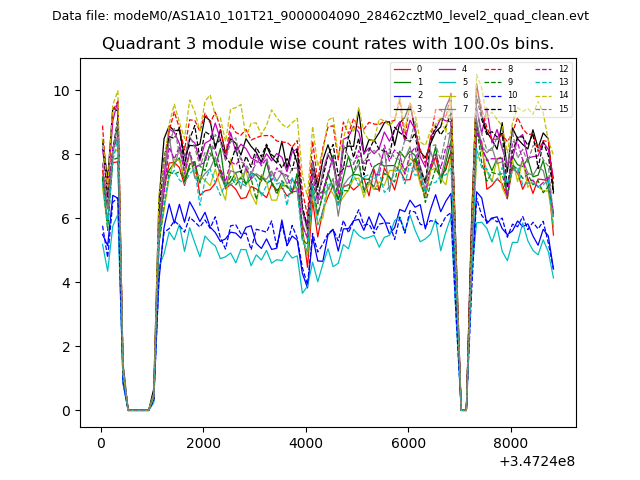 |
 |
| Parameter | Plot |
|---|---|
| CZT HV Monitor | 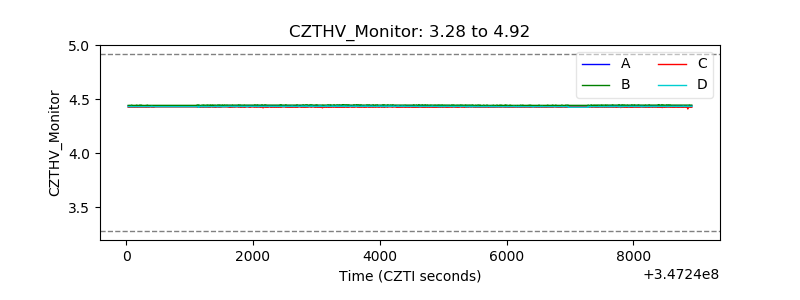 |
| D_VDD | 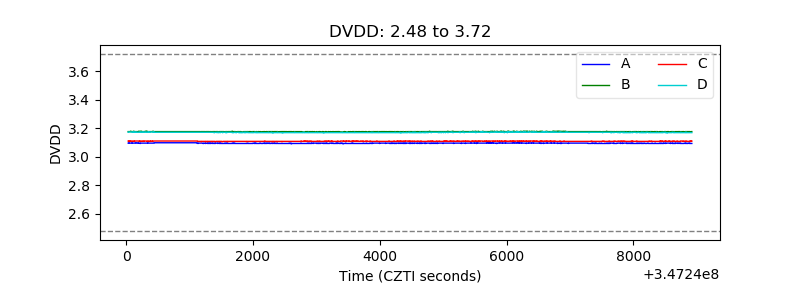 |
| Temperature 1 | 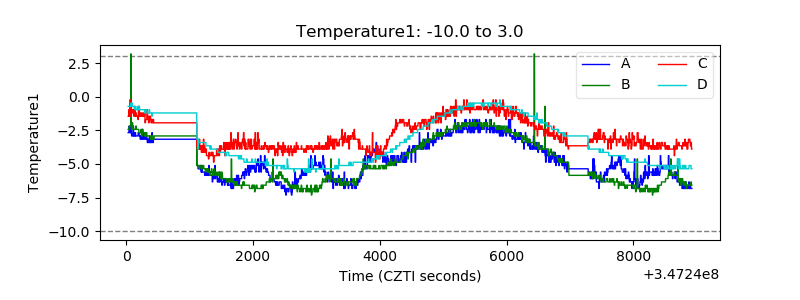 |
| Veto HV Monitor | 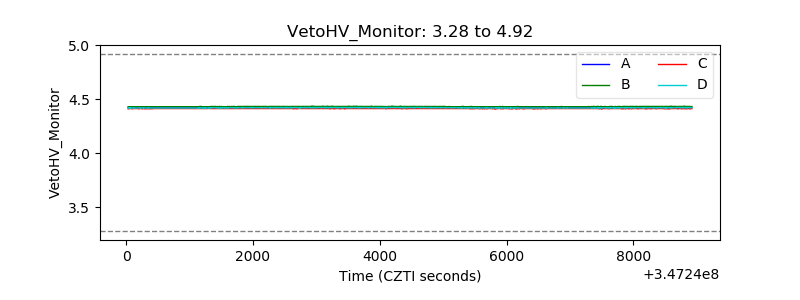 |
| Veto LLD |  |
| Alpha Counter | 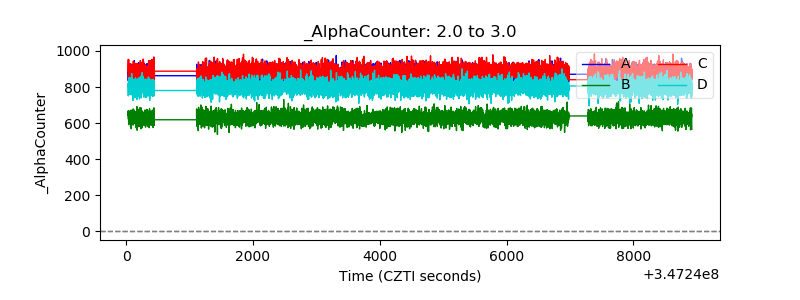 |
| _CPM_Rate | 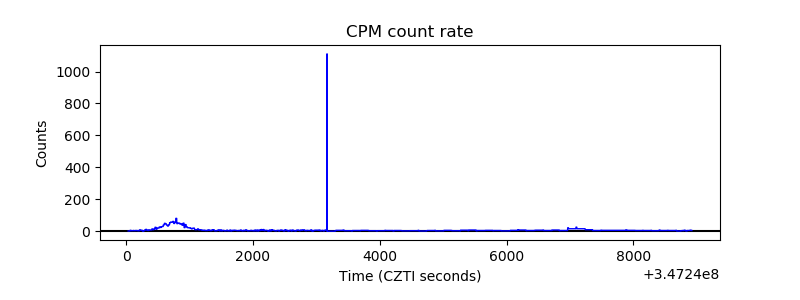 |
| CZT Counter | 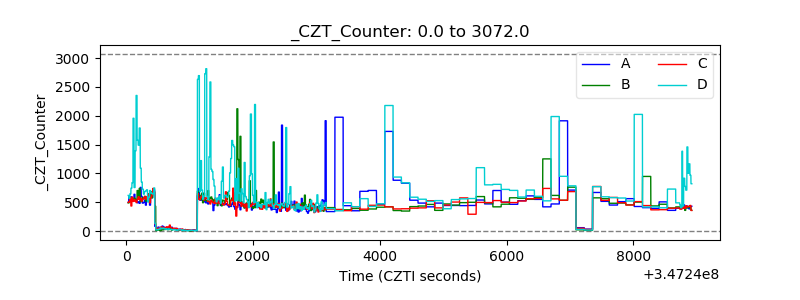 |
| +2.5 Volts monitor |  |
| +5 Volts monitor |  |
| _ROLL_ROT | 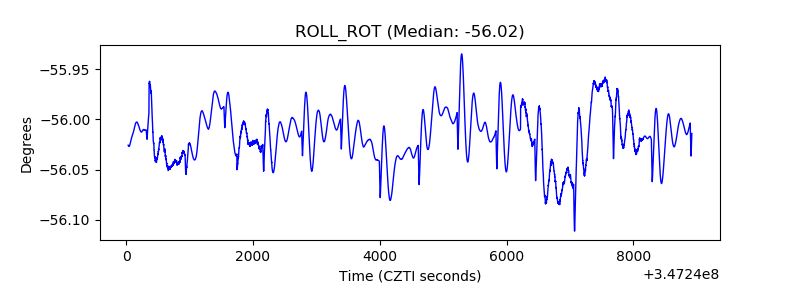 |
| _Roll_DEC | 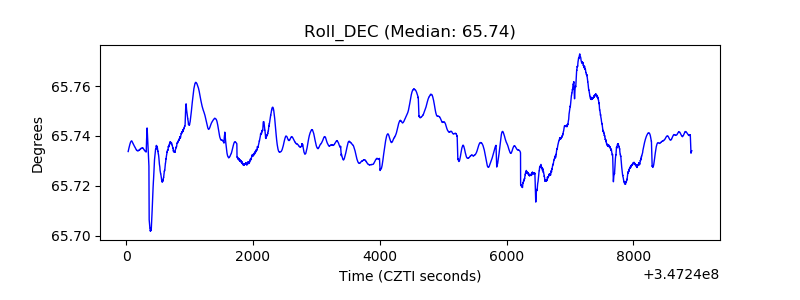 |
| _Roll_RA | 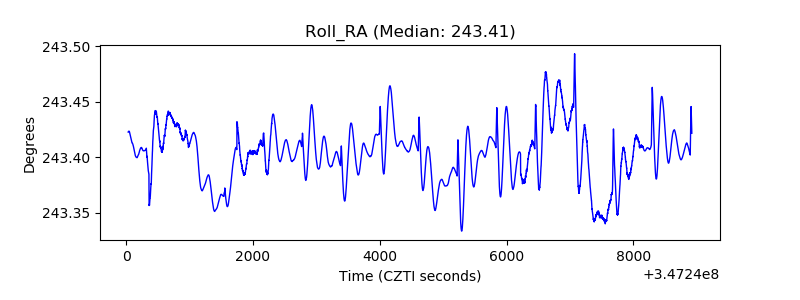 |
| Veto Counter | 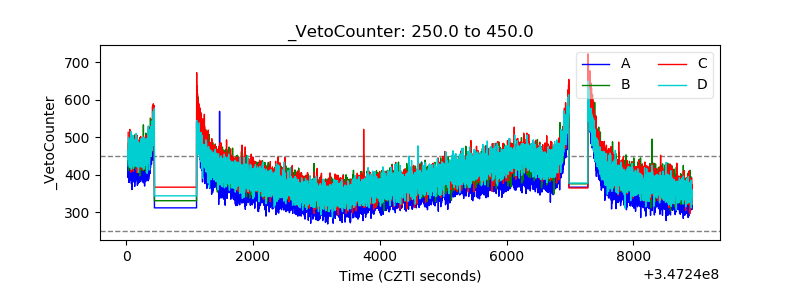 |