| Param | Original file | Final file |
|---|---|---|
| Filename | modeM0/AS1A10_101T21_9000004090_28463cztM0_level2.evt | modeM0/AS1A10_101T21_9000004090_28463cztM0_level2_quad_clean.evt |
| Size (bytes) | 690,252,480 | 155,718,720 |
| Size | 658.3 MB | 148.5 MB |
| Events in quadrant A | 4,488,494 | 1,050,399 |
| Events in quadrant B | 4,088,166 | 1,075,291 |
| Events in quadrant C | 4,006,695 | 1,038,489 |
| Events in quadrant D | 7,754,769 | 970,980 |
| Mode M0 | |||
|---|---|---|---|
| Quadrant | BADHDUFLAG | Total packets | Discarded packets |
| A | 0 | 19147 | 0 |
| B | 0 | 17695 | 0 |
| C | 0 | 17434 | 0 |
| D | 0 | 28911 | 0 |
| Mode M9 | |||
|---|---|---|---|
| Quadrant | BADHDUFLAG | Total packets | Discarded packets |
| A | 0 | 6 | 0 |
| B | 0 | 6 | 0 |
| C | 0 | 6 | 0 |
| D | 0 | 6 | 0 |
| Quadrant | Total seconds | Saturated seconds | Saturation percentage |
|---|---|---|---|
| A | 8368 | 172 | 2.055449% |
| B | 8369 | 104 | 1.242681% |
| C | 8369 | 115 | 1.374119% |
| D | 8369 | 717 | 8.567332% |
Noise dominated data is calculated using 1-second bins in cleaned event files. If a bin has >2000 counts, and if more than 50% of those come from <1% of pixels, then it is considered to be noise-dominated and hence unusable.
| Quadrant | # 1 sec bins | Bins with >0 counts | Bins with >2000 counts | High rate bins dominated by noise | Noise dominated (total time) | Noise dominated (detector-on time) | Marked lightcurve |
|---|---|---|---|---|---|---|---|
| A | 8943 | 8370 | 43 | 43 | 0.48% | 0.51% | 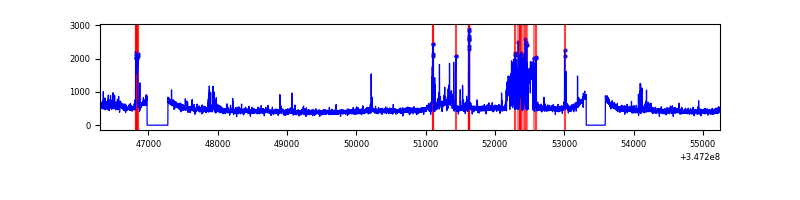 |
| B | 8944 | 8371 | 7 | 7 | 0.08% | 0.08% | 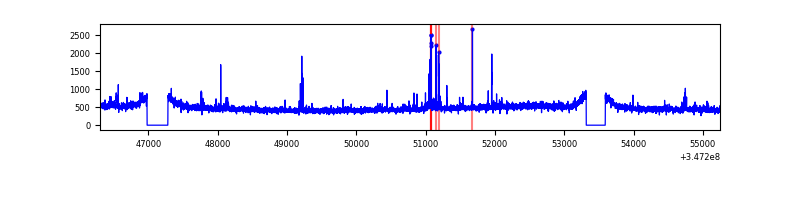 |
| C | 8944 | 8370 | 0 | 0 | 0.00% | 0.00% | 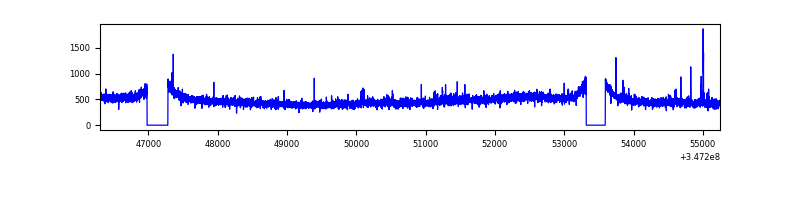 |
| D | 8944 | 8370 | 568 | 568 | 6.35% | 6.79% | 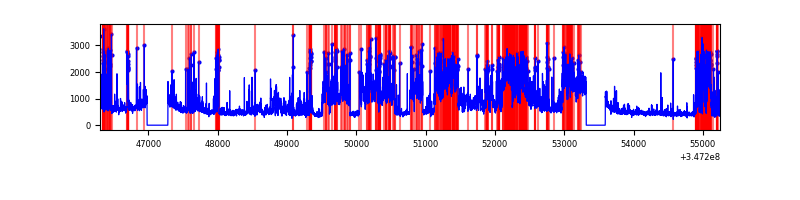 |
Top three noisy pixels from each quadrant. If the there are fewer than three noisy pixels in the level2.evt file, extra rows are filled as -1
| Pixel properties | Quadrant properties | ||||||
|---|---|---|---|---|---|---|---|
| Quadrant | DetID | PixID | Counts | Sigma | Mean | Median | Sigma |
| A | 15 | 174 | 636519 | 3183.82 | 995 | 975 | 199.6 |
| A | 13 | 254 | 13437 | 62.43 | 995 | 975 | 199.6 |
| A | 3 | 137 | 10041 | 45.42 | 995 | 975 | 199.6 |
| B | 10 | 245 | 98575 | 511.29 | 996 | 969 | 190.9 |
| B | 10 | 246 | 27162 | 137.2 | 996 | 969 | 190.9 |
| B | 0 | 230 | 24958 | 125.66 | 996 | 969 | 190.9 |
| C | 14 | 238 | 155576 | 678.98 | 968 | 972 | 227.7 |
| C | 3 | 233 | 42634 | 182.97 | 968 | 972 | 227.7 |
| C | 15 | 208 | 31712 | 135.0 | 968 | 972 | 227.7 |
| D | 8 | 195 | 2260539 | 9949.35 | 947 | 920 | 227.1 |
| D | 1 | 52 | 1031148 | 4536.21 | 947 | 920 | 227.1 |
| D | 13 | 104 | 402423 | 1767.86 | 947 | 920 | 227.1 |
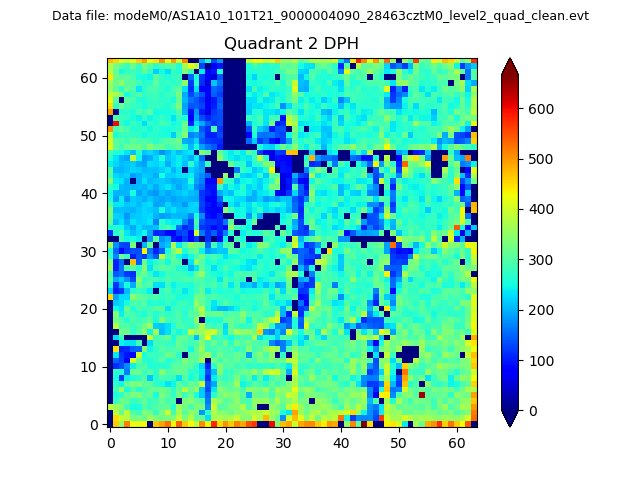
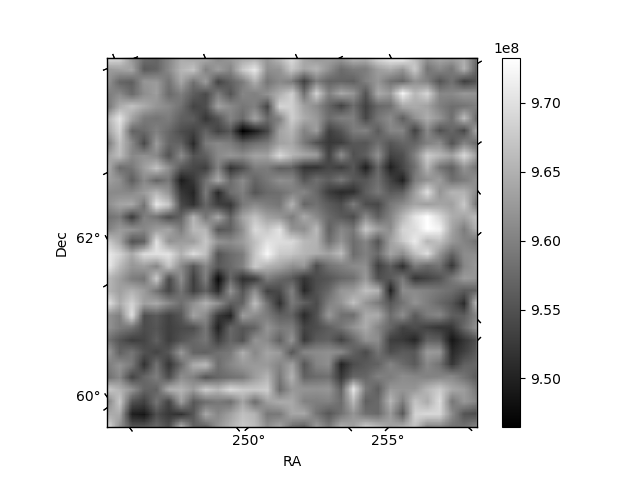
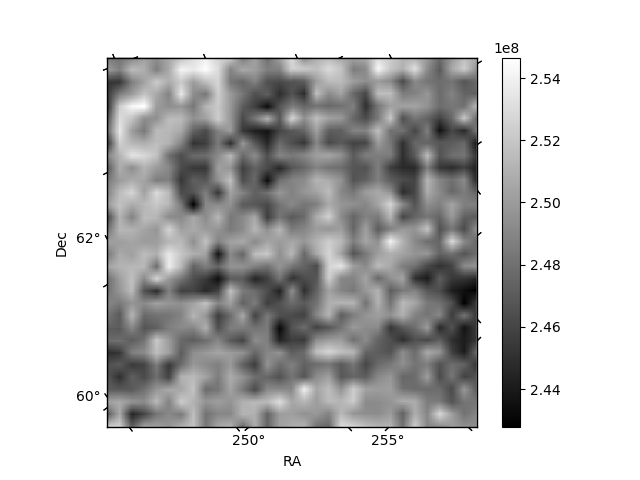
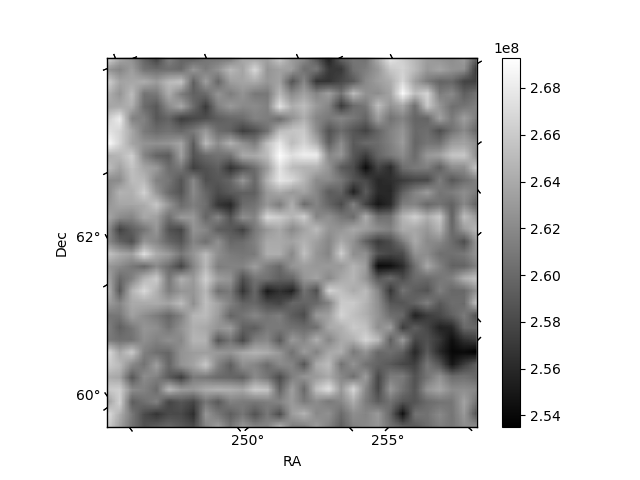
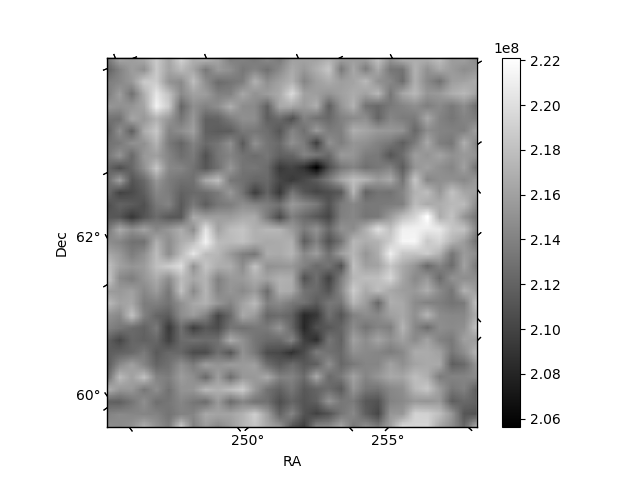
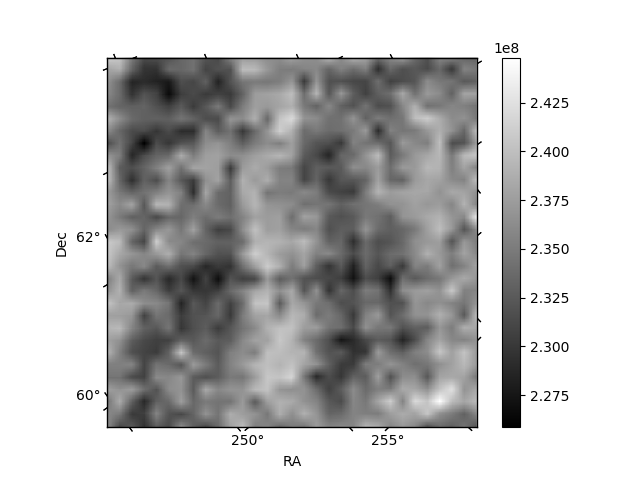
Histogram calculated using DETX and DETY for each event in the final _common_clean file
| Quadrant A | 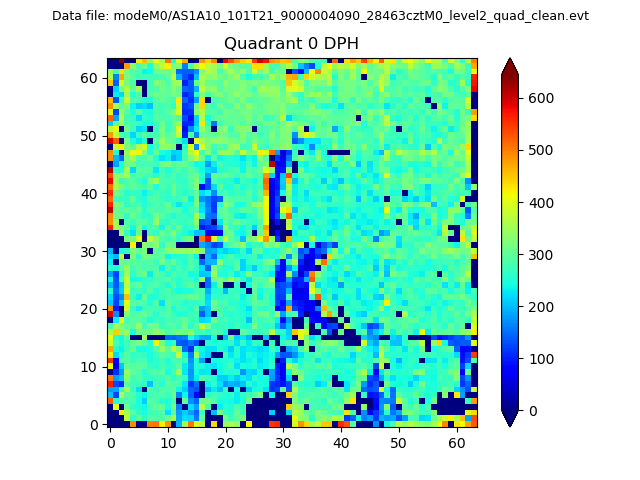 |
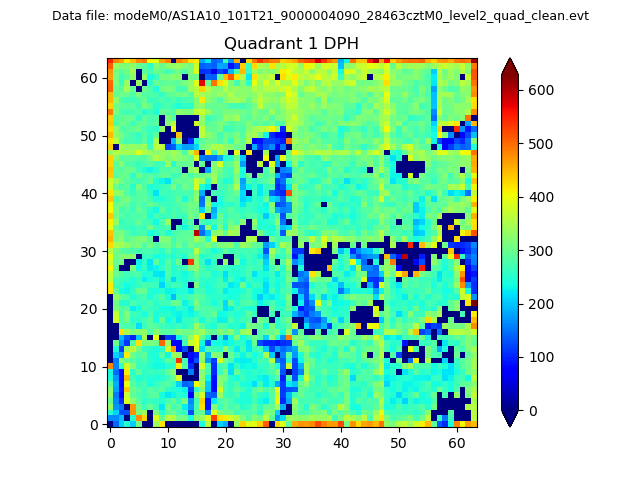 |
Quadrant B |
|---|---|---|---|
| Quadrant D | 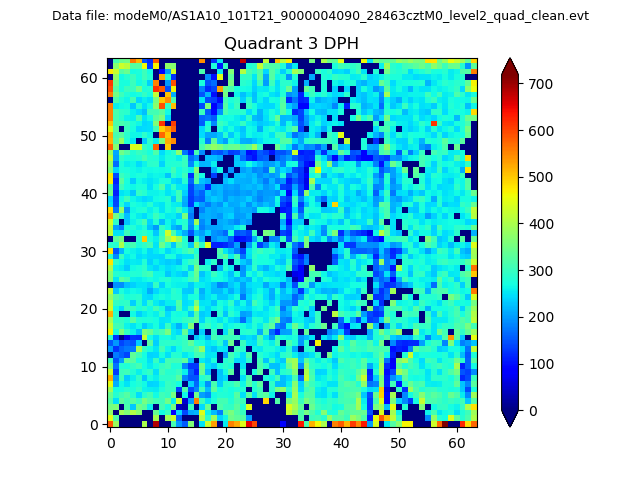 |
 |
Quadrant C |
| Plot type | Count rate plots | Images |
|---|---|---|
| Comparison with Poisson distribution Blue bars denote a histogram of data divided into 1 sec bins. Red curve is a Poisson curve with rate = median count rate of data. |
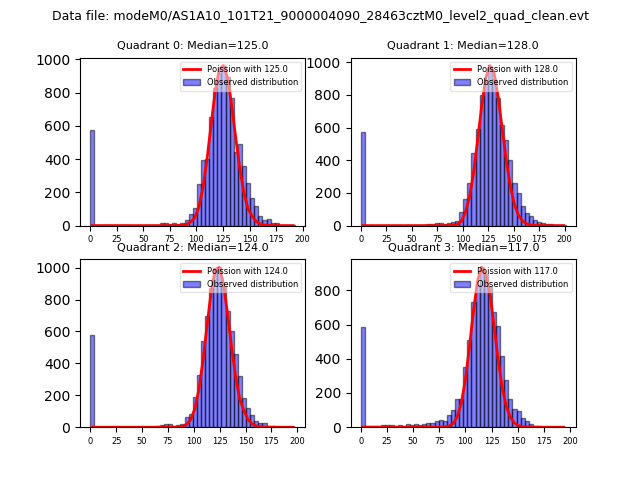 |
 |
| Quadrant-wise count rates Data is divided into 100 sec bins |
 |
|
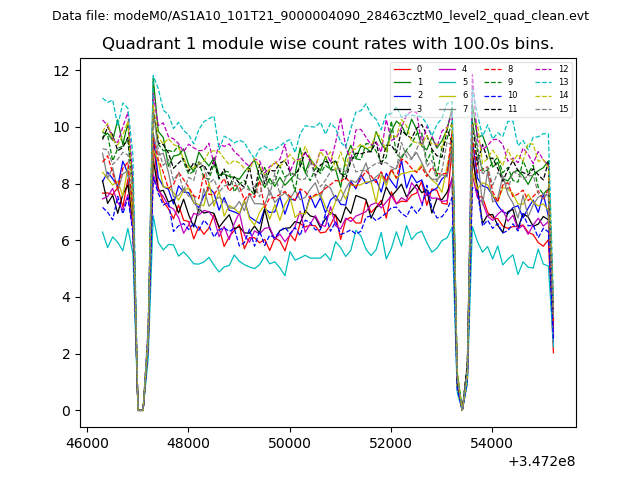
| Module-wise count rates for Quadrant A Data is divided into 100 sec bins |
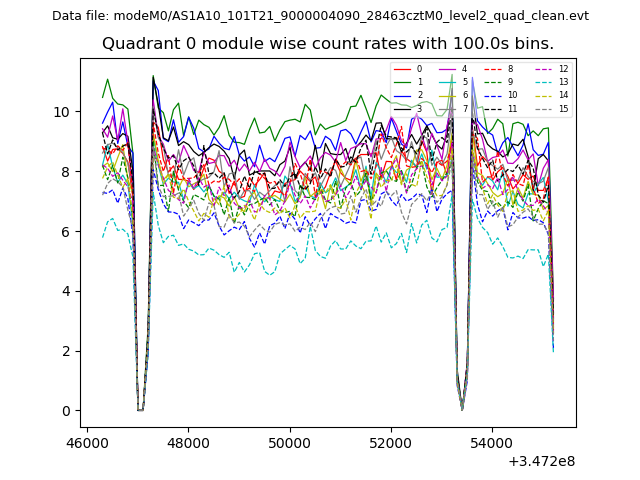 |
 |
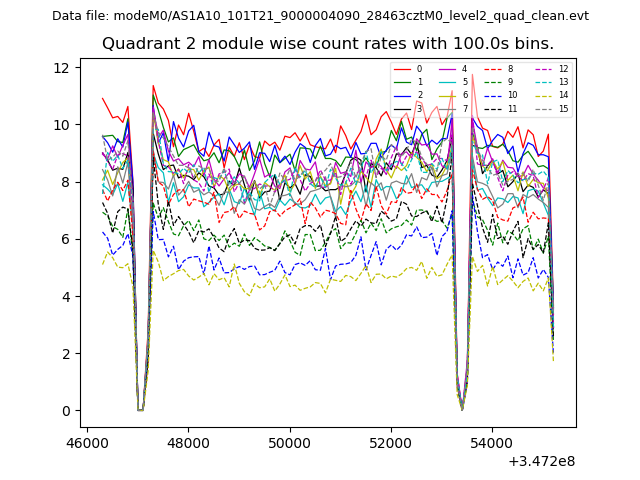
| Module-wise count rates for Quadrant B Data is divided into 100 sec bins |
 |
 |
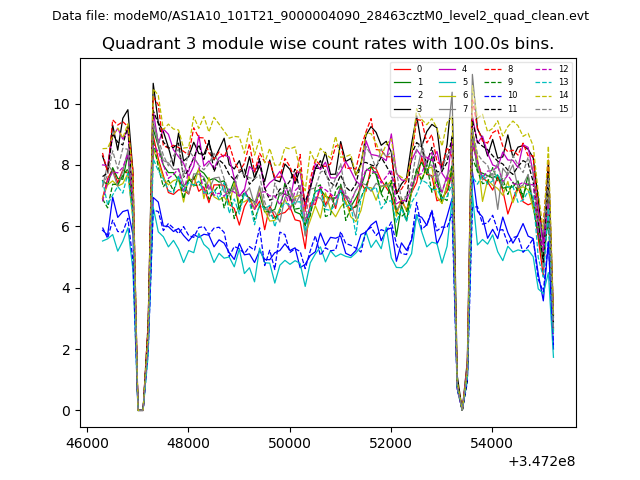
| Module-wise count rates for Quadrant C Data is divided into 100 sec bins |
 |
 |
| Module-wise count rates for Quadrant D Data is divided into 100 sec bins |
 |
 |
| Parameter | Plot |
|---|---|
| CZT HV Monitor | 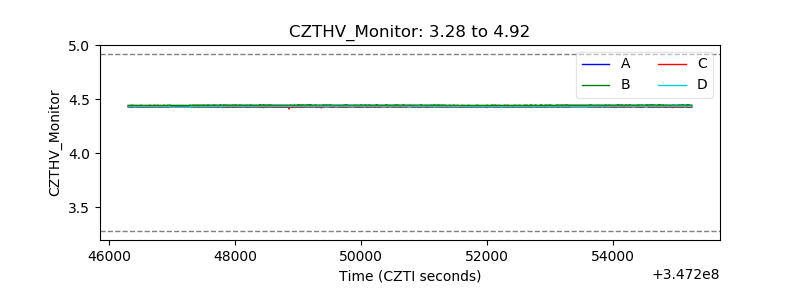 |
| D_VDD | 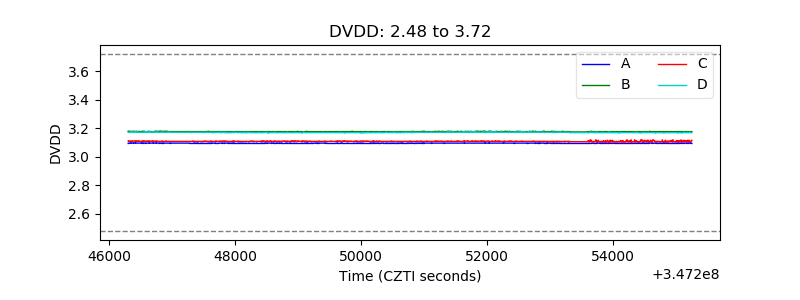 |
| Temperature 1 | 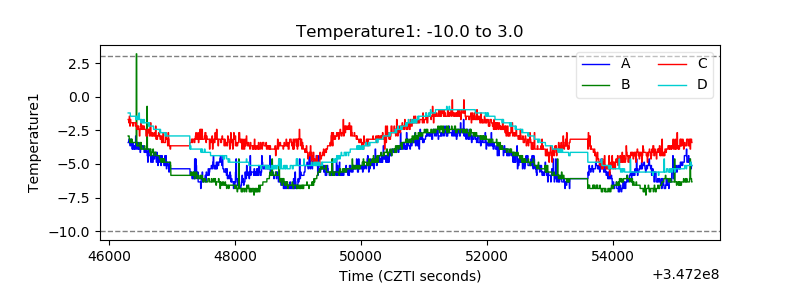 |
| Veto HV Monitor | 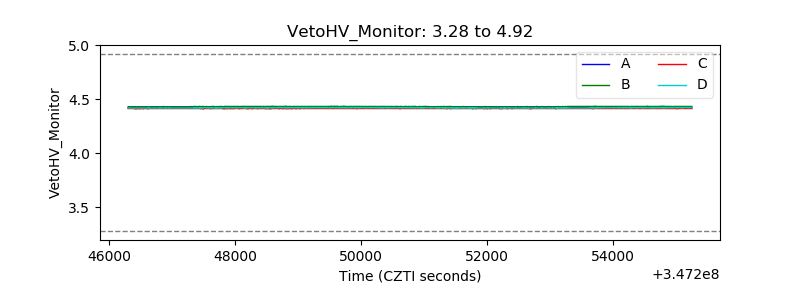 |
| Veto LLD | 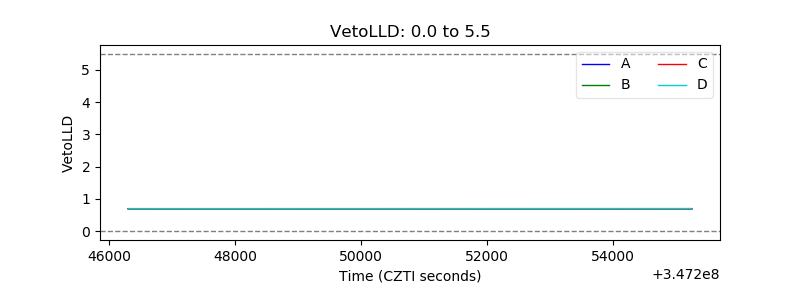 |
| Alpha Counter | 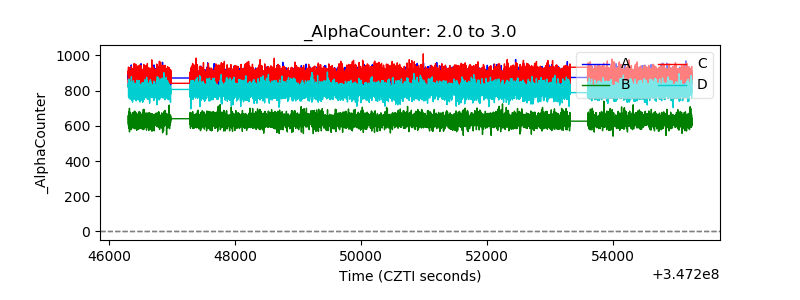 |
| _CPM_Rate | 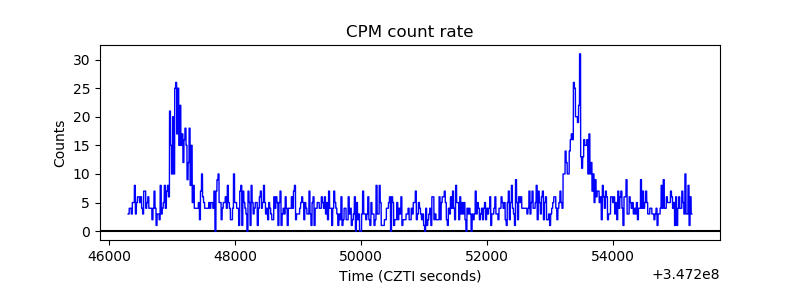 |
| CZT Counter | 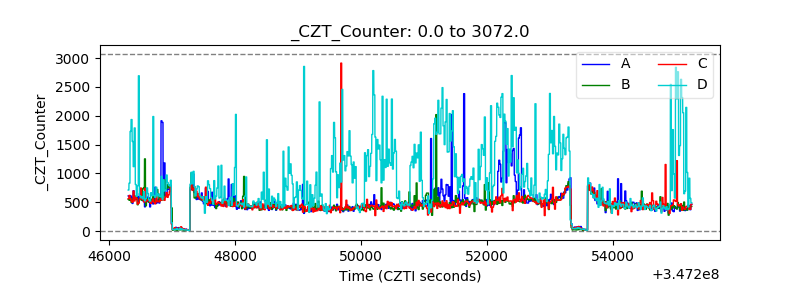 |
| +2.5 Volts monitor |  |
| +5 Volts monitor |  |
| _ROLL_ROT | 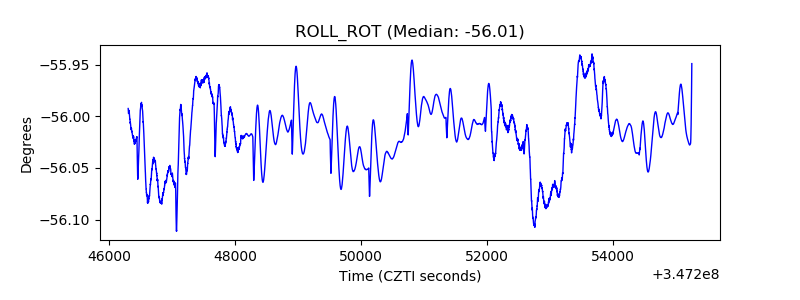 |
| _Roll_DEC | 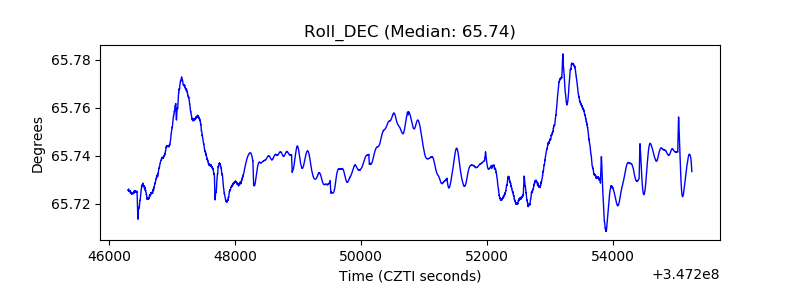 |
| _Roll_RA | 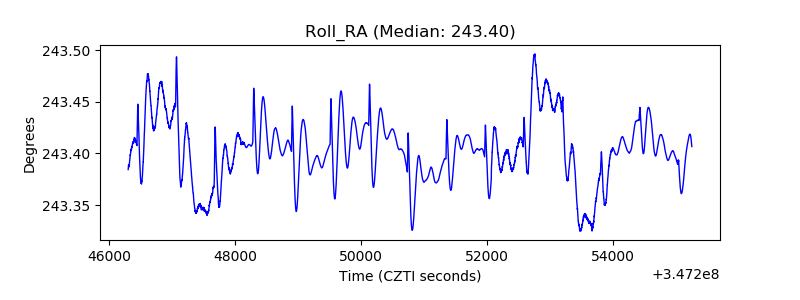 |
| Veto Counter | 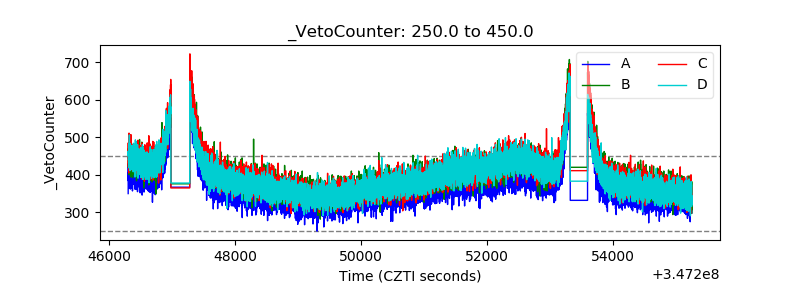 |