| Param | Original file | Final file |
|---|---|---|
| Filename | modeM0/AS1A10_101T21_9000004090_28467cztM0_level2.evt | modeM0/AS1A10_101T21_9000004090_28467cztM0_level2_quad_clean.evt |
| Size (bytes) | 489,225,600 | 108,472,320 |
| Size | 466.6 MB | 103.4 MB |
| Events in quadrant A | 3,322,917 | 736,204 |
| Events in quadrant B | 2,740,520 | 755,920 |
| Events in quadrant C | 2,904,134 | 720,130 |
| Events in quadrant D | 5,454,702 | 667,140 |
| Mode M0 | |||
|---|---|---|---|
| Quadrant | BADHDUFLAG | Total packets | Discarded packets |
| A | 0 | 13682 | 0 |
| B | 0 | 11861 | 0 |
| C | 0 | 12001 | 0 |
| D | 0 | 19933 | 0 |
| Mode M9 | |||
|---|---|---|---|
| Quadrant | BADHDUFLAG | Total packets | Discarded packets |
| A | 0 | 9 | 0 |
| B | 0 | 9 | 0 |
| C | 0 | 9 | 0 |
| D | 0 | 9 | 0 |
| Quadrant | Total seconds | Saturated seconds | Saturation percentage |
|---|---|---|---|
| A | 5800 | 231 | 3.982759% |
| B | 5801 | 37 | 0.637821% |
| C | 5801 | 58 | 0.999828% |
| D | 5800 | 875 | 15.086207% |
Noise dominated data is calculated using 1-second bins in cleaned event files. If a bin has >2000 counts, and if more than 50% of those come from <1% of pixels, then it is considered to be noise-dominated and hence unusable.
| Quadrant | # 1 sec bins | Bins with >0 counts | Bins with >2000 counts | High rate bins dominated by noise | Noise dominated (total time) | Noise dominated (detector-on time) | Marked lightcurve |
|---|---|---|---|---|---|---|---|
| A | 6730 | 5800 | 154 | 154 | 2.29% | 2.66% | 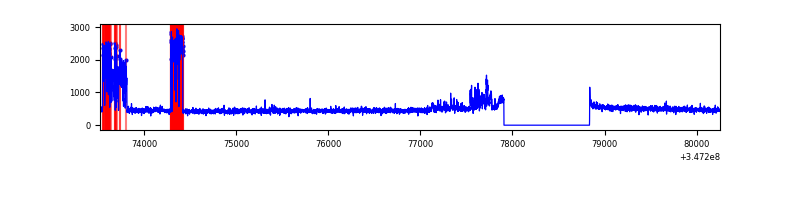 |
| B | 6731 | 5801 | 0 | 0 | 0.00% | 0.00% | 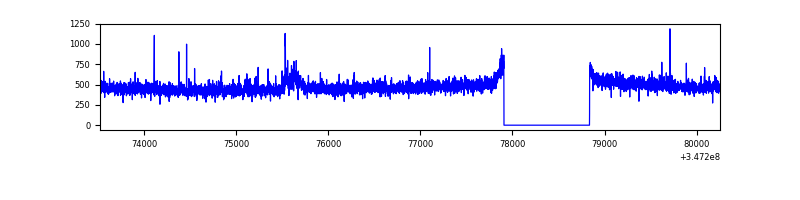 |
| C | 6731 | 5801 | 0 | 0 | 0.00% | 0.00% | 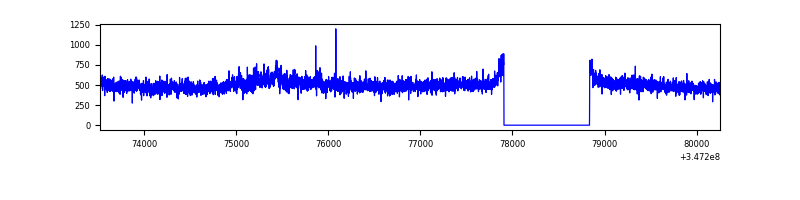 |
| D | 6730 | 5800 | 894 | 894 | 13.28% | 15.41% | 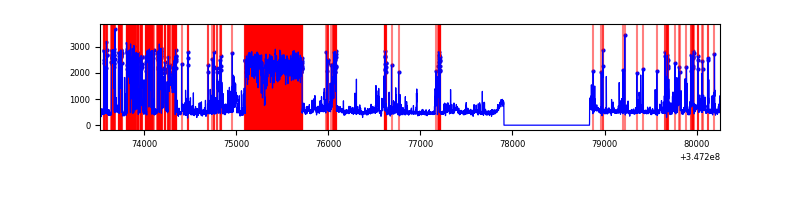 |
Top three noisy pixels from each quadrant. If the there are fewer than three noisy pixels in the level2.evt file, extra rows are filled as -1
| Pixel properties | Quadrant properties | ||||||
|---|---|---|---|---|---|---|---|
| Quadrant | DetID | PixID | Counts | Sigma | Mean | Median | Sigma |
| A | 15 | 174 | 672268 | 4866.97 | 685 | 671 | 138.0 |
| A | 13 | 254 | 8432 | 56.24 | 685 | 671 | 138.0 |
| A | 3 | 137 | 6809 | 44.48 | 685 | 671 | 138.0 |
| B | 10 | 245 | 43454 | 330.73 | 680 | 663 | 129.4 |
| B | 12 | 111 | 16469 | 122.16 | 680 | 663 | 129.4 |
| B | 11 | 111 | 15195 | 112.32 | 680 | 663 | 129.4 |
| C | 7 | 247 | 219366 | 1405.47 | 659 | 662 | 155.6 |
| C | 14 | 238 | 106374 | 679.35 | 659 | 662 | 155.6 |
| C | 3 | 233 | 9438 | 56.4 | 659 | 662 | 155.6 |
| D | 1 | 52 | 1750483 | 11351.65 | 640 | 622 | 154.2 |
| D | 8 | 195 | 1111483 | 7206.34 | 640 | 622 | 154.2 |
| D | 12 | 233 | 67730 | 435.34 | 640 | 622 | 154.2 |
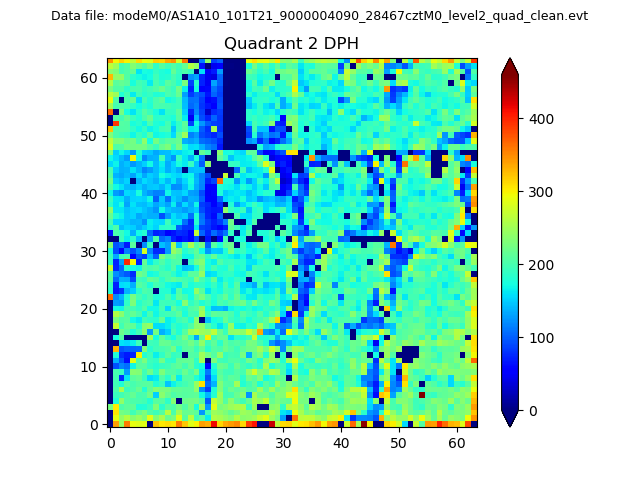
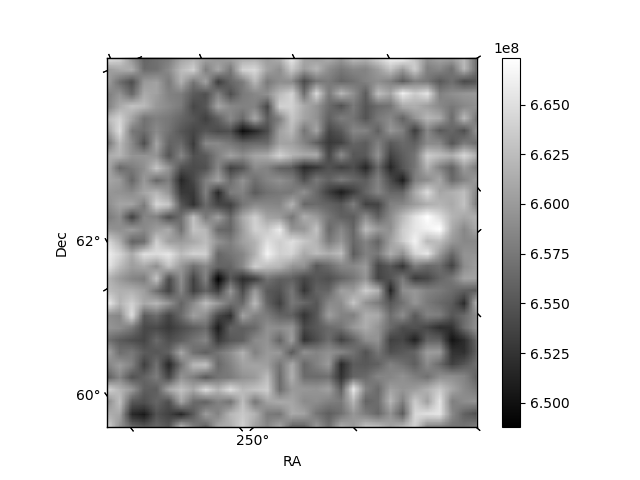
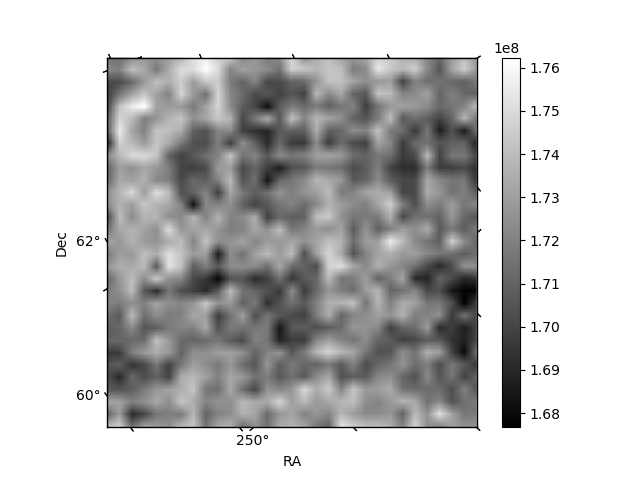
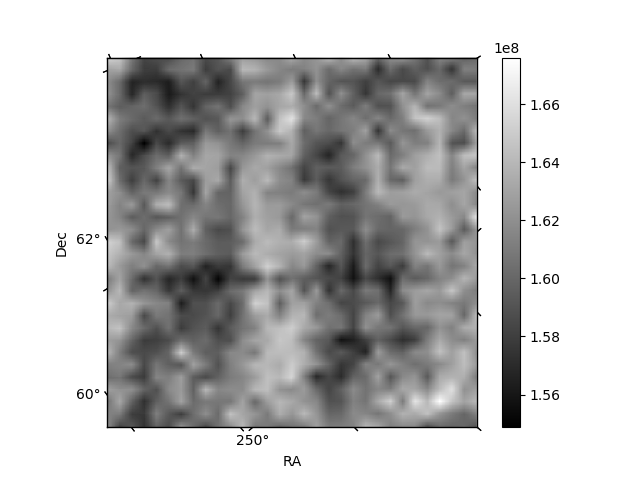
Histogram calculated using DETX and DETY for each event in the final _common_clean file
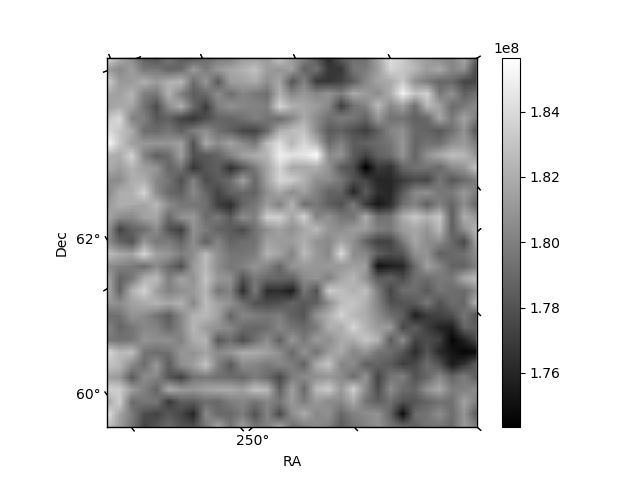
| Quadrant A | 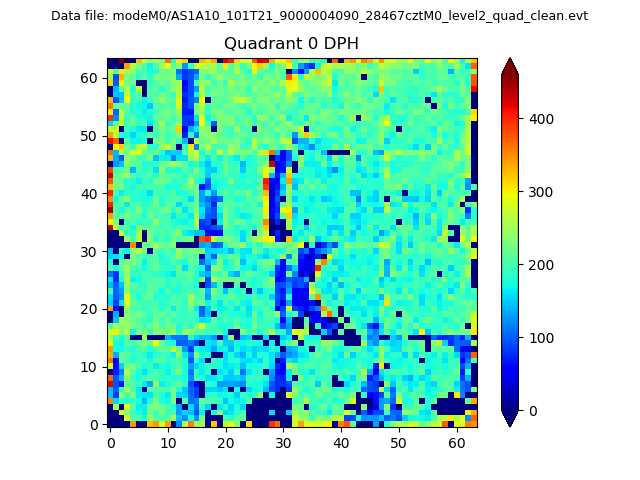 |
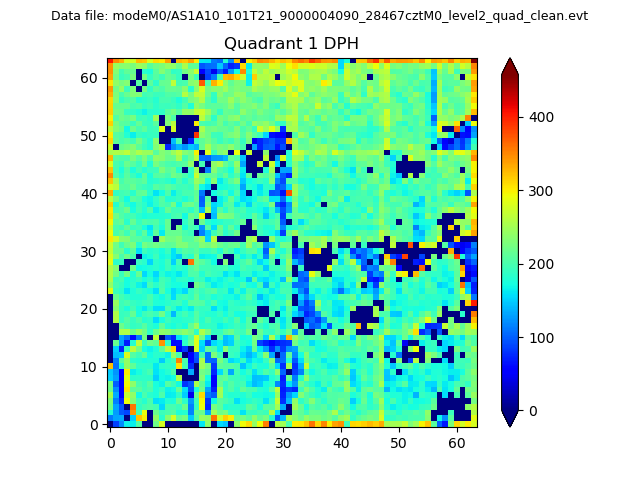 |
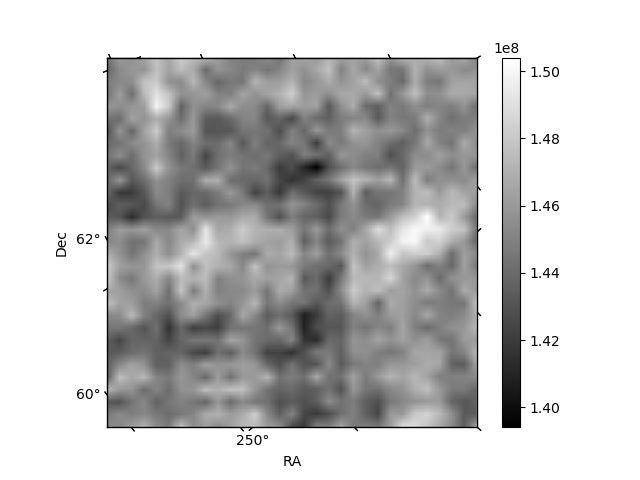
Quadrant B |
|---|---|---|---|
| Quadrant D | 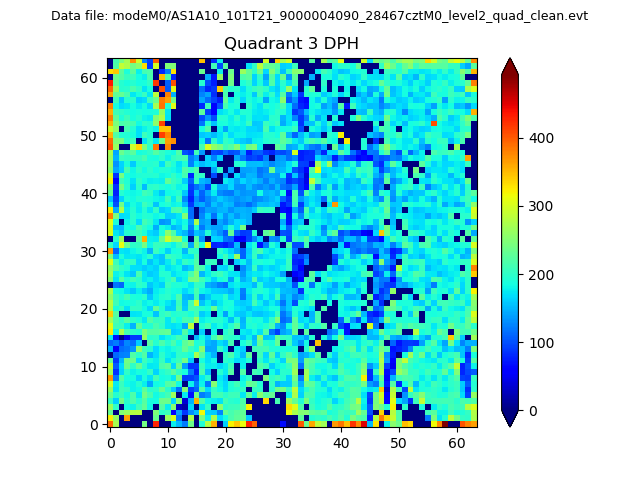 |
 |
Quadrant C |
| Plot type | Count rate plots | Images |
|---|---|---|
| Comparison with Poisson distribution Blue bars denote a histogram of data divided into 1 sec bins. Red curve is a Poisson curve with rate = median count rate of data. |
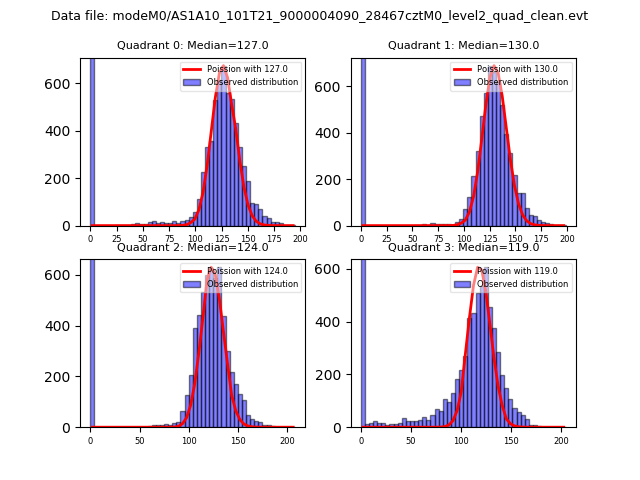 |
 |
| Quadrant-wise count rates Data is divided into 100 sec bins |
 |
|
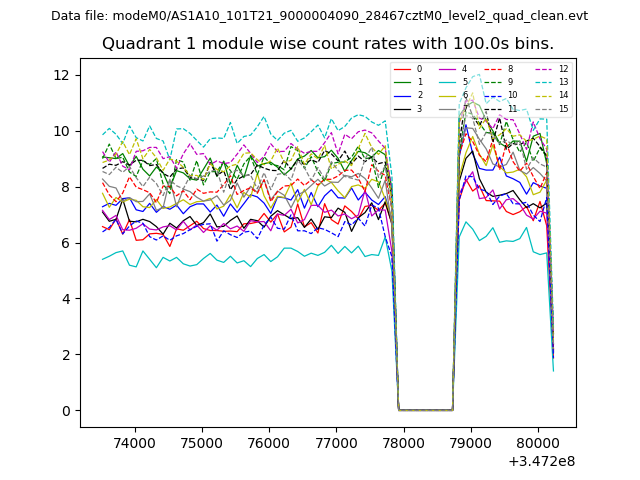
| Module-wise count rates for Quadrant A Data is divided into 100 sec bins |
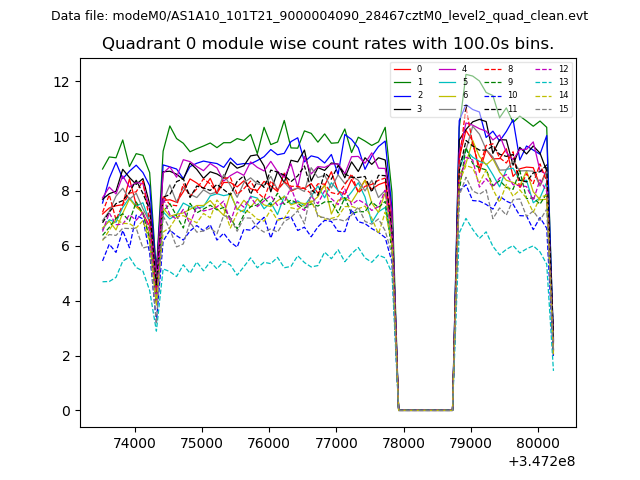 |
 |
| Module-wise count rates for Quadrant B Data is divided into 100 sec bins |
 |
 |
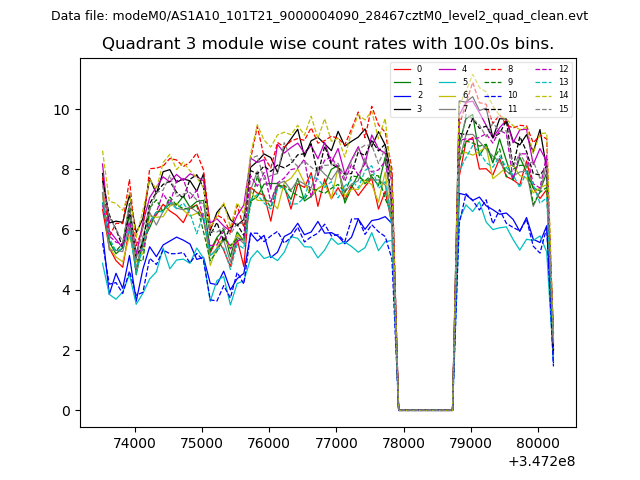
| Module-wise count rates for Quadrant C Data is divided into 100 sec bins |
 |
 |
| Module-wise count rates for Quadrant D Data is divided into 100 sec bins |
 |
 |
| Parameter | Plot |
|---|---|
| CZT HV Monitor | 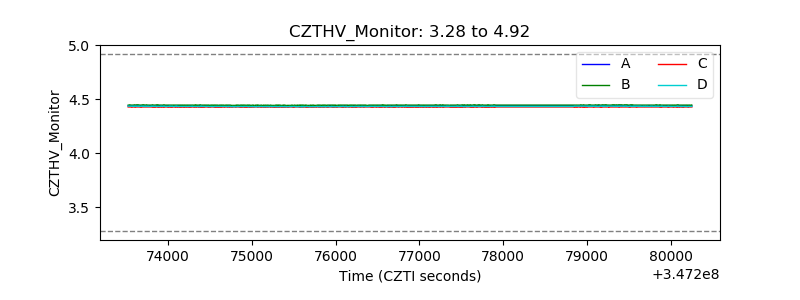 |
| D_VDD | 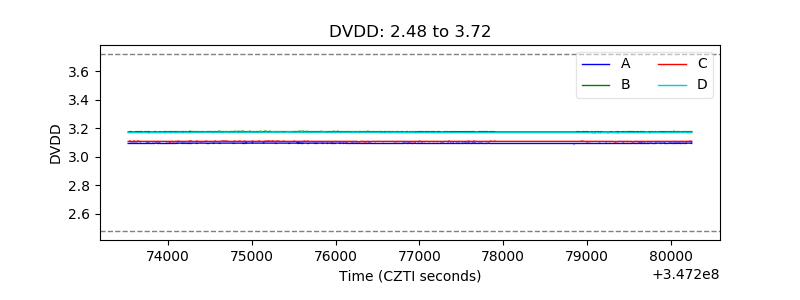 |
| Temperature 1 | 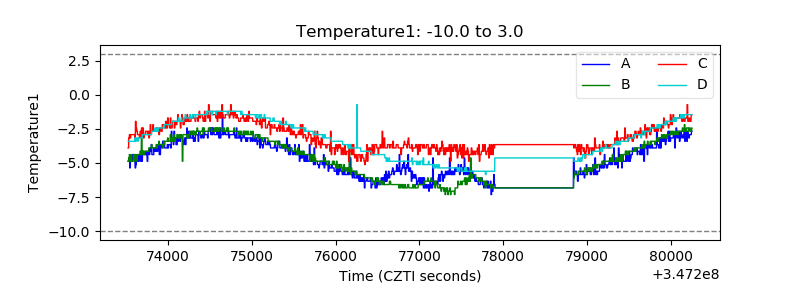 |
| Veto HV Monitor | 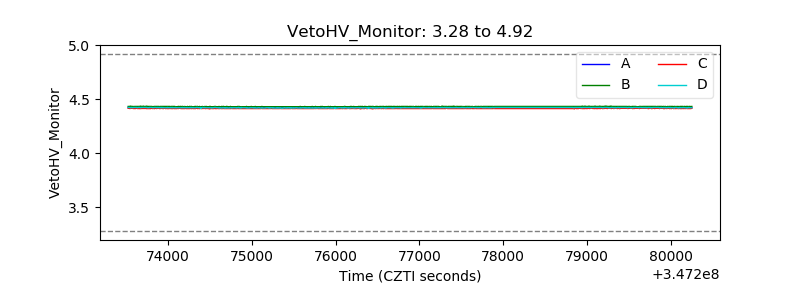 |
| Veto LLD | 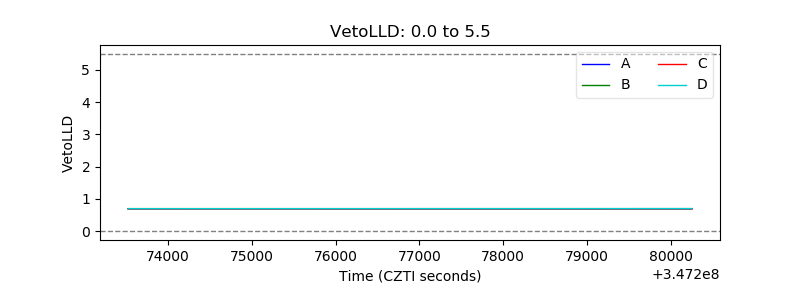 |
| Alpha Counter | 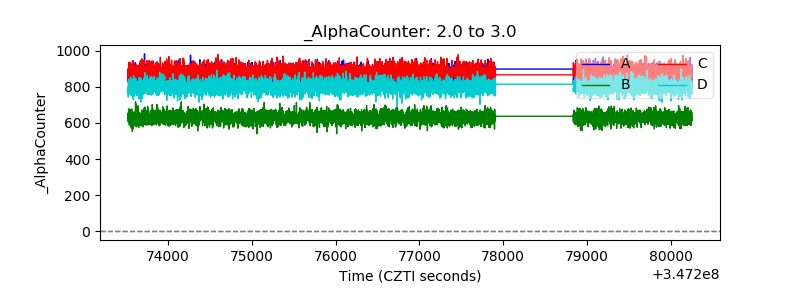 |
| _CPM_Rate | 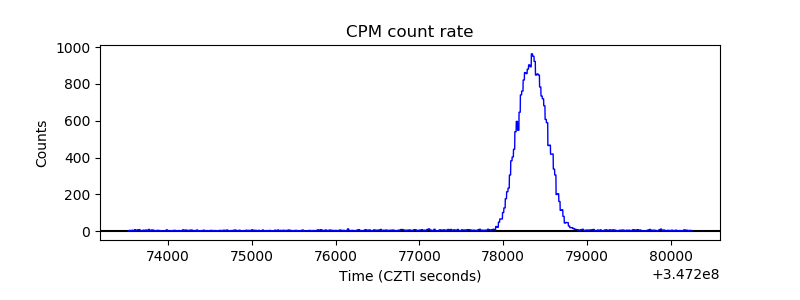 |
| CZT Counter | 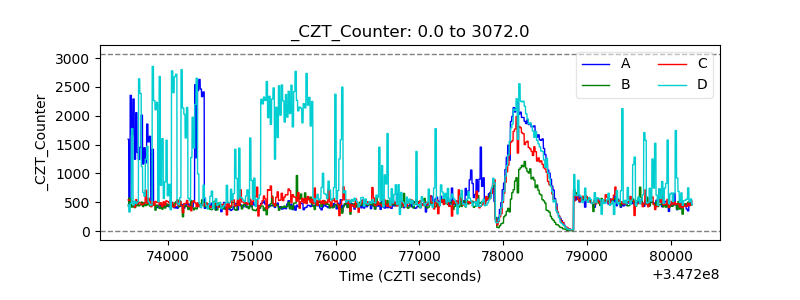 |
| +2.5 Volts monitor |  |
| +5 Volts monitor |  |
| _ROLL_ROT | 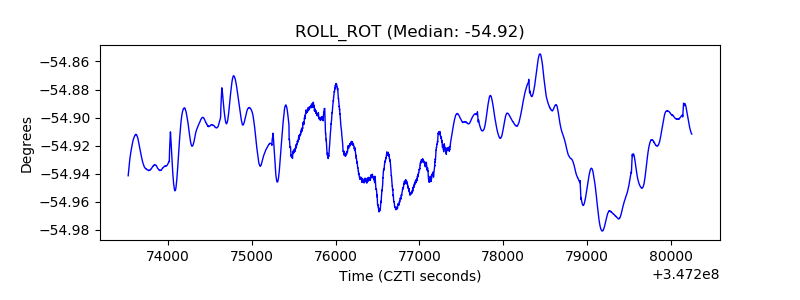 |
| _Roll_DEC | 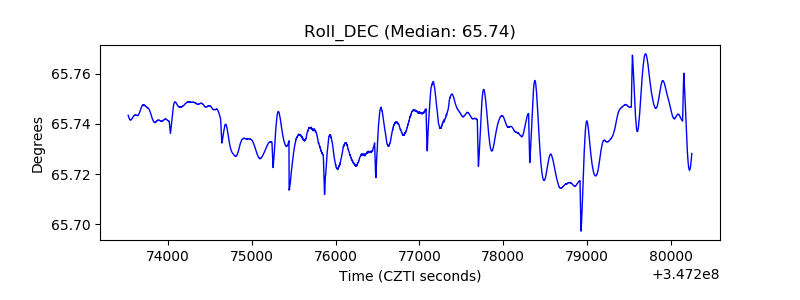 |
| _Roll_RA | 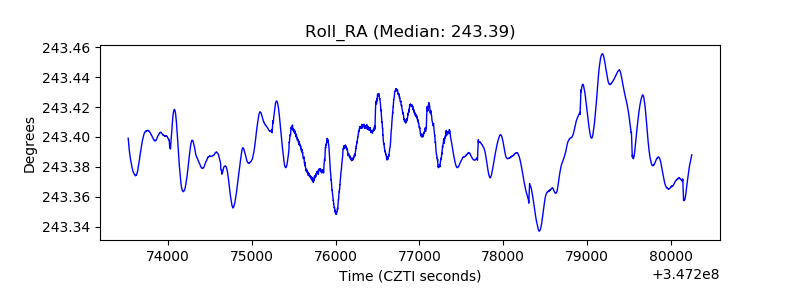 |
| Veto Counter |  |