| Param | Original file | Final file |
|---|---|---|
| Filename | modeM0/AS1A10_101T21_9000004090_28469cztM0_level2.evt | modeM0/AS1A10_101T21_9000004090_28469cztM0_level2_quad_clean.evt |
| Size (bytes) | 522,221,760 | 123,684,480 |
| Size | 498.0 MB | 118.0 MB |
| Events in quadrant A | 4,021,165 | 829,380 |
| Events in quadrant B | 3,122,845 | 864,728 |
| Events in quadrant C | 3,290,065 | 824,115 |
| Events in quadrant D | 4,956,115 | 790,067 |
| Mode M0 | |||
|---|---|---|---|
| Quadrant | BADHDUFLAG | Total packets | Discarded packets |
| A | 0 | 15911 | 0 |
| B | 0 | 13239 | 0 |
| C | 0 | 13528 | 0 |
| D | 0 | 18773 | 0 |
| Mode M9 | |||
|---|---|---|---|
| Quadrant | BADHDUFLAG | Total packets | Discarded packets |
| A | 0 | 11 | 0 |
| B | 0 | 11 | 0 |
| C | 0 | 11 | 0 |
| D | 0 | 11 | 0 |
| Quadrant | Total seconds | Saturated seconds | Saturation percentage |
|---|---|---|---|
| A | 6275 | 444 | 7.075697% |
| B | 6276 | 52 | 0.828553% |
| C | 6276 | 79 | 1.258764% |
| D | 6276 | 528 | 8.413002% |
Noise dominated data is calculated using 1-second bins in cleaned event files. If a bin has >2000 counts, and if more than 50% of those come from <1% of pixels, then it is considered to be noise-dominated and hence unusable.
| Quadrant | # 1 sec bins | Bins with >0 counts | Bins with >2000 counts | High rate bins dominated by noise | Noise dominated (total time) | Noise dominated (detector-on time) | Marked lightcurve |
|---|---|---|---|---|---|---|---|
| A | 7340 | 6275 | 375 | 375 | 5.11% | 5.98% | 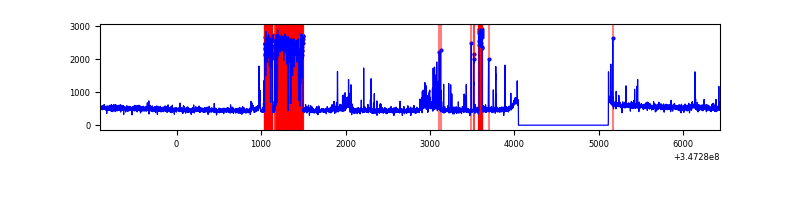 |
| B | 7341 | 6276 | 3 | 3 | 0.04% | 0.05% | 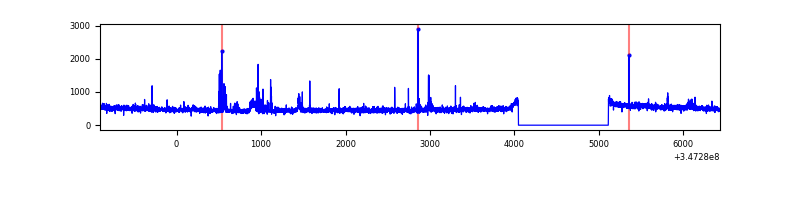 |
| C | 7341 | 6276 | 0 | 0 | 0.00% | 0.00% | 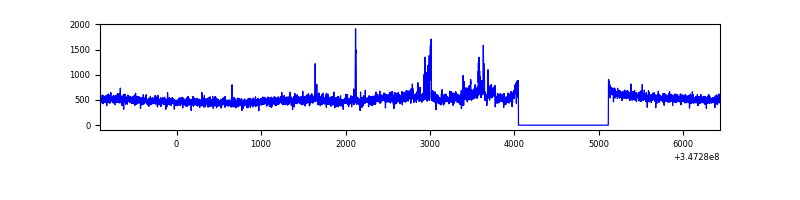 |
| D | 7341 | 6276 | 543 | 543 | 7.40% | 8.65% | 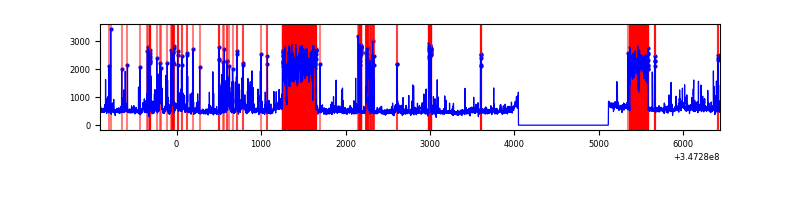 |
Top three noisy pixels from each quadrant. If the there are fewer than three noisy pixels in the level2.evt file, extra rows are filled as -1
| Pixel properties | Quadrant properties | ||||||
|---|---|---|---|---|---|---|---|
| Quadrant | DetID | PixID | Counts | Sigma | Mean | Median | Sigma |
| A | 15 | 174 | 1102829 | 7311.34 | 756 | 741 | 150.7 |
| A | 13 | 254 | 8897 | 54.1 | 756 | 741 | 150.7 |
| A | 3 | 137 | 7298 | 43.5 | 756 | 741 | 150.7 |
| B | 5 | 255 | 79511 | 547.19 | 760 | 740 | 144.0 |
| B | 10 | 245 | 39782 | 271.21 | 760 | 740 | 144.0 |
| B | 12 | 111 | 17619 | 117.25 | 760 | 740 | 144.0 |
| C | 7 | 247 | 172497 | 1002.42 | 738 | 740 | 171.3 |
| C | 14 | 238 | 121624 | 705.51 | 738 | 740 | 171.3 |
| C | 3 | 233 | 116984 | 678.43 | 738 | 740 | 171.3 |
| D | 8 | 195 | 1157690 | 6675.09 | 737 | 718 | 173.3 |
| D | 1 | 52 | 846556 | 4880.02 | 737 | 718 | 173.3 |
| D | 2 | 250 | 118855 | 681.58 | 737 | 718 | 173.3 |
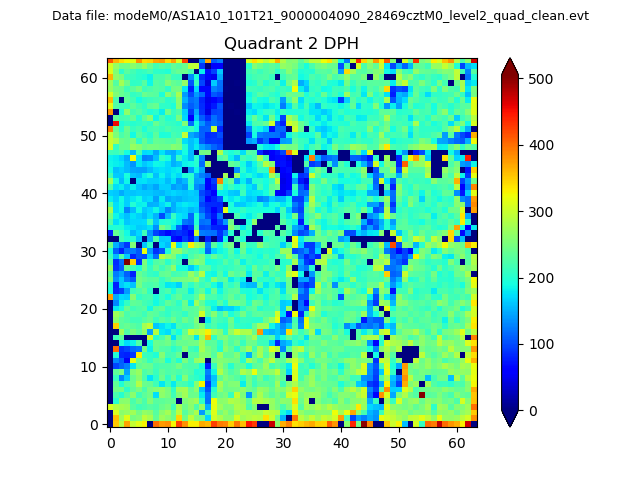
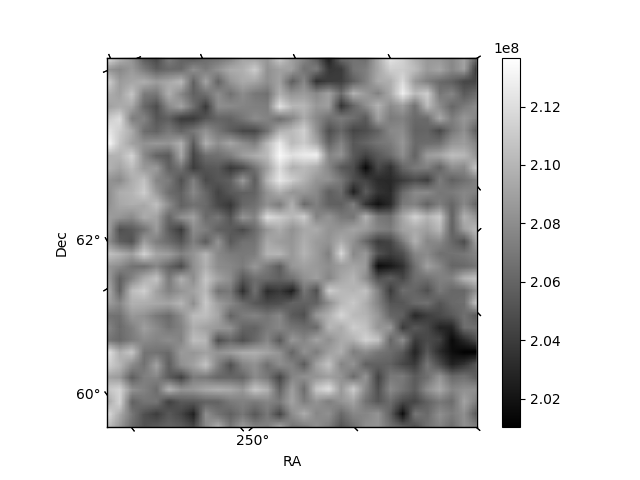
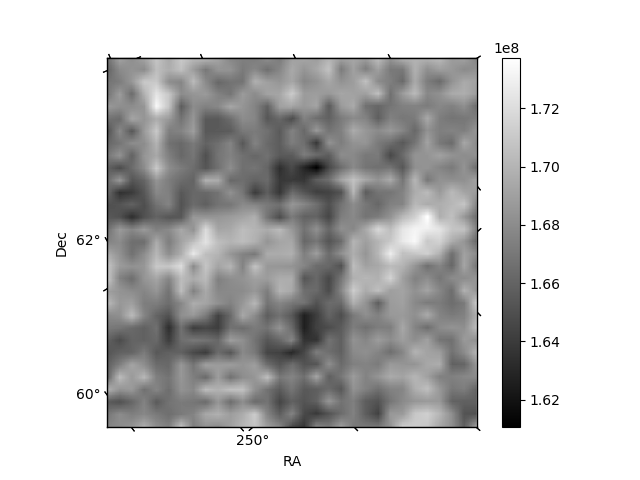
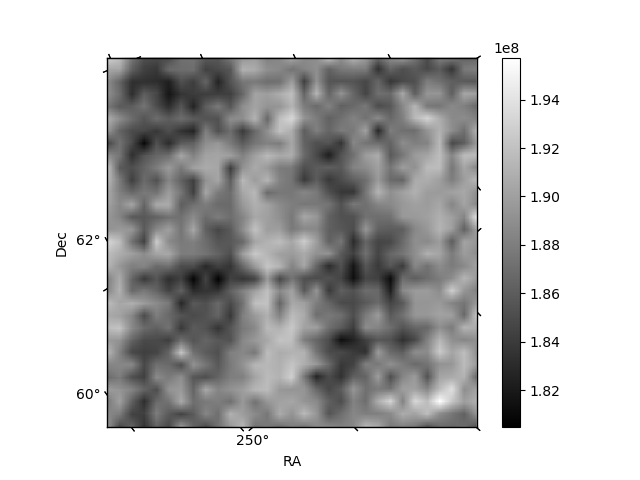
Histogram calculated using DETX and DETY for each event in the final _common_clean file
| Quadrant A | 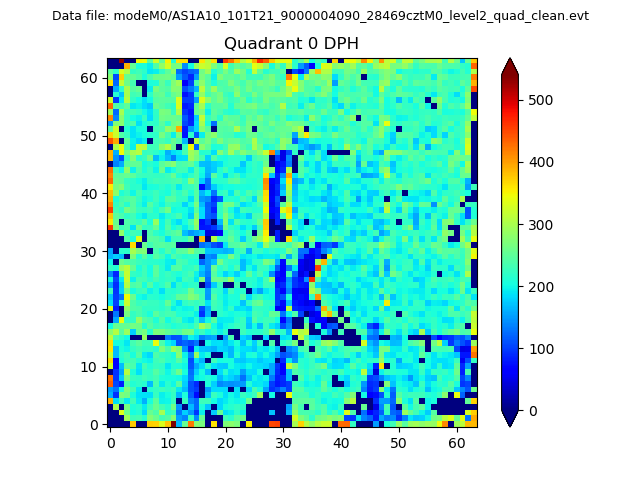 |
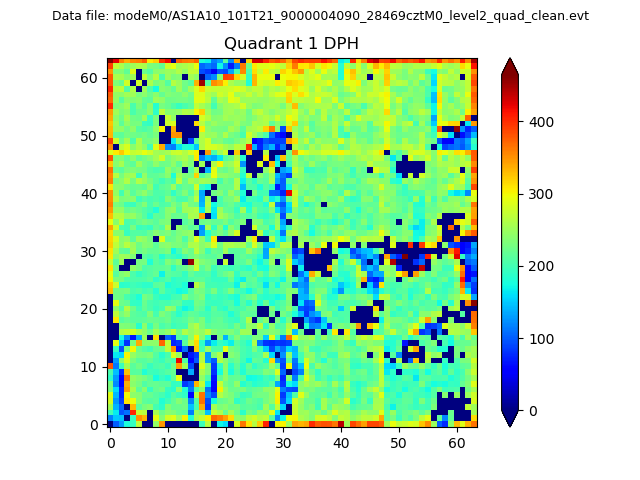 |
Quadrant B |
|---|---|---|---|
| Quadrant D | 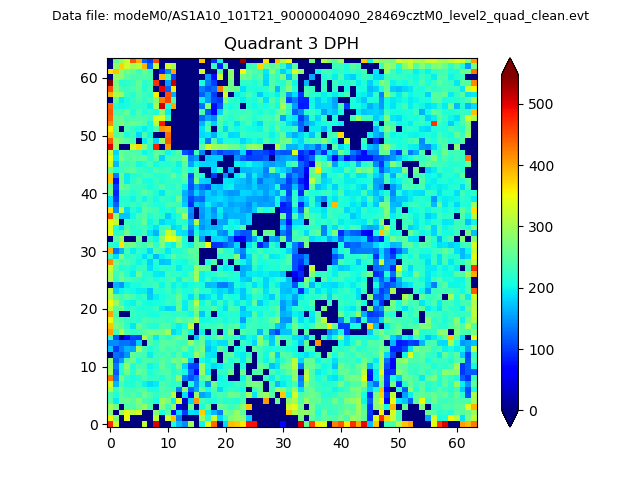 |
 |
Quadrant C |
| Plot type | Count rate plots | Images |
|---|---|---|
| Comparison with Poisson distribution Blue bars denote a histogram of data divided into 1 sec bins. Red curve is a Poisson curve with rate = median count rate of data. |
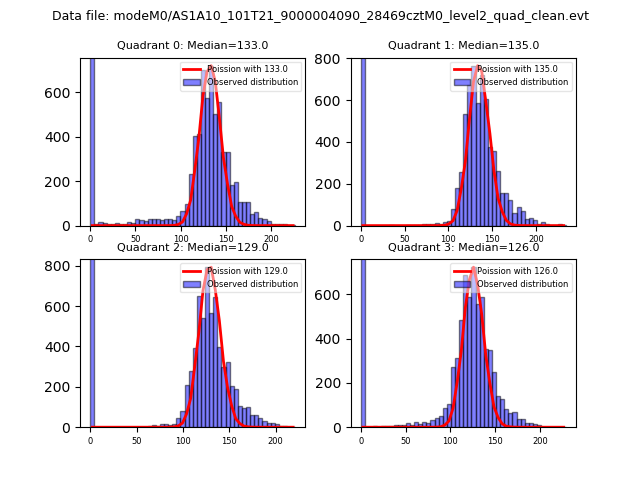 |
 |
| Quadrant-wise count rates Data is divided into 100 sec bins |
 |
|
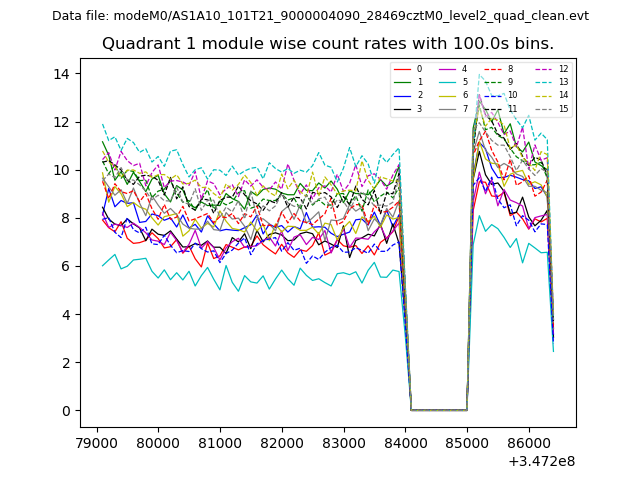
| Module-wise count rates for Quadrant A Data is divided into 100 sec bins |
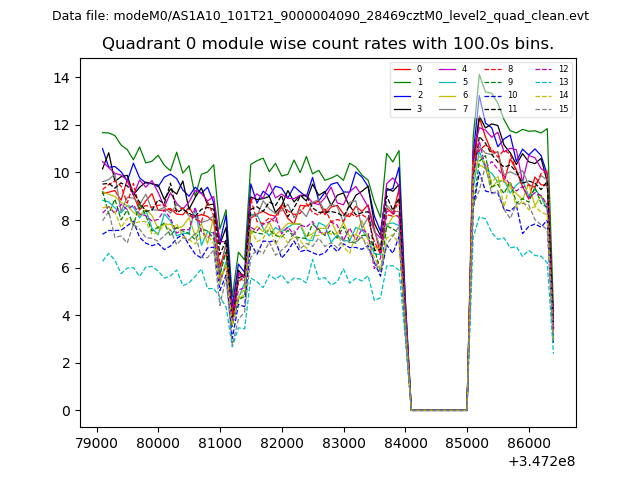 |
 |
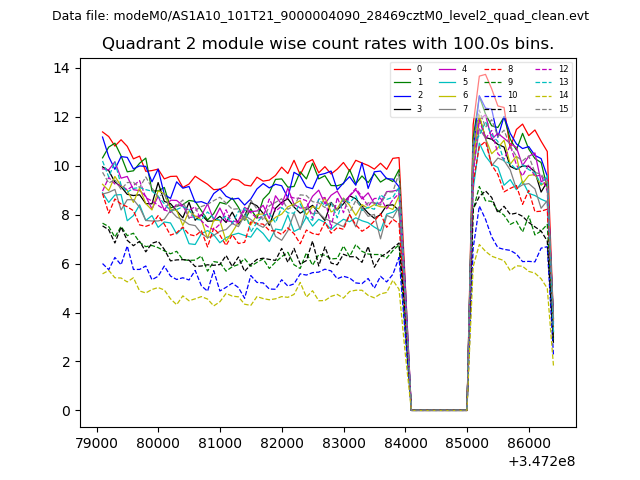
| Module-wise count rates for Quadrant B Data is divided into 100 sec bins |
 |
 |
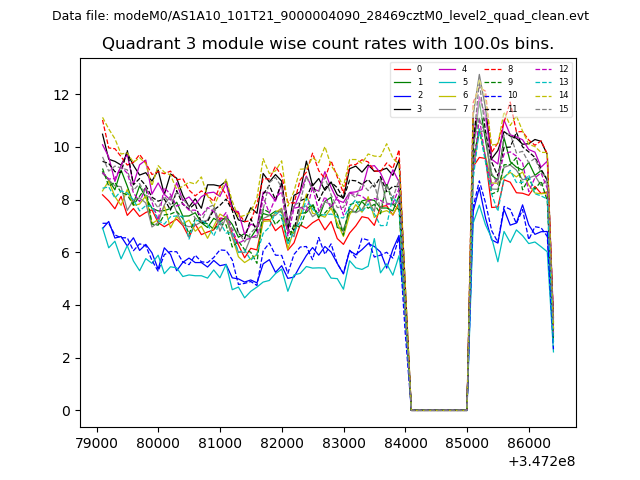
| Module-wise count rates for Quadrant C Data is divided into 100 sec bins |
 |
 |
| Module-wise count rates for Quadrant D Data is divided into 100 sec bins |
 |
 |
| Parameter | Plot |
|---|---|
| CZT HV Monitor | 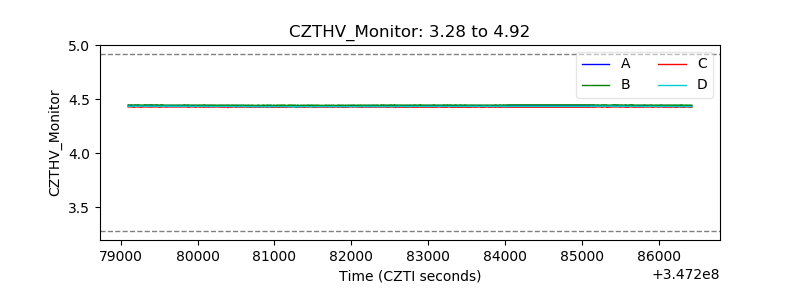 |
| D_VDD | 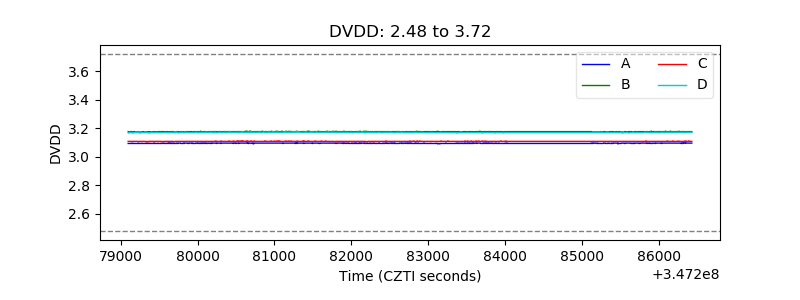 |
| Temperature 1 | 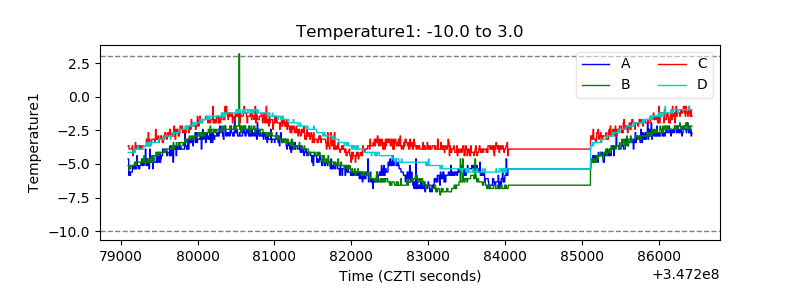 |
| Veto HV Monitor | 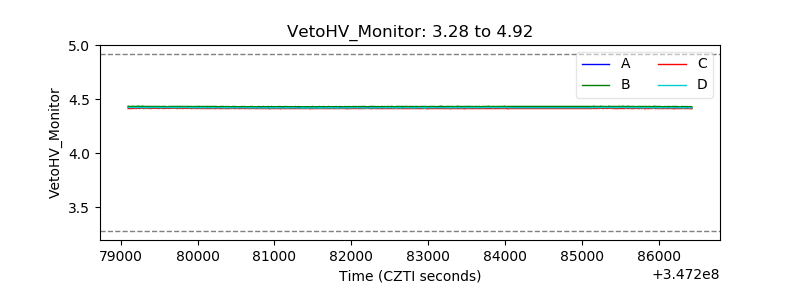 |
| Veto LLD | 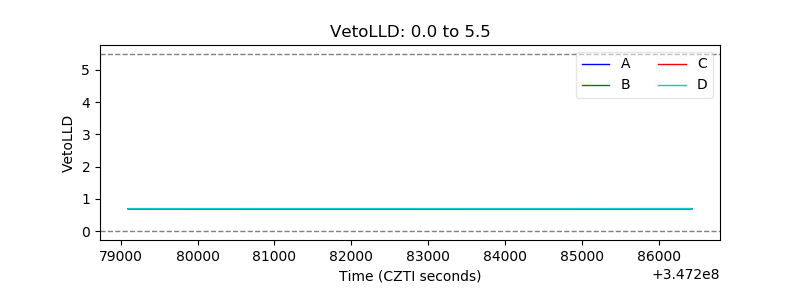 |
| Alpha Counter |  |
| _CPM_Rate | 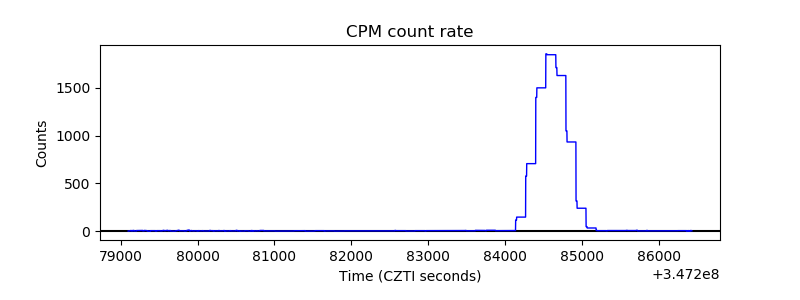 |
| CZT Counter | 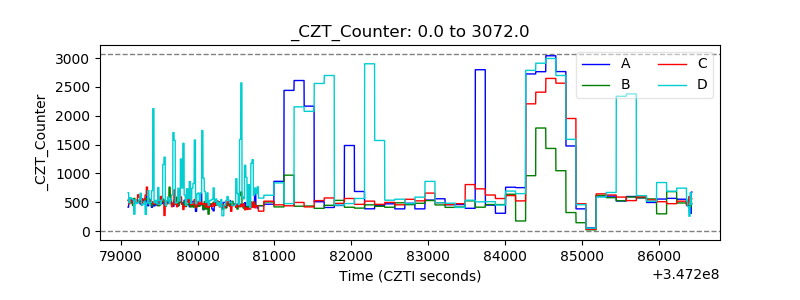 |
| +2.5 Volts monitor |  |
| +5 Volts monitor |  |
| _ROLL_ROT | 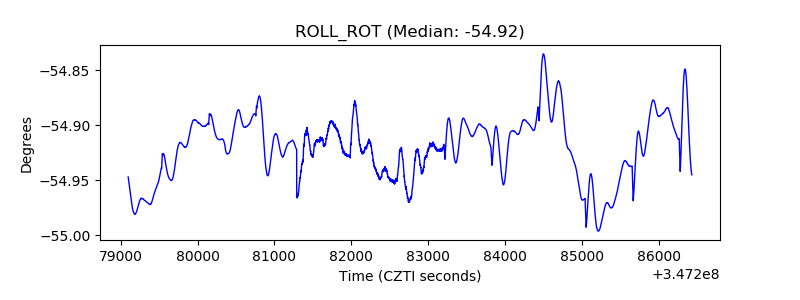 |
| _Roll_DEC | 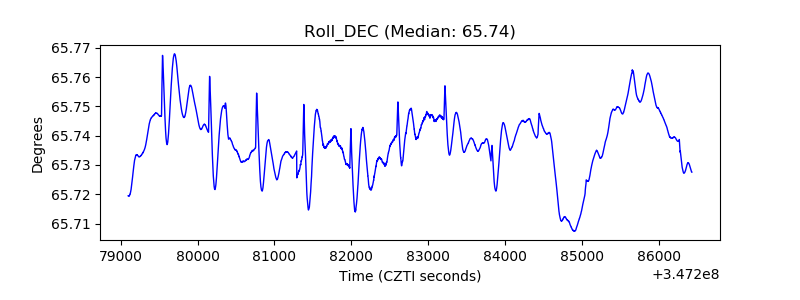 |
| _Roll_RA | 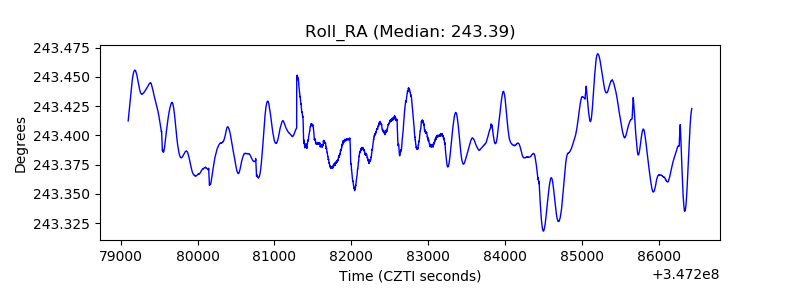 |
| Veto Counter | 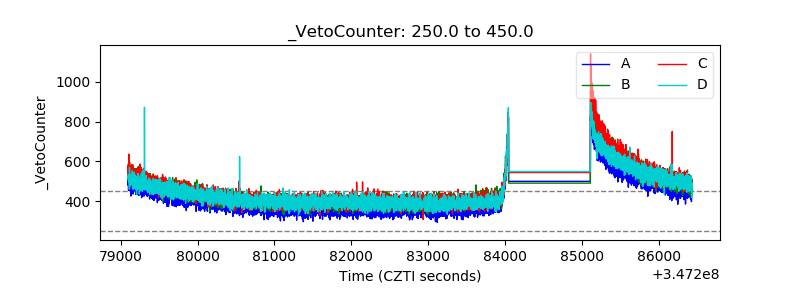 |