| Param | Original file | Final file |
|---|---|---|
| Filename | modeM0/AS1A10_101T21_9000004090_28470cztM0_level2.evt | modeM0/AS1A10_101T21_9000004090_28470cztM0_level2_quad_clean.evt |
| Size (bytes) | 620,913,600 | 129,781,440 |
| Size | 592.1 MB | 123.8 MB |
| Events in quadrant A | 4,704,894 | 860,256 |
| Events in quadrant B | 3,369,081 | 924,150 |
| Events in quadrant C | 3,228,006 | 892,088 |
| Events in quadrant D | 7,075,989 | 814,234 |
| Mode M0 | |||
|---|---|---|---|
| Quadrant | BADHDUFLAG | Total packets | Discarded packets |
| A | 0 | 18051 | 0 |
| B | 0 | 14008 | 0 |
| C | 0 | 13418 | 0 |
| D | 0 | 25313 | 0 |
| Mode M9 | |||
|---|---|---|---|
| Quadrant | BADHDUFLAG | Total packets | Discarded packets |
| A | 0 | 12 | 0 |
| B | 0 | 12 | 0 |
| C | 0 | 12 | 0 |
| D | 0 | 12 | 0 |
| Quadrant | Total seconds | Saturated seconds | Saturation percentage |
|---|---|---|---|
| A | 6296 | 666 | 10.578145% |
| B | 6296 | 76 | 1.207116% |
| C | 6296 | 78 | 1.238882% |
| D | 6296 | 1183 | 18.789708% |
Noise dominated data is calculated using 1-second bins in cleaned event files. If a bin has >2000 counts, and if more than 50% of those come from <1% of pixels, then it is considered to be noise-dominated and hence unusable.
| Quadrant | # 1 sec bins | Bins with >0 counts | Bins with >2000 counts | High rate bins dominated by noise | Noise dominated (total time) | Noise dominated (detector-on time) | Marked lightcurve |
|---|---|---|---|---|---|---|---|
| A | 7486 | 6296 | 599 | 599 | 8.00% | 9.51% | 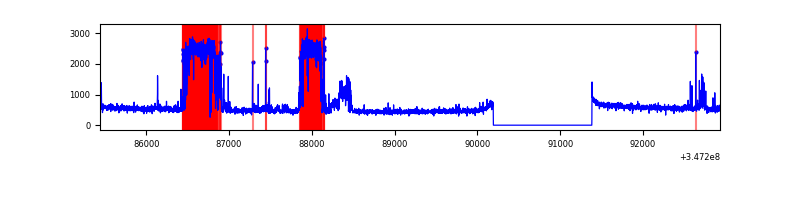 |
| B | 7486 | 6296 | 19 | 19 | 0.25% | 0.30% | 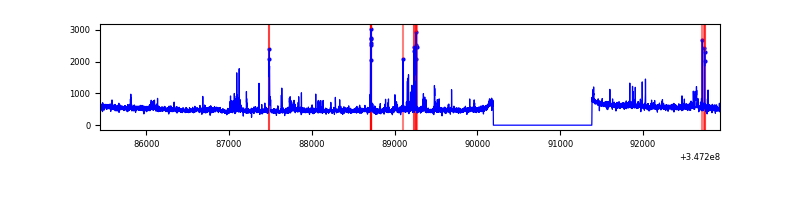 |
| C | 7486 | 6296 | 0 | 0 | 0.00% | 0.00% | 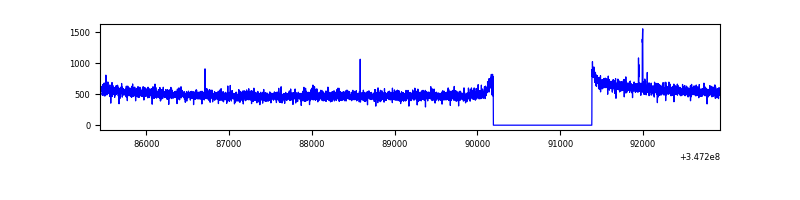 |
| D | 7486 | 6296 | 1178 | 1178 | 15.74% | 18.71% | 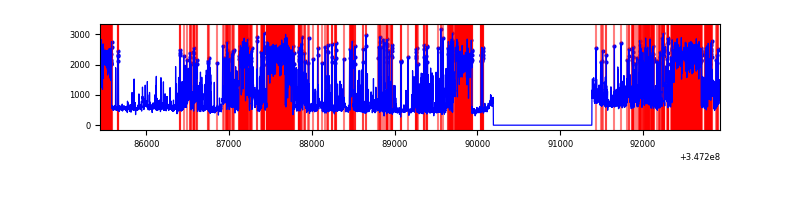 |
Top three noisy pixels from each quadrant. If the there are fewer than three noisy pixels in the level2.evt file, extra rows are filled as -1
| Pixel properties | Quadrant properties | ||||||
|---|---|---|---|---|---|---|---|
| Quadrant | DetID | PixID | Counts | Sigma | Mean | Median | Sigma |
| A | 15 | 174 | 1740473 | 11491.69 | 764 | 749 | 151.4 |
| A | 15 | 169 | 11059 | 68.1 | 764 | 749 | 151.4 |
| A | 13 | 254 | 8646 | 52.16 | 764 | 749 | 151.4 |
| B | 10 | 245 | 222447 | 1515.03 | 791 | 773 | 146.3 |
| B | 0 | 230 | 24689 | 163.45 | 791 | 773 | 146.3 |
| B | 12 | 111 | 17636 | 115.25 | 791 | 773 | 146.3 |
| C | 14 | 238 | 126166 | 698.69 | 777 | 782 | 179.5 |
| C | 7 | 247 | 55876 | 307.01 | 777 | 782 | 179.5 |
| C | 3 | 233 | 18053 | 96.24 | 777 | 782 | 179.5 |
| D | 1 | 52 | 2384543 | 13468.63 | 750 | 729 | 177.0 |
| D | 8 | 195 | 1567434 | 8851.94 | 750 | 729 | 177.0 |
| D | 2 | 250 | 212664 | 1197.44 | 750 | 729 | 177.0 |
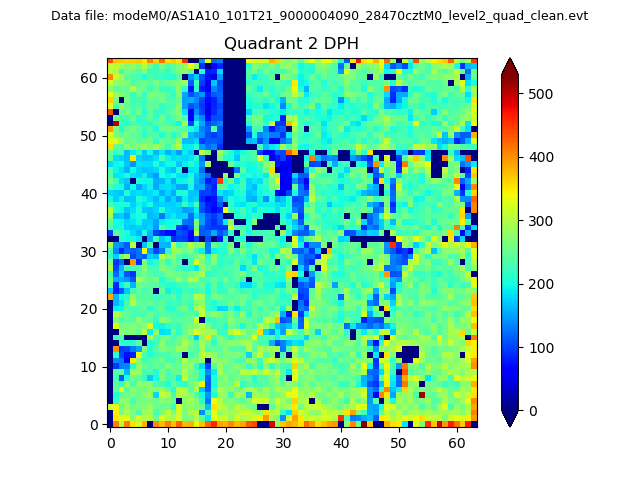
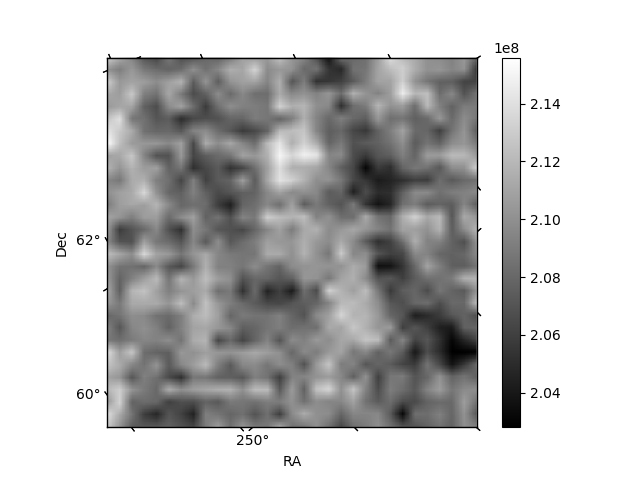
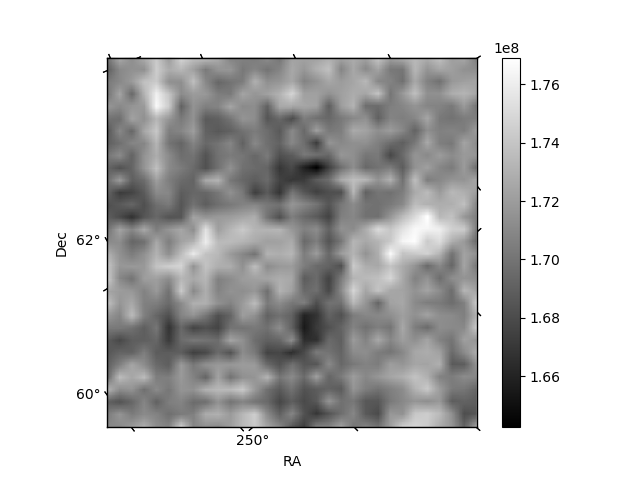
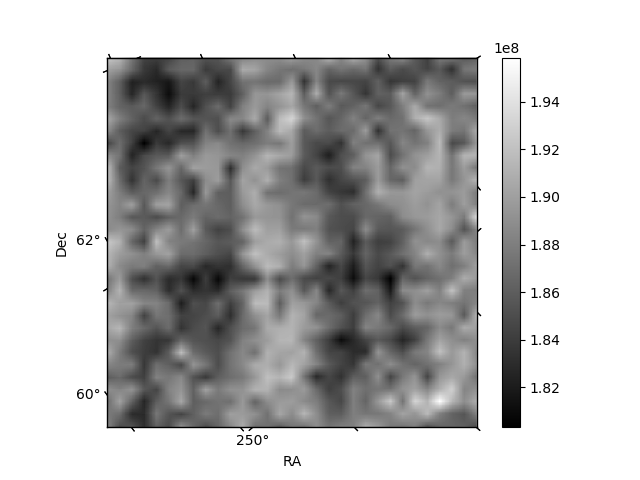
Histogram calculated using DETX and DETY for each event in the final _common_clean file
| Quadrant A | 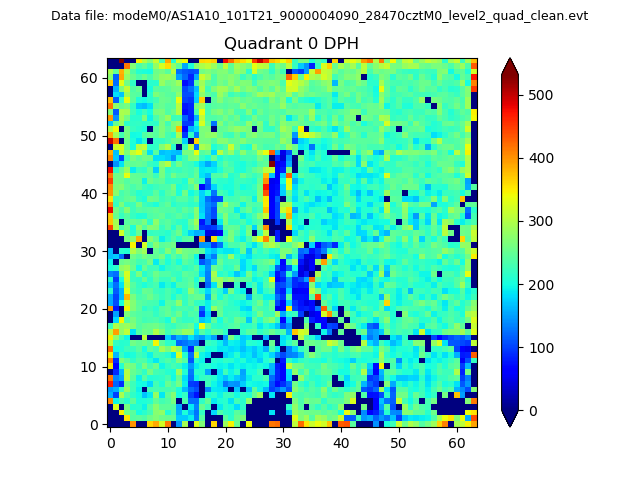 |
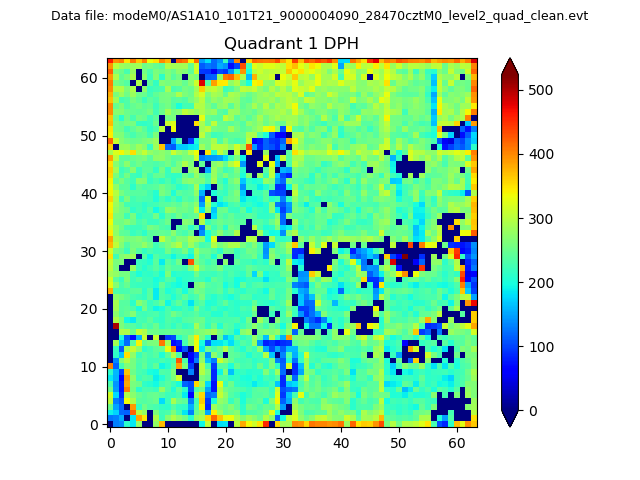 |
Quadrant B |
|---|---|---|---|
| Quadrant D | 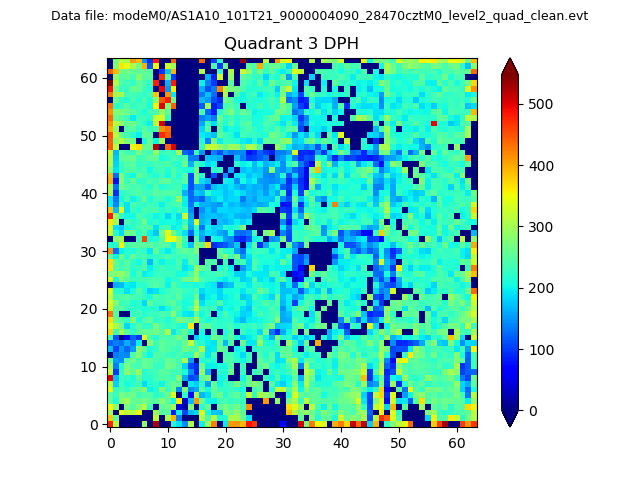 |
 |
Quadrant C |
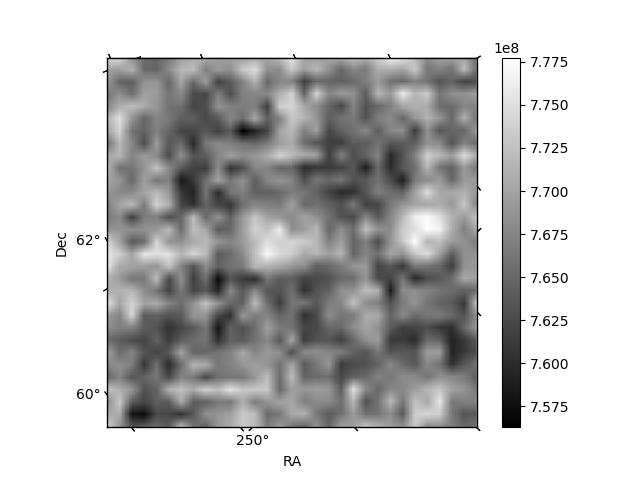
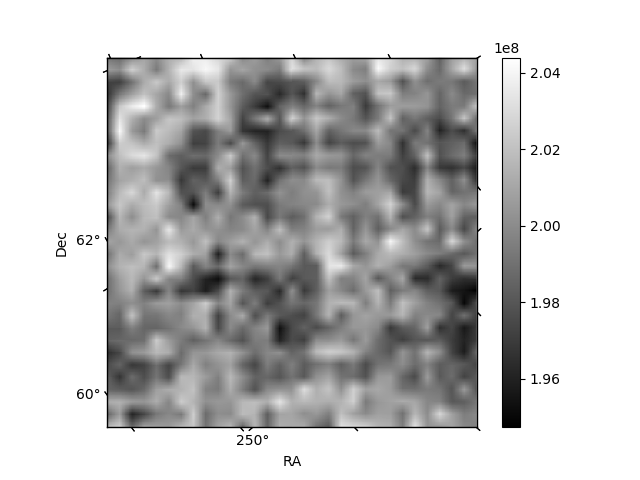
| Plot type | Count rate plots | Images |
|---|---|---|
| Comparison with Poisson distribution Blue bars denote a histogram of data divided into 1 sec bins. Red curve is a Poisson curve with rate = median count rate of data. |
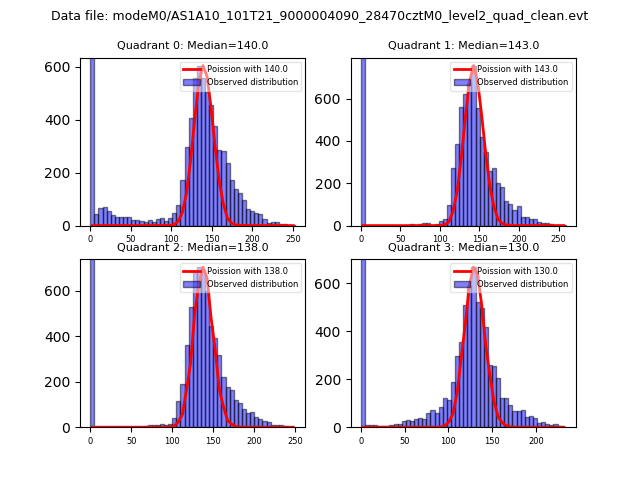 |
 |
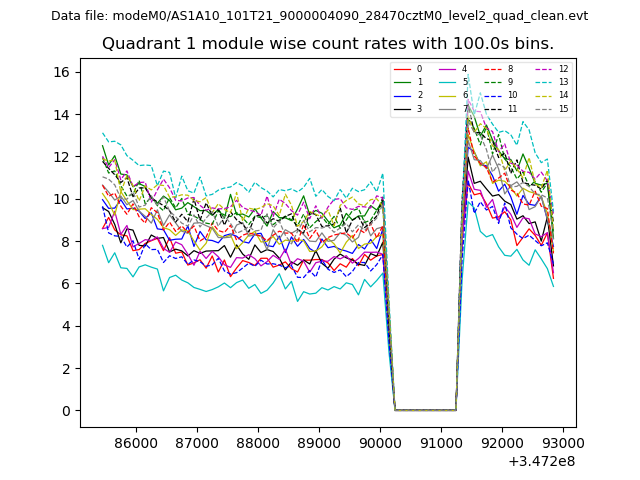
| Quadrant-wise count rates Data is divided into 100 sec bins |
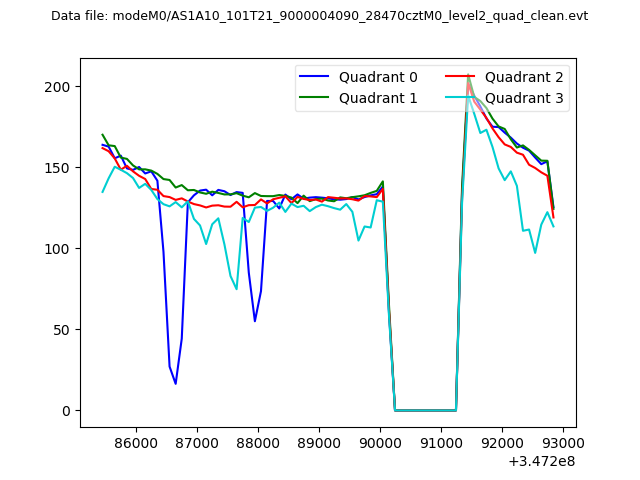 |
|
| Module-wise count rates for Quadrant A Data is divided into 100 sec bins |
 |
 |
| Module-wise count rates for Quadrant B Data is divided into 100 sec bins |
 |
 |
| Module-wise count rates for Quadrant C Data is divided into 100 sec bins |
 |
 |
| Module-wise count rates for Quadrant D Data is divided into 100 sec bins |
 |
 |
| Parameter | Plot |
|---|---|
| CZT HV Monitor |  |
| D_VDD | 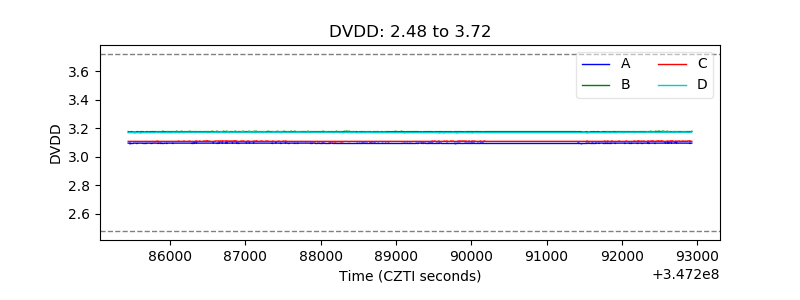 |
| Temperature 1 | 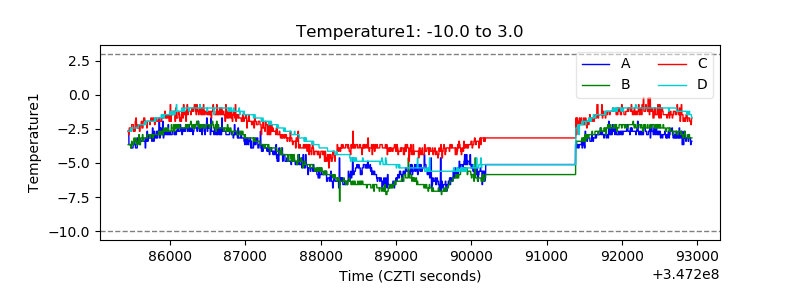 |
| Veto HV Monitor | 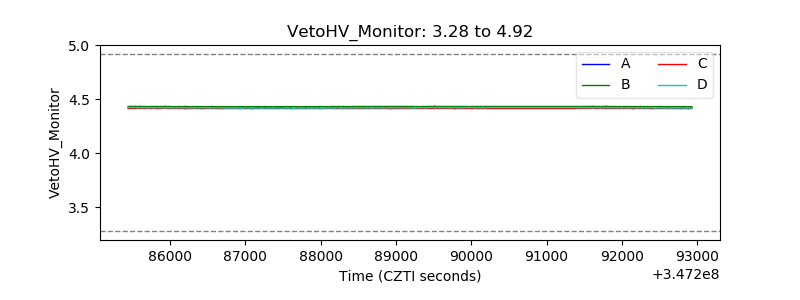 |
| Veto LLD | 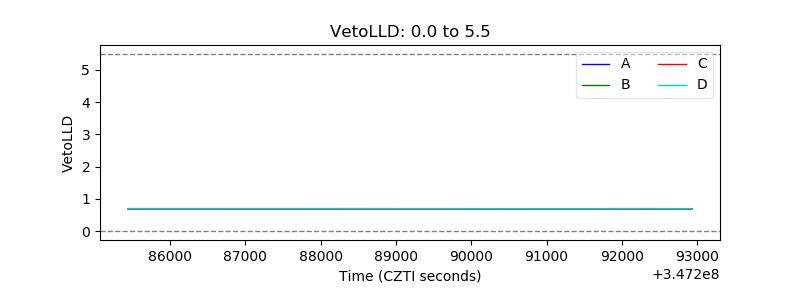 |
| Alpha Counter | 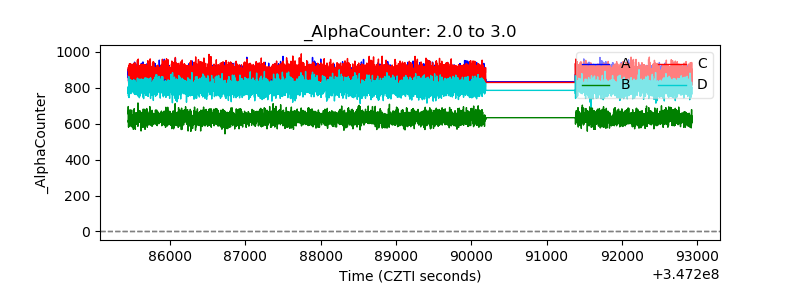 |
| _CPM_Rate | 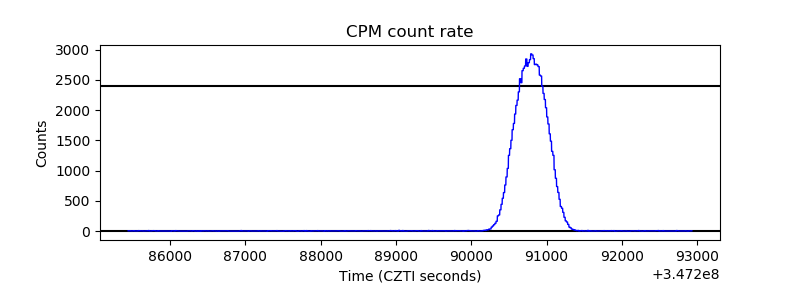 |
| CZT Counter | 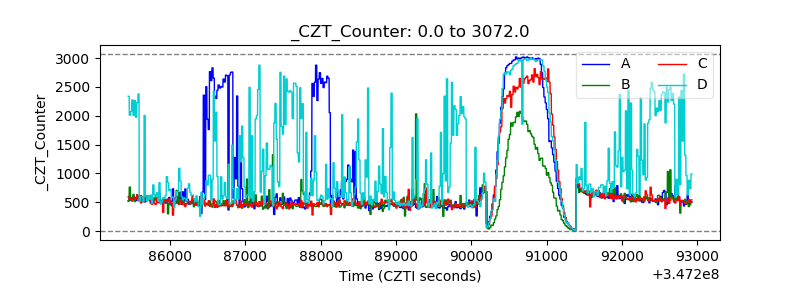 |
| +2.5 Volts monitor |  |
| +5 Volts monitor |  |
| _ROLL_ROT | 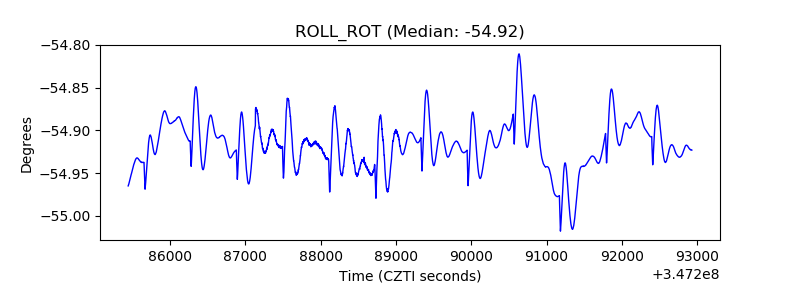 |
| _Roll_DEC | 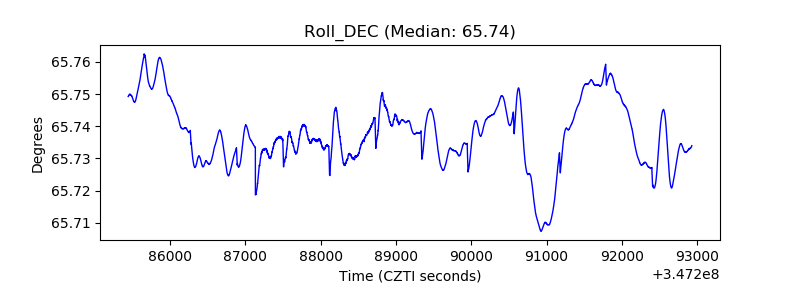 |
| _Roll_RA |  |
| Veto Counter |  |