| Param | Original file | Final file |
|---|---|---|
| Filename | modeM0/AS1A10_101T21_9000004090_28471cztM0_level2.evt | modeM0/AS1A10_101T21_9000004090_28471cztM0_level2_quad_clean.evt |
| Size (bytes) | 576,123,840 | 131,448,960 |
| Size | 549.4 MB | 125.4 MB |
| Events in quadrant A | 4,257,890 | 904,150 |
| Events in quadrant B | 3,321,182 | 928,291 |
| Events in quadrant C | 3,225,012 | 900,725 |
| Events in quadrant D | 6,237,113 | 828,299 |
| Mode M0 | |||
|---|---|---|---|
| Quadrant | BADHDUFLAG | Total packets | Discarded packets |
| A | 0 | 16606 | 0 |
| B | 0 | 13743 | 0 |
| C | 0 | 13362 | 0 |
| D | 0 | 22707 | 0 |
| Mode M9 | |||
|---|---|---|---|
| Quadrant | BADHDUFLAG | Total packets | Discarded packets |
| A | 0 | 13 | 0 |
| B | 0 | 13 | 0 |
| C | 0 | 13 | 0 |
| D | 0 | 13 | 0 |
| Quadrant | Total seconds | Saturated seconds | Saturation percentage |
|---|---|---|---|
| A | 6014 | 273 | 4.539408% |
| B | 6015 | 97 | 1.612635% |
| C | 6014 | 110 | 1.829066% |
| D | 6014 | 1037 | 17.243099% |
Noise dominated data is calculated using 1-second bins in cleaned event files. If a bin has >2000 counts, and if more than 50% of those come from <1% of pixels, then it is considered to be noise-dominated and hence unusable.
| Quadrant | # 1 sec bins | Bins with >0 counts | Bins with >2000 counts | High rate bins dominated by noise | Noise dominated (total time) | Noise dominated (detector-on time) | Marked lightcurve |
|---|---|---|---|---|---|---|---|
| A | 7289 | 6014 | 190 | 190 | 2.61% | 3.16% | 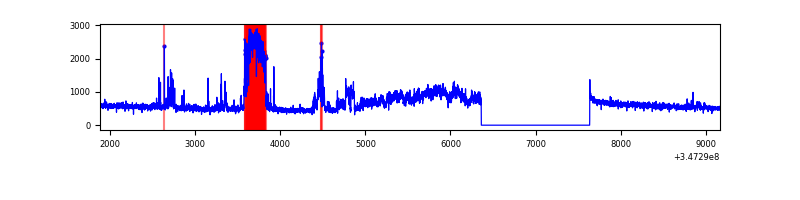 |
| B | 7290 | 6015 | 28 | 28 | 0.38% | 0.47% | 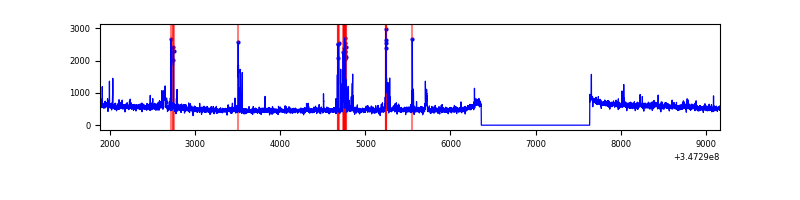 |
| C | 7289 | 6014 | 0 | 0 | 0.00% | 0.00% | 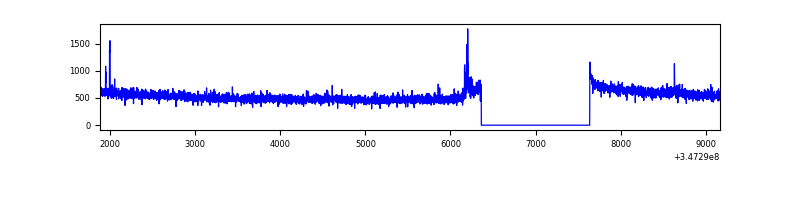 |
| D | 7289 | 6014 | 967 | 967 | 13.27% | 16.08% | 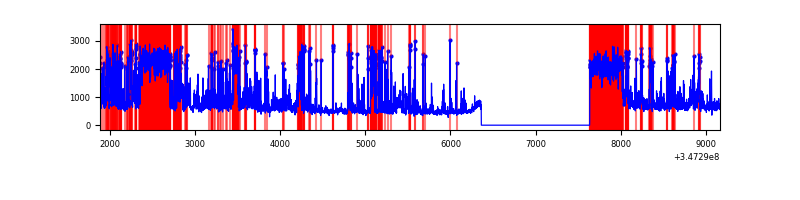 |
Top three noisy pixels from each quadrant. If the there are fewer than three noisy pixels in the level2.evt file, extra rows are filled as -1
| Pixel properties | Quadrant properties | ||||||
|---|---|---|---|---|---|---|---|
| Quadrant | DetID | PixID | Counts | Sigma | Mean | Median | Sigma |
| A | 15 | 174 | 1233815 | 7993.62 | 781 | 766 | 154.3 |
| A | 6 | 16 | 9535 | 56.85 | 781 | 766 | 154.3 |
| A | 13 | 254 | 9209 | 54.73 | 781 | 766 | 154.3 |
| B | 10 | 245 | 237706 | 1635.62 | 778 | 758 | 144.9 |
| B | 0 | 230 | 29398 | 197.7 | 778 | 758 | 144.9 |
| B | 12 | 111 | 17016 | 112.23 | 778 | 758 | 144.9 |
| C | 14 | 238 | 127545 | 719.12 | 771 | 779 | 176.3 |
| C | 7 | 247 | 42408 | 236.15 | 771 | 779 | 176.3 |
| C | 15 | 208 | 28776 | 158.82 | 771 | 779 | 176.3 |
| D | 1 | 52 | 1869510 | 10626.26 | 746 | 728 | 175.9 |
| D | 8 | 195 | 1381644 | 7852.16 | 746 | 728 | 175.9 |
| D | 12 | 233 | 66776 | 375.56 | 746 | 728 | 175.9 |
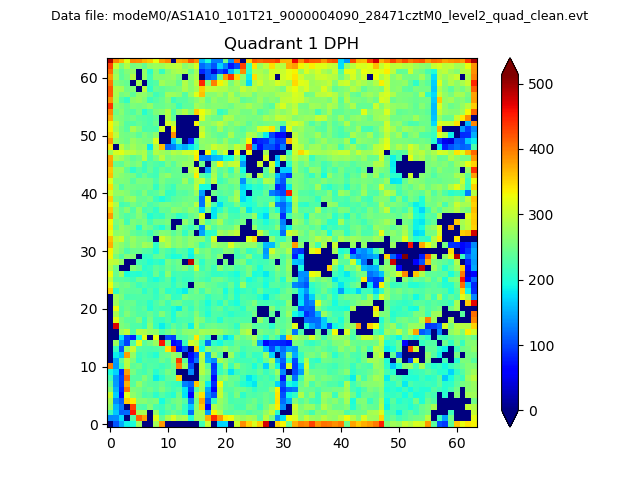
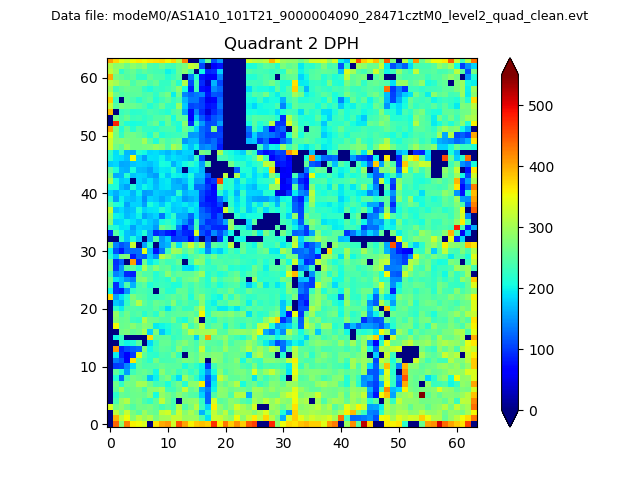
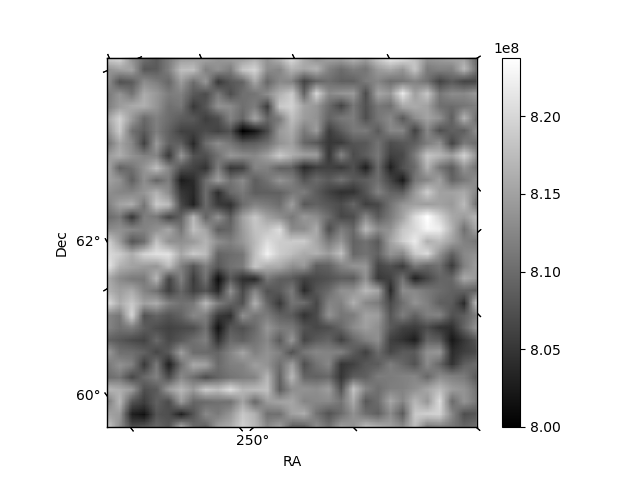
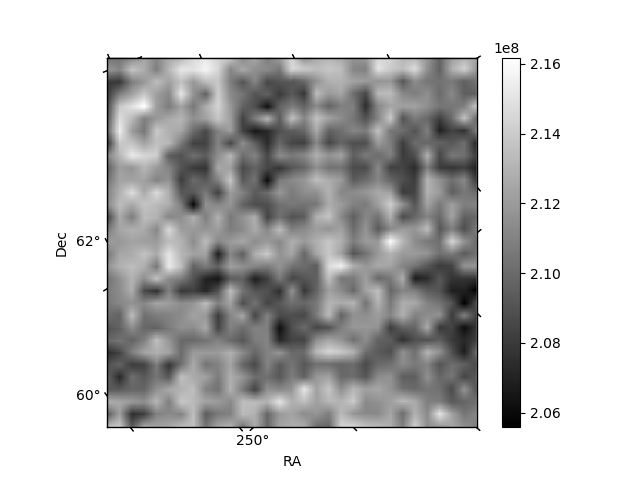
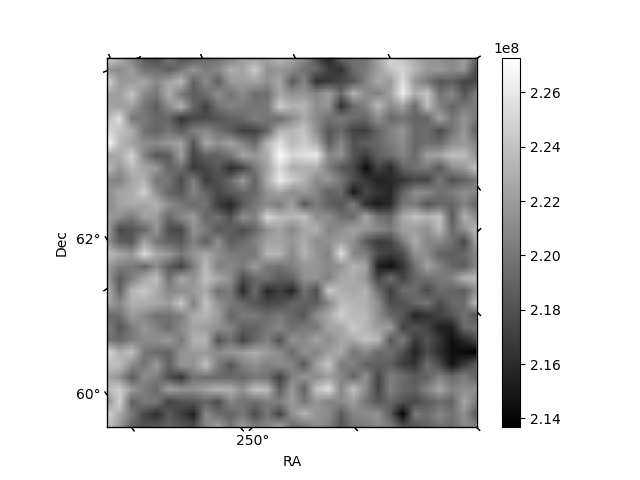
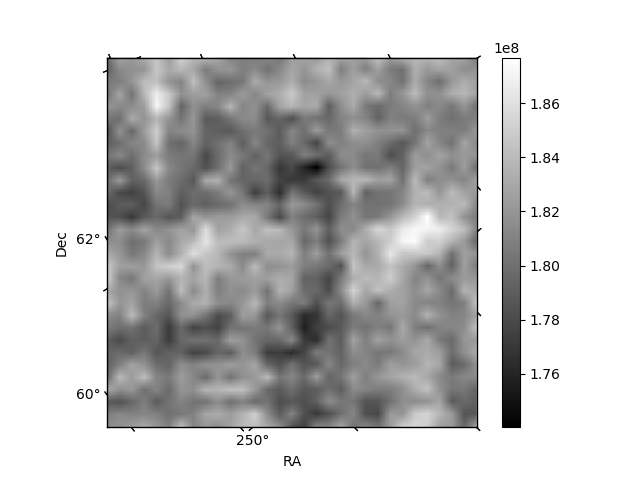
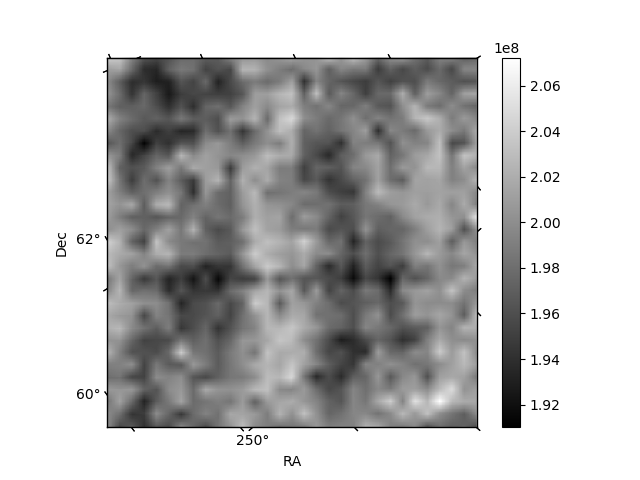
Histogram calculated using DETX and DETY for each event in the final _common_clean file
| Quadrant A |  |
 |
Quadrant B |
|---|---|---|---|
| Quadrant D | 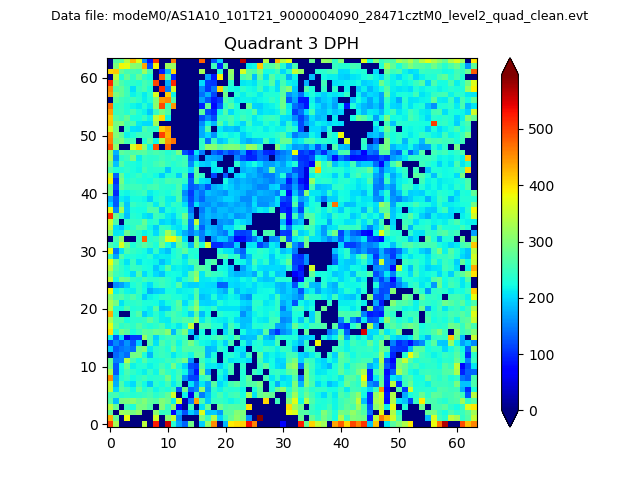 |
 |
Quadrant C |
| Plot type | Count rate plots | Images |
|---|---|---|
| Comparison with Poisson distribution Blue bars denote a histogram of data divided into 1 sec bins. Red curve is a Poisson curve with rate = median count rate of data. |
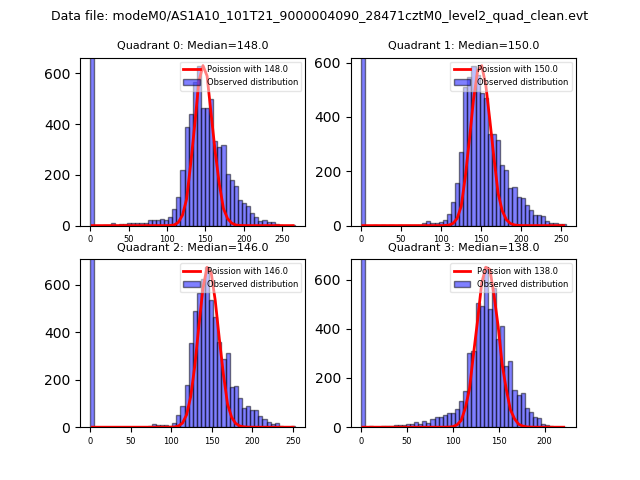 |
 |
| Quadrant-wise count rates Data is divided into 100 sec bins |
 |
|
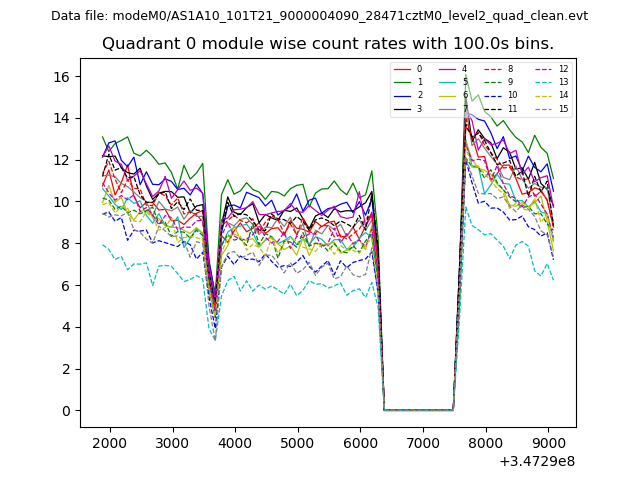
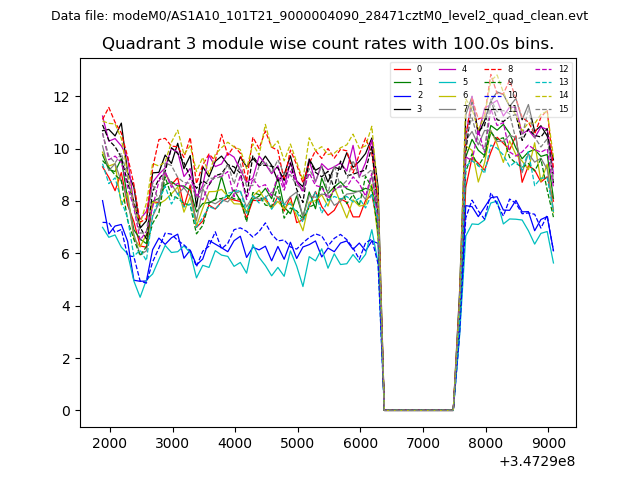
| Module-wise count rates for Quadrant A Data is divided into 100 sec bins |
 |
 |
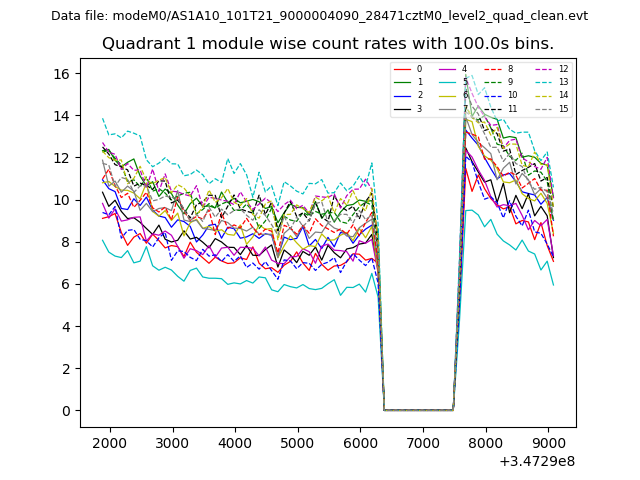
| Module-wise count rates for Quadrant B Data is divided into 100 sec bins |
 |
 |
| Module-wise count rates for Quadrant C Data is divided into 100 sec bins |
 |
 |
| Module-wise count rates for Quadrant D Data is divided into 100 sec bins |
 |
 |
| Parameter | Plot |
|---|---|
| CZT HV Monitor |  |
| D_VDD | 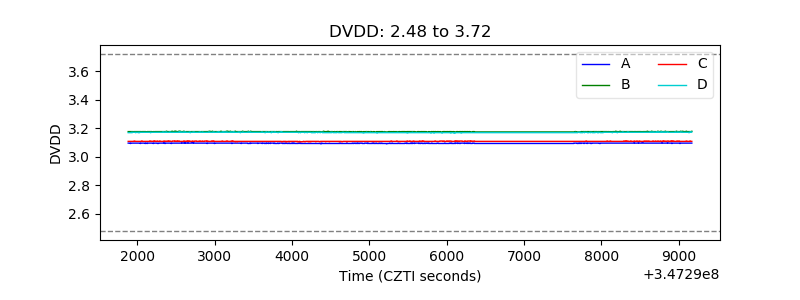 |
| Temperature 1 | 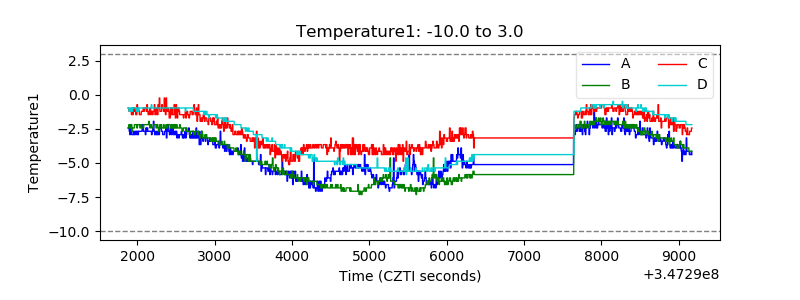 |
| Veto HV Monitor | 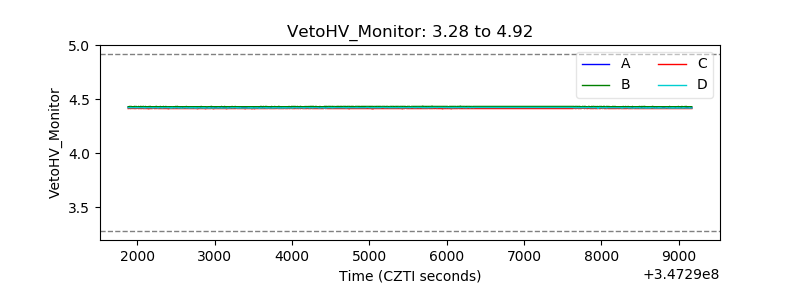 |
| Veto LLD | 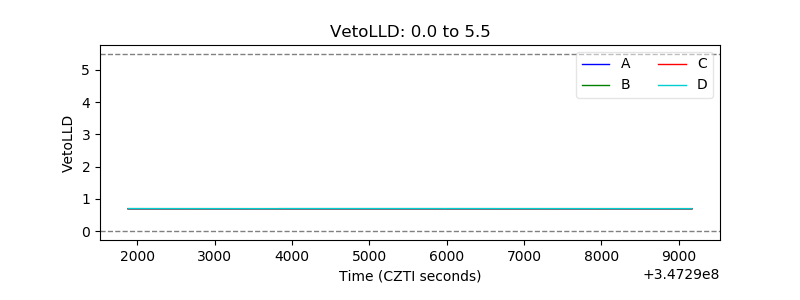 |
| Alpha Counter | 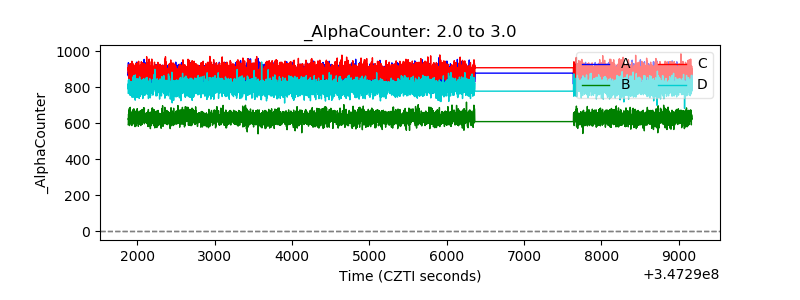 |
| _CPM_Rate | 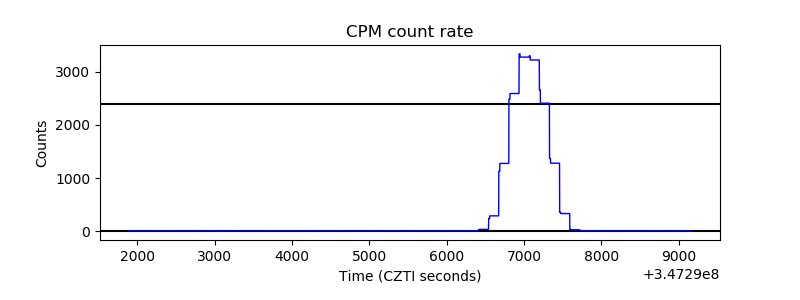 |
| CZT Counter | 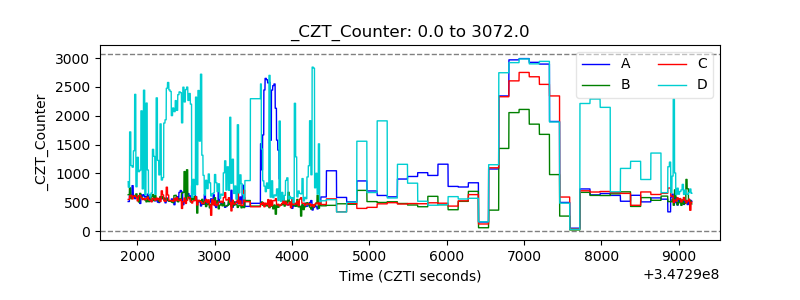 |
| +2.5 Volts monitor |  |
| +5 Volts monitor |  |
| _ROLL_ROT |  |
| _Roll_DEC | 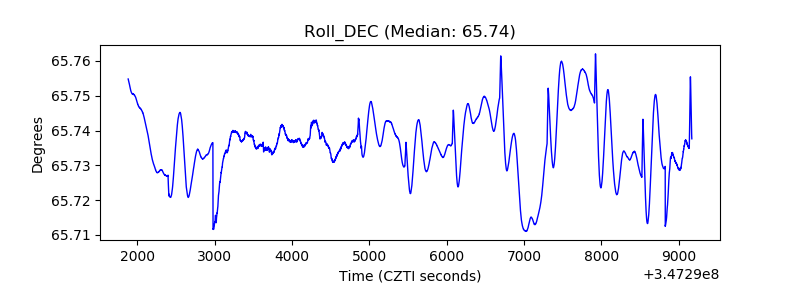 |
| _Roll_RA | 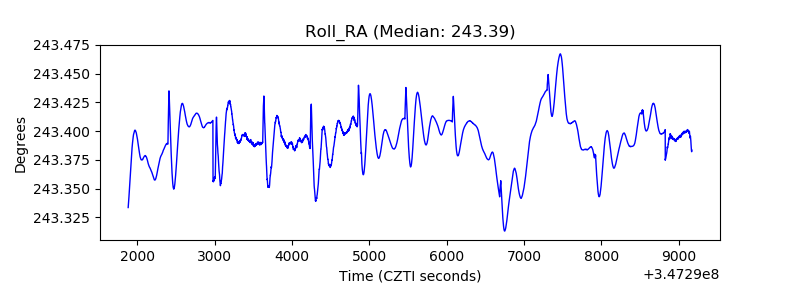 |
| Veto Counter | 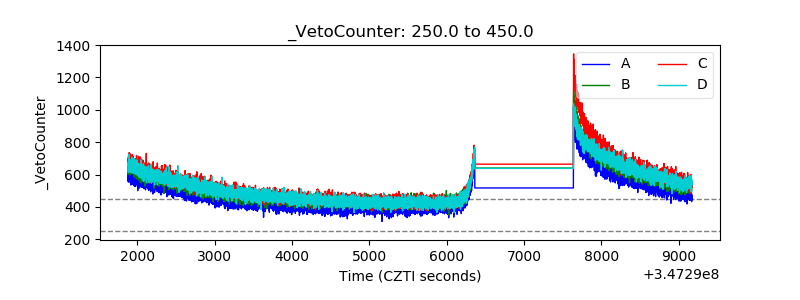 |