| Param | Original file | Final file |
|---|---|---|
| Filename | modeM0/AS1A10_050T06_9000004092_28474cztM0_level2.evt | modeM0/AS1A10_050T06_9000004092_28474cztM0_level2_quad_clean.evt |
| Size (bytes) | 645,287,040 | 112,927,680 |
| Size | 615.4 MB | 107.7 MB |
| Events in quadrant A | 4,141,792 | 751,823 |
| Events in quadrant B | 5,386,305 | 739,599 |
| Events in quadrant C | 3,720,976 | 727,471 |
| Events in quadrant D | 5,808,236 | 702,041 |
| Mode M0 | |||
|---|---|---|---|
| Quadrant | BADHDUFLAG | Total packets | Discarded packets |
| A | 0 | 17082 | 2 |
| B | 0 | 20736 | 2 |
| C | 0 | 15569 | 2 |
| D | 0 | 22154 | 2 |
| Mode SS | |||
|---|---|---|---|
| Quadrant | BADHDUFLAG | Total packets | Discarded packets |
| A | 0 | 150 | 0 |
| B | 0 | 150 | 0 |
| C | 0 | 148 | 0 |
| D | 0 | 148 | 0 |
| Mode M9 | |||
|---|---|---|---|
| Quadrant | BADHDUFLAG | Total packets | Discarded packets |
| A | 0 | 24 | 0 |
| B | 0 | 24 | 0 |
| C | 0 | 24 | 0 |
| D | 0 | 24 | 0 |
| Quadrant | Total seconds | Saturated seconds | Saturation percentage |
|---|---|---|---|
| A | 7163 | 183 | 2.554795% |
| B | 7163 | 711 | 9.926009% |
| C | 7163 | 140 | 1.954488% |
| D | 7163 | 420 | 5.863465% |
Noise dominated data is calculated using 1-second bins in cleaned event files. If a bin has >2000 counts, and if more than 50% of those come from <1% of pixels, then it is considered to be noise-dominated and hence unusable.
| Quadrant | # 1 sec bins | Bins with >0 counts | Bins with >2000 counts | High rate bins dominated by noise | Noise dominated (total time) | Noise dominated (detector-on time) | Marked lightcurve |
|---|---|---|---|---|---|---|---|
| A | 9604 | 7164 | 56 | 56 | 0.58% | 0.78% | 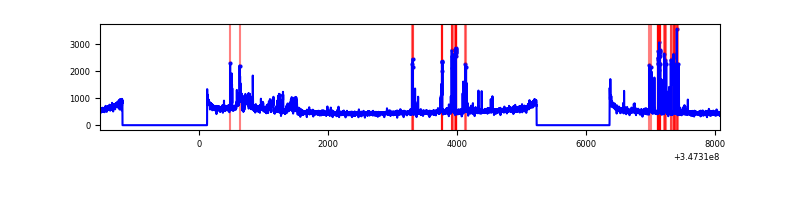 |
| B | 9604 | 7163 | 475 | 475 | 4.95% | 6.63% | 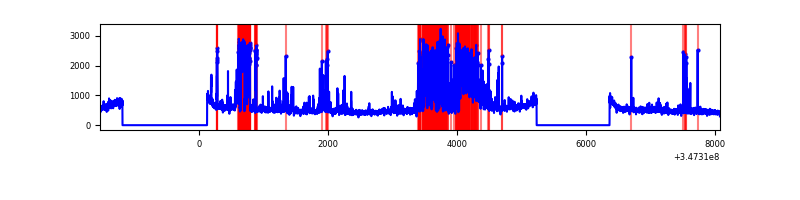 |
| C | 9604 | 7163 | 0 | 0 | 0.00% | 0.00% | 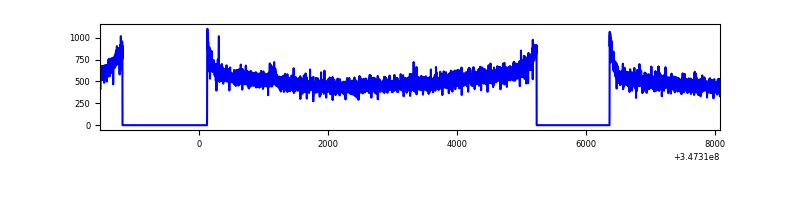 |
| D | 9604 | 7165 | 401 | 401 | 4.18% | 5.60% | 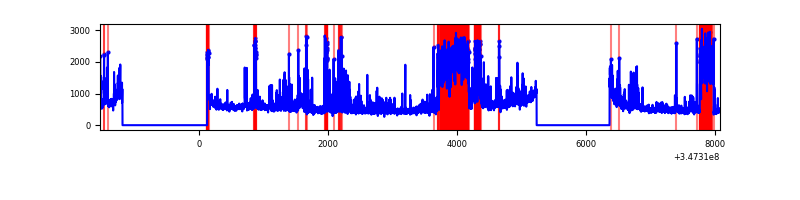 |
Top three noisy pixels from each quadrant. If the there are fewer than three noisy pixels in the level2.evt file, extra rows are filled as -1
| Pixel properties | Quadrant properties | ||||||
|---|---|---|---|---|---|---|---|
| Quadrant | DetID | PixID | Counts | Sigma | Mean | Median | Sigma |
| A | 12 | 96 | 288788 | 1543.29 | 937 | 921 | 186.5 |
| A | 15 | 174 | 234922 | 1254.5 | 937 | 921 | 186.5 |
| A | 13 | 254 | 11406 | 56.21 | 937 | 921 | 186.5 |
| B | 10 | 246 | 1268618 | 7395.99 | 906 | 885 | 171.4 |
| B | 10 | 245 | 554261 | 3228.41 | 906 | 885 | 171.4 |
| B | 12 | 111 | 21913 | 122.68 | 906 | 885 | 171.4 |
| C | 14 | 238 | 145663 | 685.93 | 900 | 909 | 211.0 |
| C | 3 | 233 | 36243 | 167.43 | 900 | 909 | 211.0 |
| C | 7 | 247 | 24905 | 113.71 | 900 | 909 | 211.0 |
| D | 1 | 52 | 1317808 | 6283.2 | 886 | 865 | 209.6 |
| D | 8 | 195 | 1101175 | 5249.63 | 886 | 865 | 209.6 |
| D | 2 | 234 | 23334 | 107.2 | 886 | 865 | 209.6 |
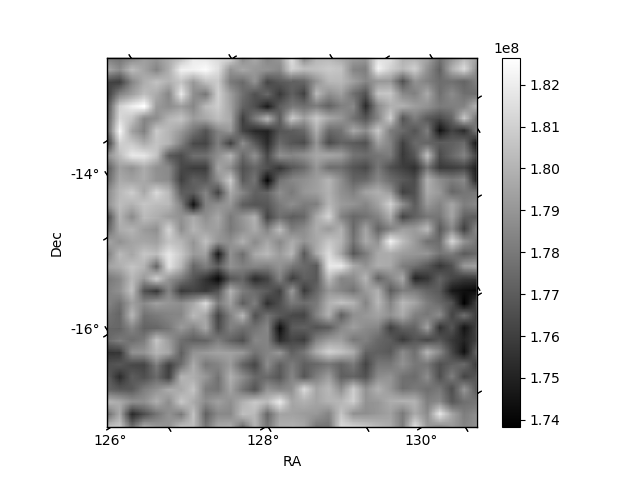
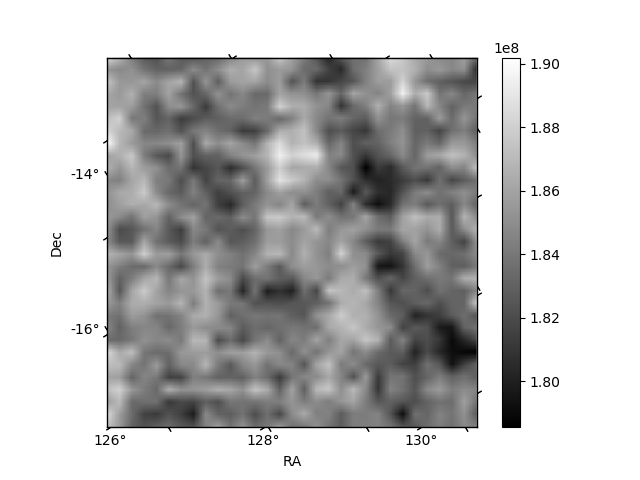
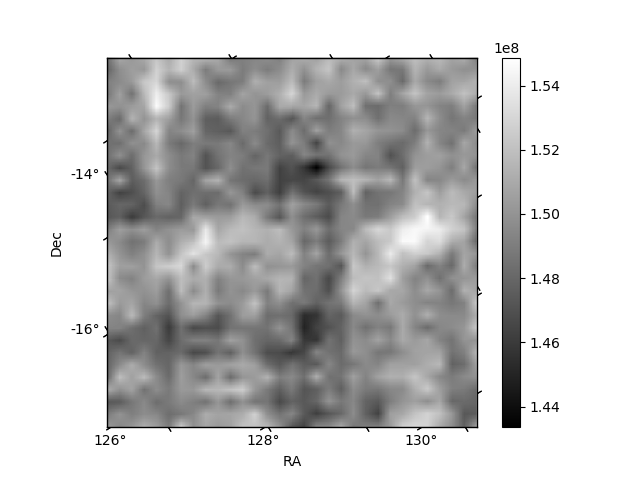
Histogram calculated using DETX and DETY for each event in the final _common_clean file
| Quadrant A | 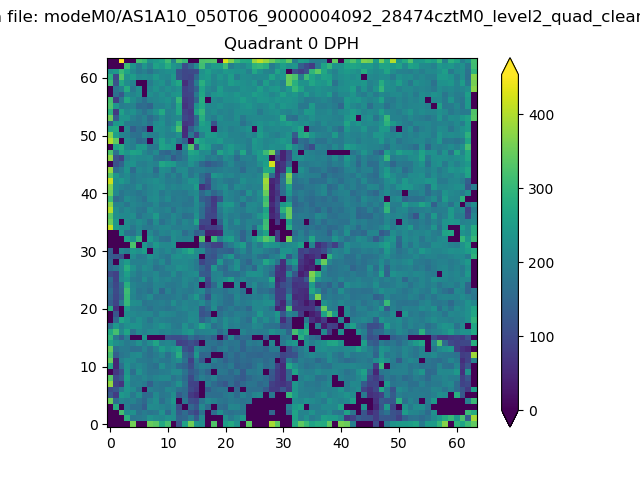 |
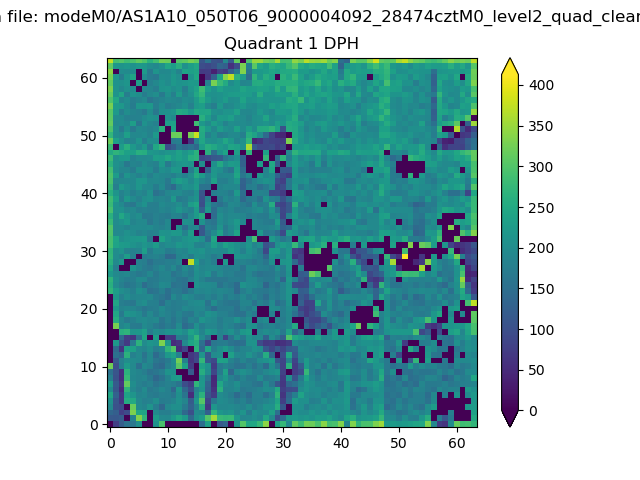 |
Quadrant B |
|---|---|---|---|
| Quadrant D | 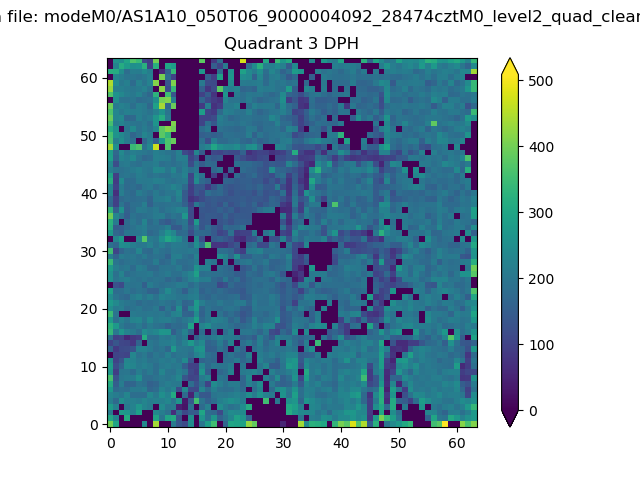 |
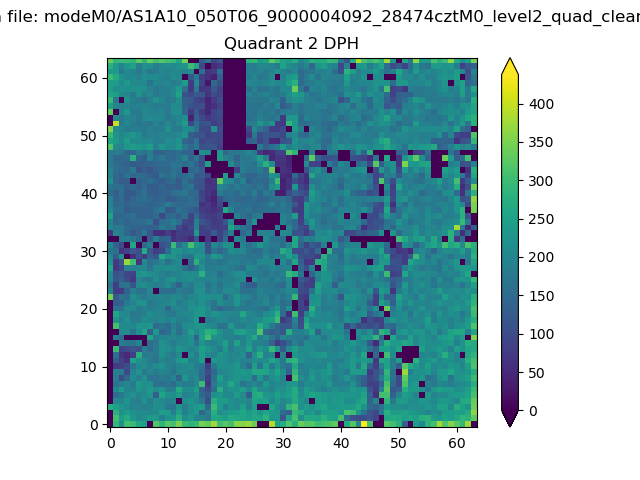 |
Quadrant C |
| Plot type | Count rate plots | Images |
|---|---|---|
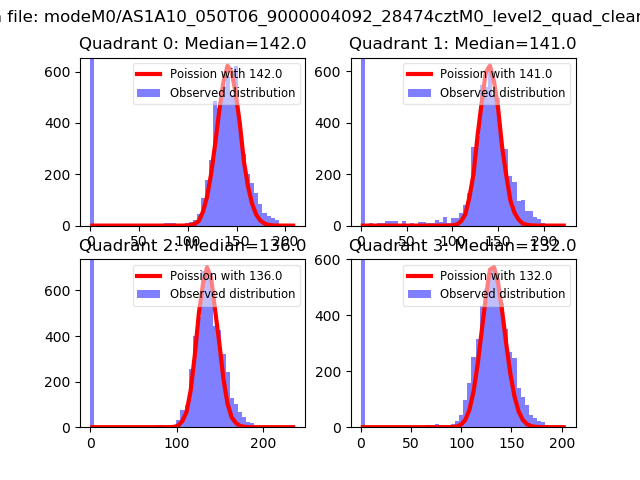
| Comparison with Poisson distribution Blue bars denote a histogram of data divided into 1 sec bins. Red curve is a Poisson curve with rate = median count rate of data. |
 |
 |
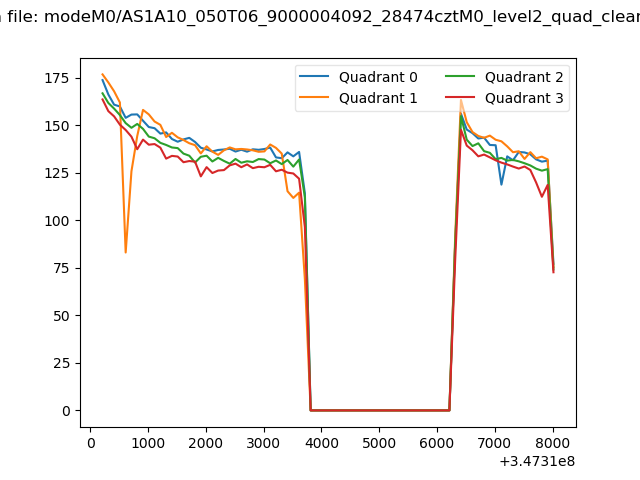
| Quadrant-wise count rates Data is divided into 100 sec bins |
 |
|
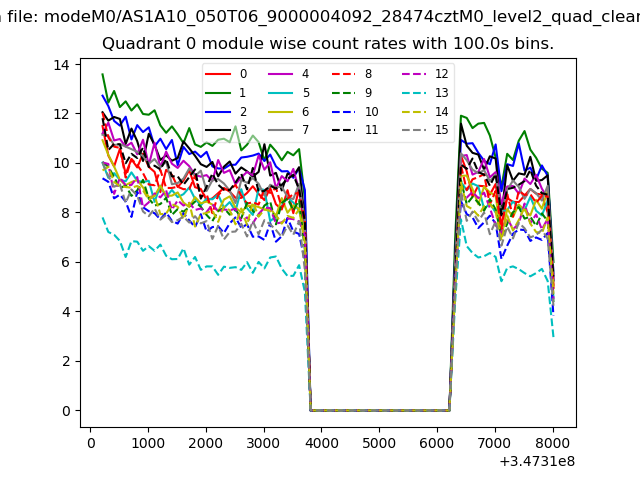
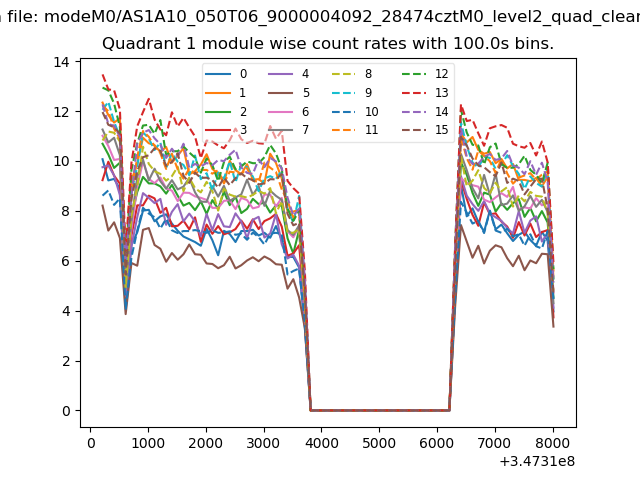
| Module-wise count rates for Quadrant A Data is divided into 100 sec bins |
 |
 |
| Module-wise count rates for Quadrant B Data is divided into 100 sec bins |
 |
 |
| Module-wise count rates for Quadrant C Data is divided into 100 sec bins |
 |
 |
| Module-wise count rates for Quadrant D Data is divided into 100 sec bins |
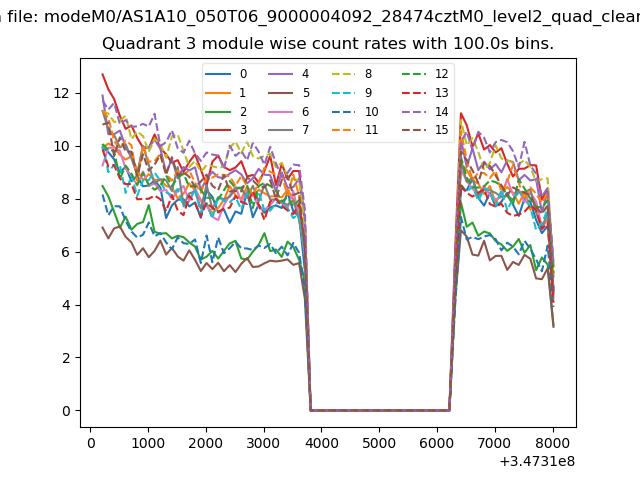 |
 |
| Parameter | Plot |
|---|---|
| CZT HV Monitor | 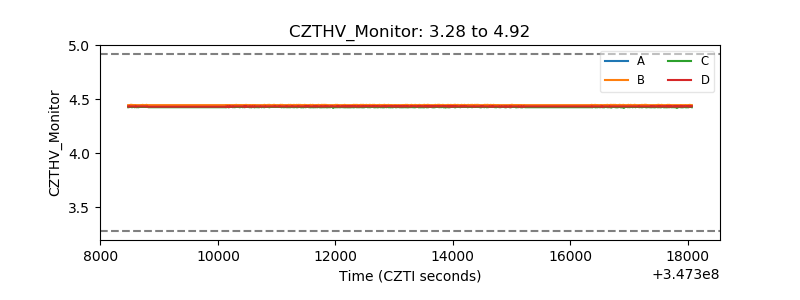 |
| D_VDD | 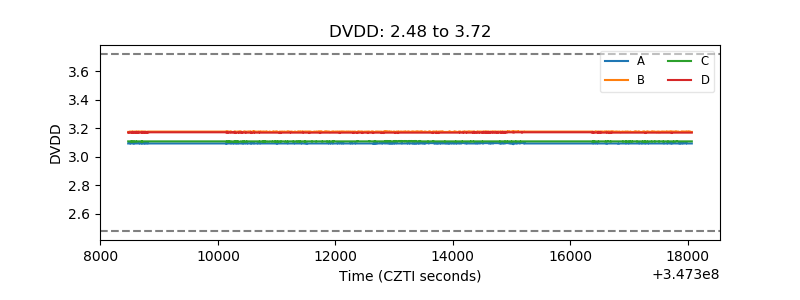 |
| Temperature 1 | 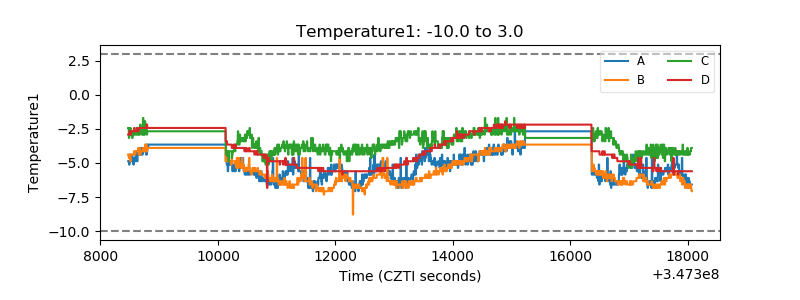 |
| Veto HV Monitor | 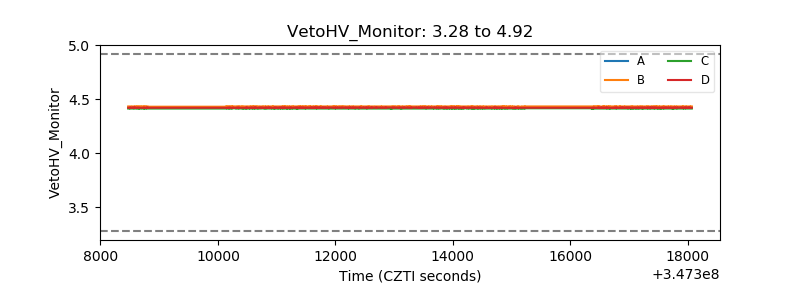 |
| Veto LLD |  |
| Alpha Counter | 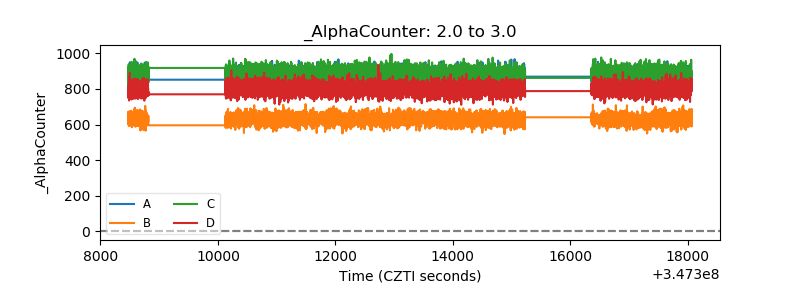 |
| _CPM_Rate | 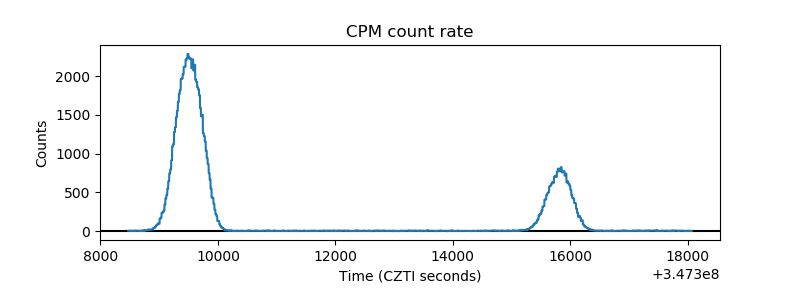 |
| CZT Counter | 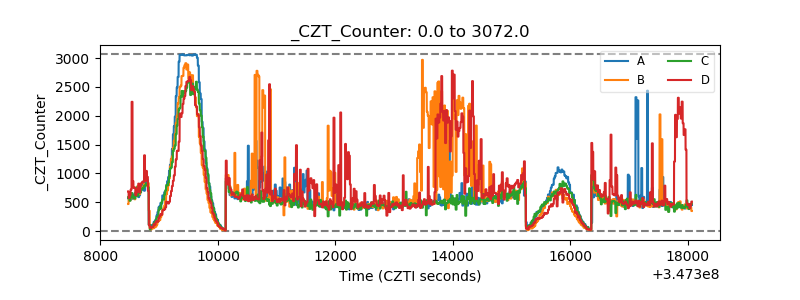 |
| +2.5 Volts monitor |  |
| +5 Volts monitor |  |
| _ROLL_ROT | 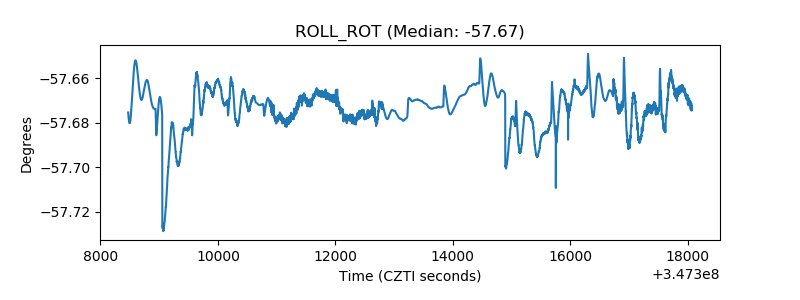 |
| _Roll_DEC | 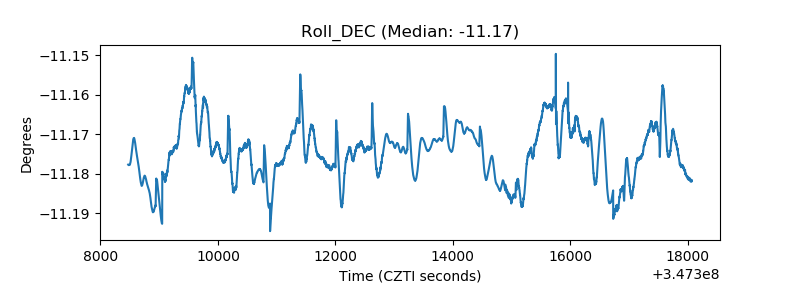 |
| _Roll_RA | 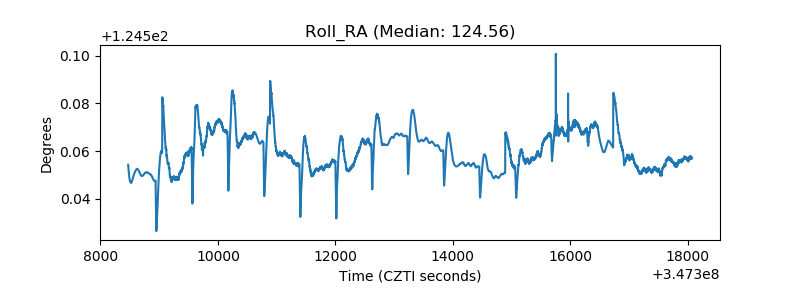 |
| Veto Counter |  |