| Param | Original file | Final file |
|---|---|---|
| Filename | modeM0/AS1A10_050T06_9000004092_28475cztM0_level2.evt | modeM0/AS1A10_050T06_9000004092_28475cztM0_level2_quad_clean.evt |
| Size (bytes) | 597,974,400 | 100,077,120 |
| Size | 570.3 MB | 95.4 MB |
| Events in quadrant A | 3,696,955 | 648,902 |
| Events in quadrant B | 5,775,384 | 652,625 |
| Events in quadrant C | 3,580,207 | 627,642 |
| Events in quadrant D | 4,580,633 | 612,157 |
| Mode M0 | |||
|---|---|---|---|
| Quadrant | BADHDUFLAG | Total packets | Discarded packets |
| A | 0 | 15541 | 2 |
| B | 0 | 21784 | 2 |
| C | 0 | 15134 | 2 |
| D | 0 | 18265 | 2 |
| Mode SS | |||
|---|---|---|---|
| Quadrant | BADHDUFLAG | Total packets | Discarded packets |
| A | 0 | 144 | 0 |
| B | 0 | 144 | 0 |
| C | 0 | 144 | 0 |
| D | 0 | 144 | 0 |
| Mode M9 | |||
|---|---|---|---|
| Quadrant | BADHDUFLAG | Total packets | Discarded packets |
| A | 0 | 11 | 0 |
| B | 0 | 12 | 0 |
| C | 0 | 12 | 0 |
| D | 0 | 12 | 0 |
| Quadrant | Total seconds | Saturated seconds | Saturation percentage |
|---|---|---|---|
| A | 7023 | 104 | 1.480849% |
| B | 7023 | 1269 | 18.069201% |
| C | 7023 | 104 | 1.480849% |
| D | 7023 | 119 | 1.694433% |
Noise dominated data is calculated using 1-second bins in cleaned event files. If a bin has >2000 counts, and if more than 50% of those come from <1% of pixels, then it is considered to be noise-dominated and hence unusable.
| Quadrant | # 1 sec bins | Bins with >0 counts | Bins with >2000 counts | High rate bins dominated by noise | Noise dominated (total time) | Noise dominated (detector-on time) | Marked lightcurve |
|---|---|---|---|---|---|---|---|
| A | 7843 | 7023 | 46 | 46 | 0.59% | 0.65% | 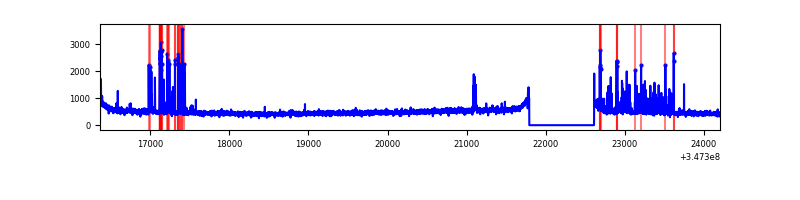 |
| B | 7843 | 7023 | 945 | 945 | 12.05% | 13.46% | 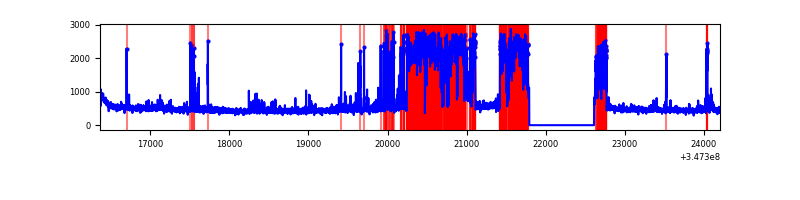 |
| C | 7843 | 7023 | 4 | 4 | 0.05% | 0.06% | 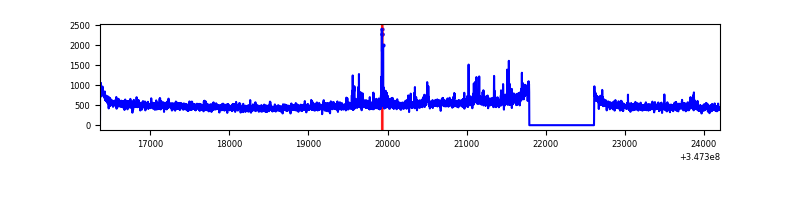 |
| D | 7843 | 7023 | 128 | 128 | 1.63% | 1.82% | 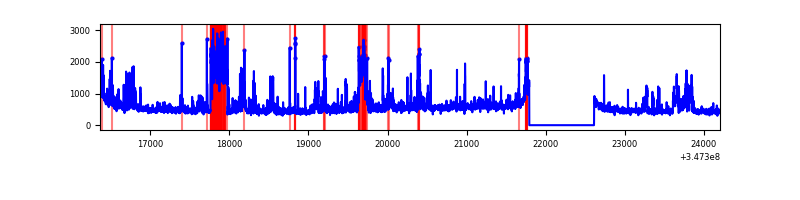 |
Top three noisy pixels from each quadrant. If the there are fewer than three noisy pixels in the level2.evt file, extra rows are filled as -1
| Pixel properties | Quadrant properties | ||||||
|---|---|---|---|---|---|---|---|
| Quadrant | DetID | PixID | Counts | Sigma | Mean | Median | Sigma |
| A | 12 | 96 | 326430 | 1848.87 | 873 | 858 | 176.1 |
| A | 13 | 254 | 11889 | 62.64 | 873 | 858 | 176.1 |
| A | 3 | 137 | 8621 | 44.08 | 873 | 858 | 176.1 |
| B | 10 | 245 | 2837172 | 19933.73 | 743 | 725 | 142.3 |
| B | 12 | 111 | 18274 | 123.33 | 743 | 725 | 142.3 |
| B | 11 | 111 | 16422 | 110.31 | 743 | 725 | 142.3 |
| C | 14 | 238 | 135295 | 680.38 | 838 | 845 | 197.6 |
| C | 7 | 220 | 117766 | 591.68 | 838 | 845 | 197.6 |
| C | 7 | 247 | 26324 | 128.94 | 838 | 845 | 197.6 |
| D | 1 | 52 | 786654 | 3911.76 | 837 | 815 | 200.9 |
| D | 8 | 195 | 605521 | 3010.11 | 837 | 815 | 200.9 |
| D | 2 | 234 | 22269 | 106.79 | 837 | 815 | 200.9 |
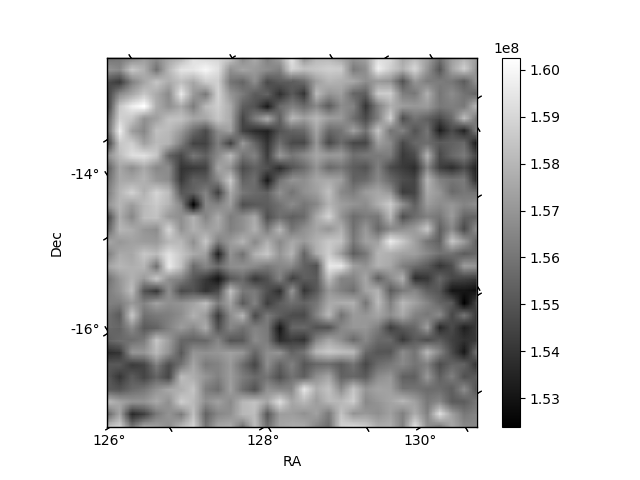
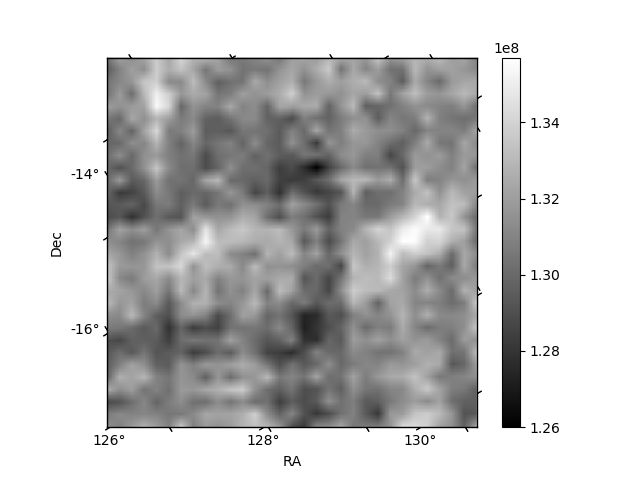
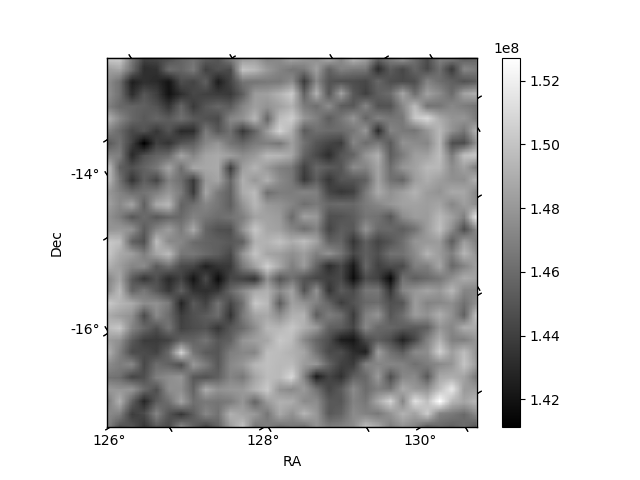
Histogram calculated using DETX and DETY for each event in the final _common_clean file
| Quadrant A |  |
 |
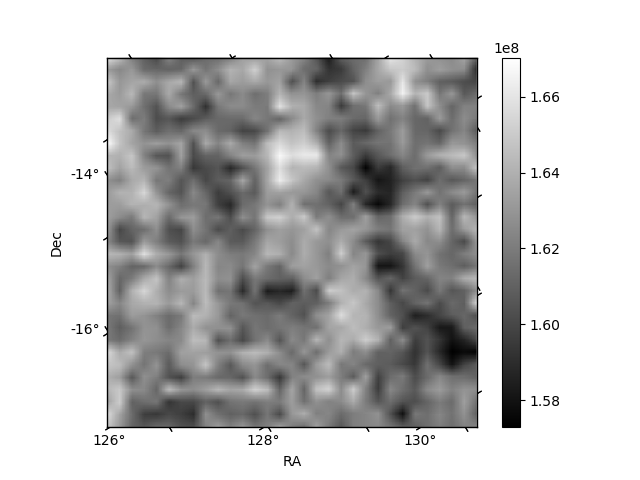
Quadrant B |
|---|---|---|---|
| Quadrant D |  |
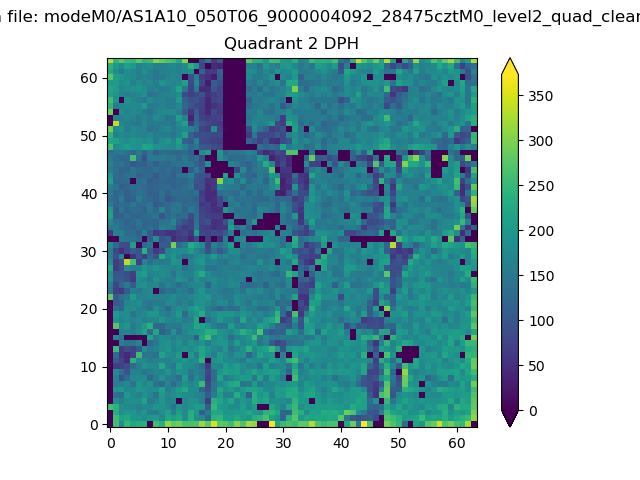 |
Quadrant C |
| Plot type | Count rate plots | Images |
|---|---|---|
| Comparison with Poisson distribution Blue bars denote a histogram of data divided into 1 sec bins. Red curve is a Poisson curve with rate = median count rate of data. |
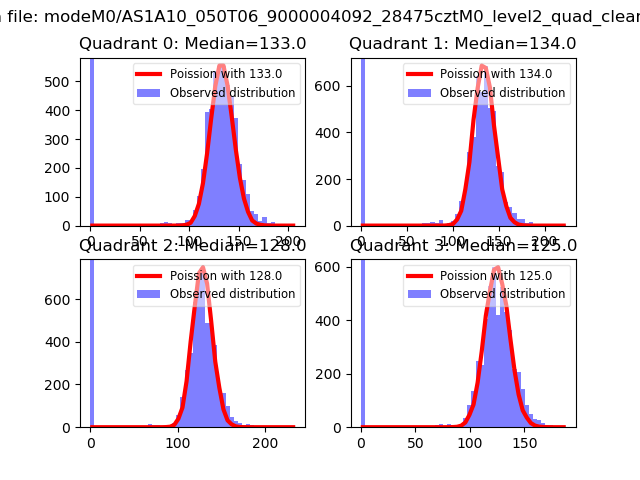 |
 |
| Quadrant-wise count rates Data is divided into 100 sec bins |
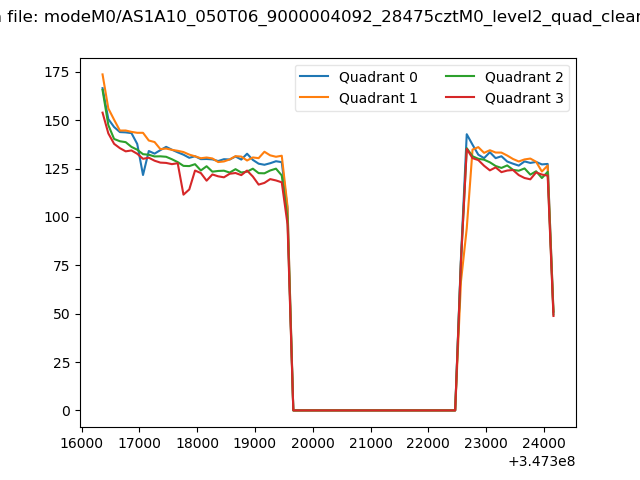 |
|
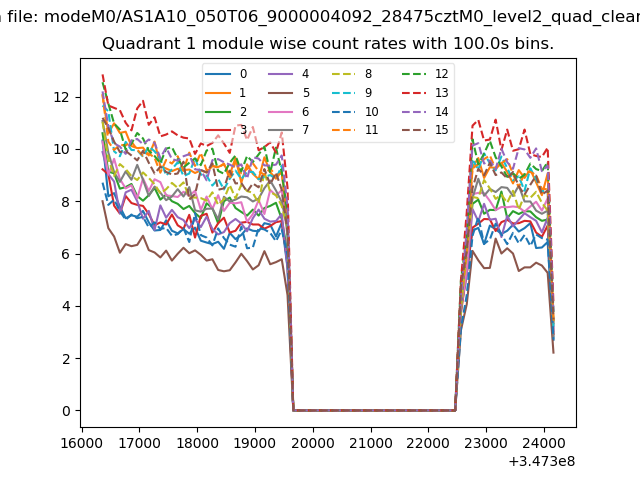
| Module-wise count rates for Quadrant A Data is divided into 100 sec bins |
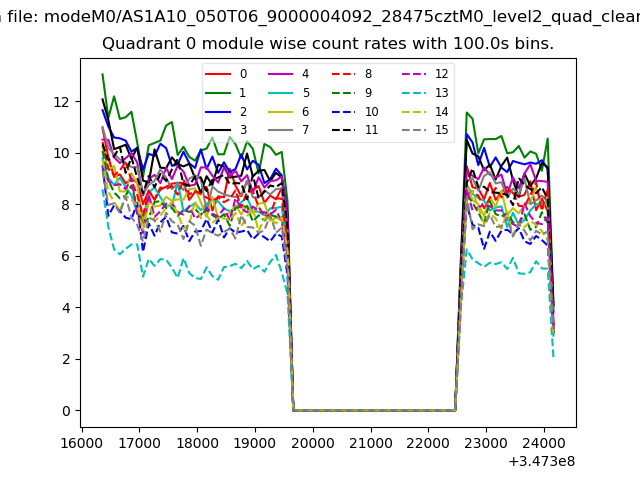 |
 |
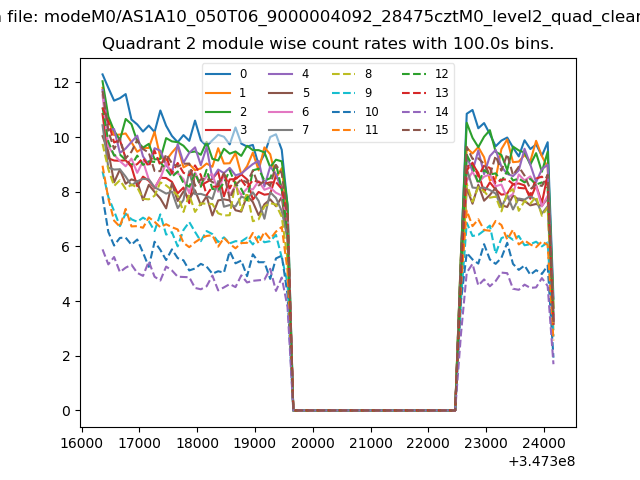
| Module-wise count rates for Quadrant B Data is divided into 100 sec bins |
 |
 |
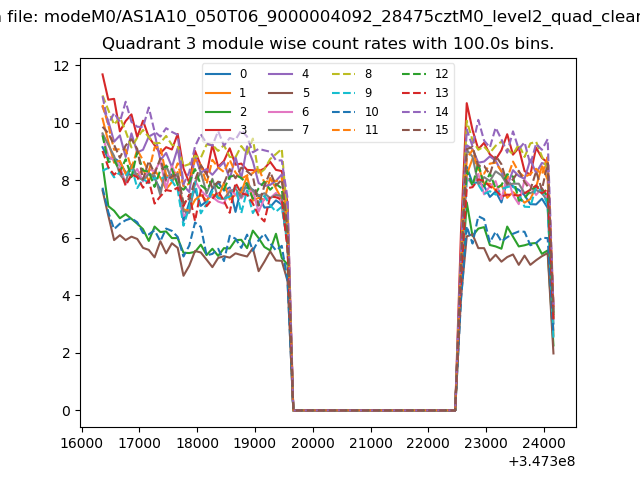
| Module-wise count rates for Quadrant C Data is divided into 100 sec bins |
 |
 |
| Module-wise count rates for Quadrant D Data is divided into 100 sec bins |
 |
 |
| Parameter | Plot |
|---|---|
| CZT HV Monitor | 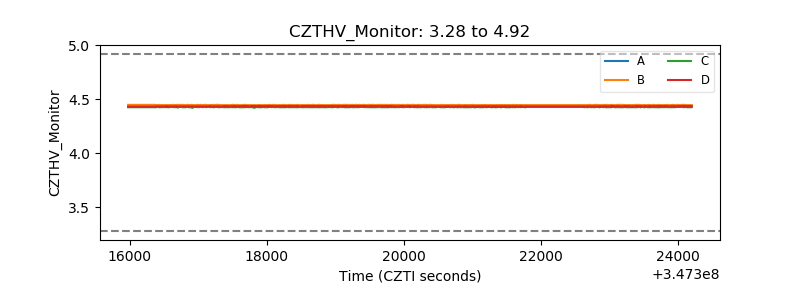 |
| D_VDD | 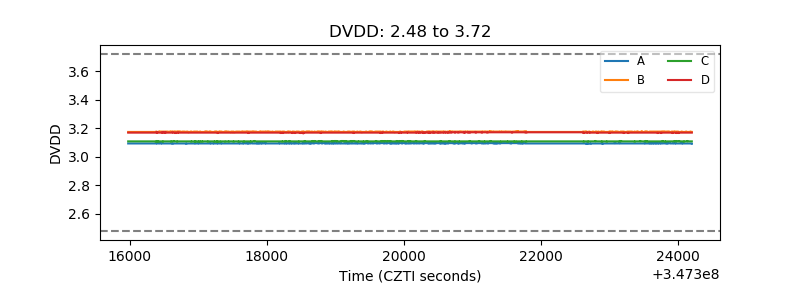 |
| Temperature 1 | 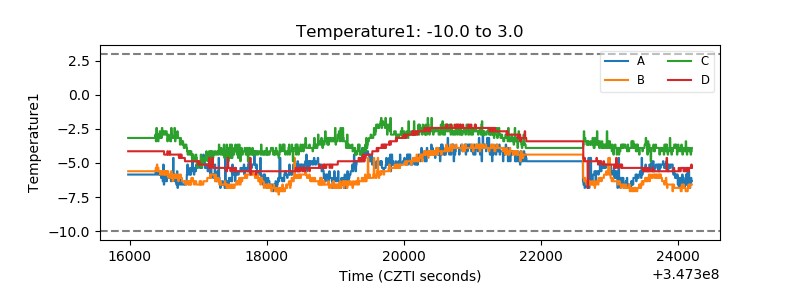 |
| Veto HV Monitor | 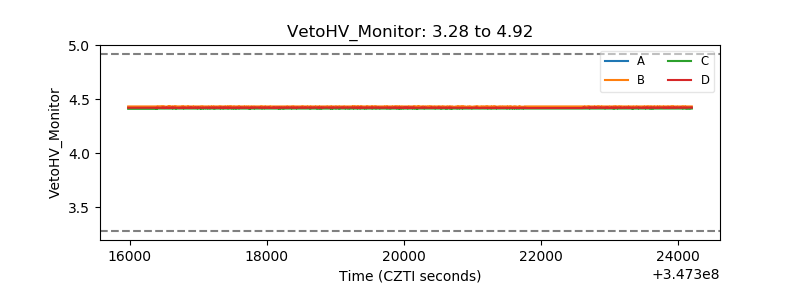 |
| Veto LLD |  |
| Alpha Counter | 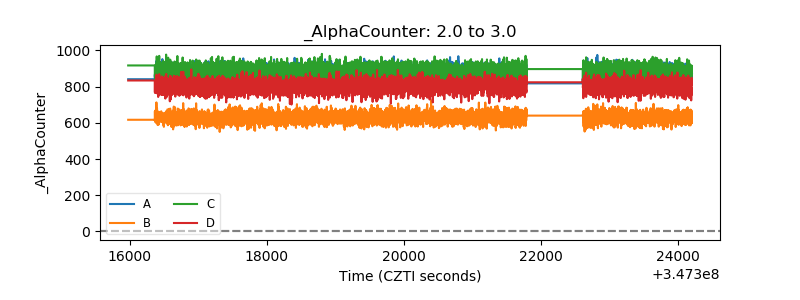 |
| _CPM_Rate | 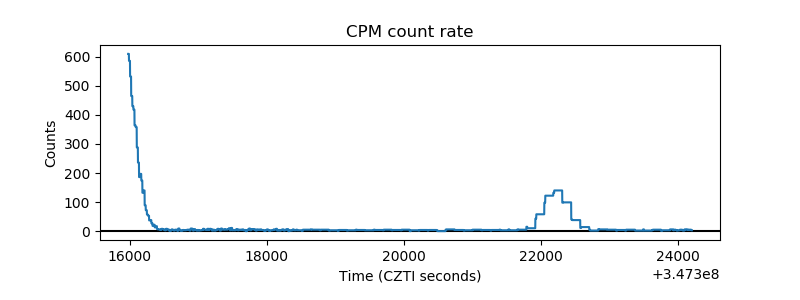 |
| CZT Counter | 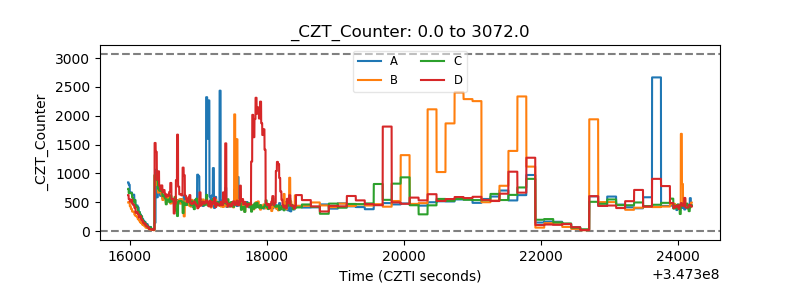 |
| +2.5 Volts monitor |  |
| +5 Volts monitor | 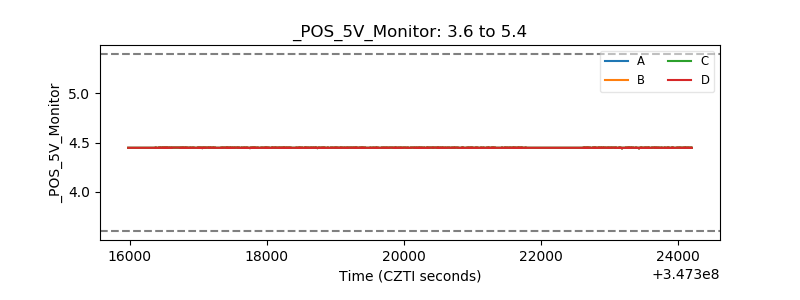 |
| _ROLL_ROT | 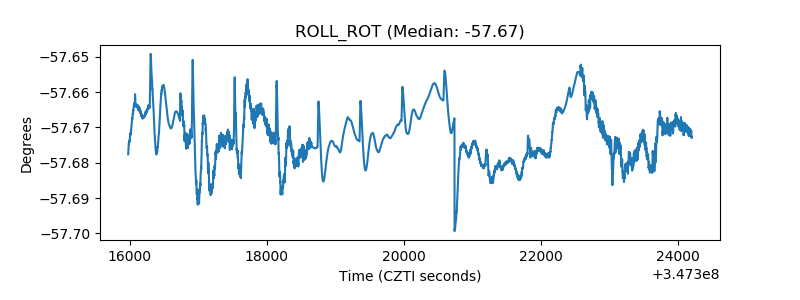 |
| _Roll_DEC | 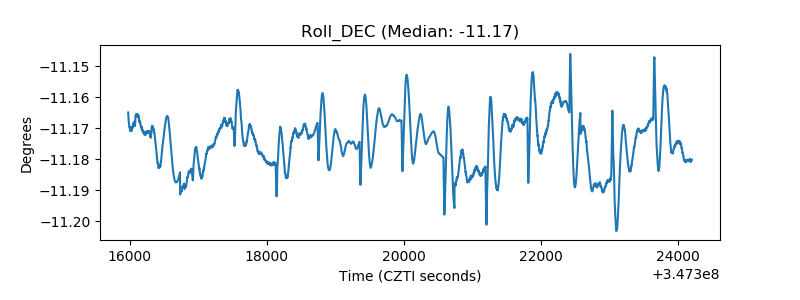 |
| _Roll_RA |  |
| Veto Counter | 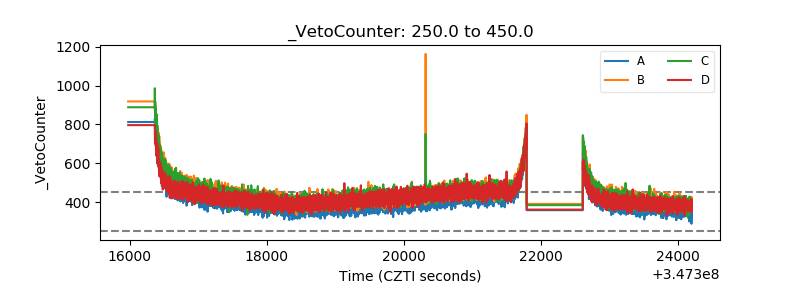 |