| Param | Original file | Final file |
|---|---|---|
| Filename | modeM0/AS1A10_050T06_9000004092_28476cztM0_level2.evt | modeM0/AS1A10_050T06_9000004092_28476cztM0_level2_quad_clean.evt |
| Size (bytes) | 714,605,760 | 101,062,080 |
| Size | 681.5 MB | 96.4 MB |
| Events in quadrant A | 3,699,049 | 673,328 |
| Events in quadrant B | 7,479,463 | 597,290 |
| Events in quadrant C | 3,746,732 | 647,697 |
| Events in quadrant D | 6,214,022 | 624,768 |
| Mode M0 | |||
|---|---|---|---|
| Quadrant | BADHDUFLAG | Total packets | Discarded packets |
| A | 0 | 15851 | 2 |
| B | 0 | 27289 | 2 |
| C | 0 | 15848 | 2 |
| D | 0 | 23611 | 2 |
| Mode SS | |||
|---|---|---|---|
| Quadrant | BADHDUFLAG | Total packets | Discarded packets |
| A | 0 | 152 | 0 |
| B | 0 | 152 | 0 |
| C | 0 | 152 | 0 |
| D | 0 | 152 | 0 |
| Mode M9 | |||
|---|---|---|---|
| Quadrant | BADHDUFLAG | Total packets | Discarded packets |
| A | 0 | 7 | 0 |
| B | 0 | 8 | 0 |
| C | 0 | 8 | 0 |
| D | 0 | 8 | 0 |
| Quadrant | Total seconds | Saturated seconds | Saturation percentage |
|---|---|---|---|
| A | 7423 | 86 | 1.158561% |
| B | 7423 | 1388 | 18.698639% |
| C | 7423 | 118 | 1.589654% |
| D | 7422 | 816 | 10.994341% |
Noise dominated data is calculated using 1-second bins in cleaned event files. If a bin has >2000 counts, and if more than 50% of those come from <1% of pixels, then it is considered to be noise-dominated and hence unusable.
| Quadrant | # 1 sec bins | Bins with >0 counts | Bins with >2000 counts | High rate bins dominated by noise | Noise dominated (total time) | Noise dominated (detector-on time) | Marked lightcurve |
|---|---|---|---|---|---|---|---|
| A | 7763 | 7424 | 12 | 12 | 0.15% | 0.16% | 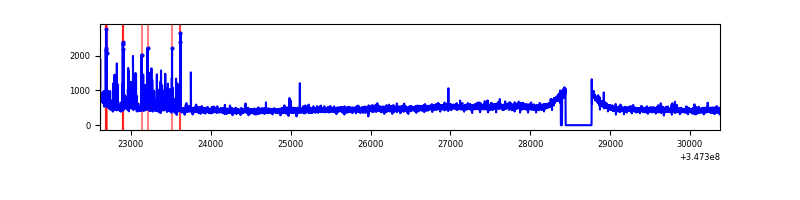 |
| B | 7763 | 7423 | 1008 | 1008 | 12.98% | 13.58% | 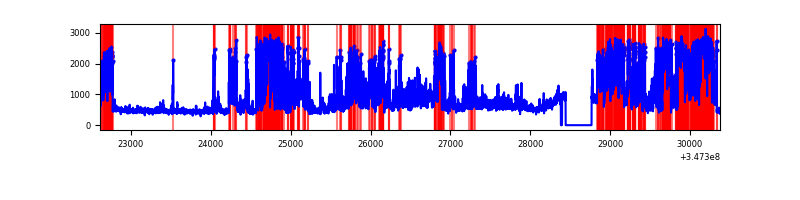 |
| C | 7763 | 7424 | 2 | 2 | 0.03% | 0.03% | 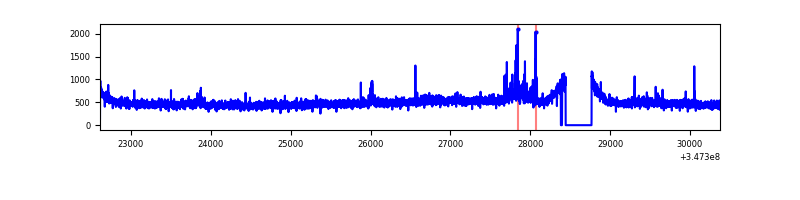 |
| D | 7762 | 7423 | 658 | 658 | 8.48% | 8.86% | 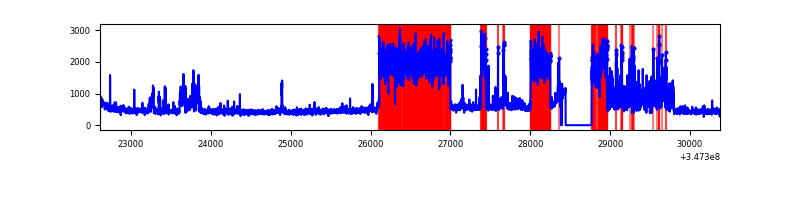 |
Top three noisy pixels from each quadrant. If the there are fewer than three noisy pixels in the level2.evt file, extra rows are filled as -1
| Pixel properties | Quadrant properties | ||||||
|---|---|---|---|---|---|---|---|
| Quadrant | DetID | PixID | Counts | Sigma | Mean | Median | Sigma |
| A | 12 | 96 | 162249 | 871.9 | 916 | 897 | 185.1 |
| A | 13 | 254 | 10988 | 54.53 | 916 | 897 | 185.1 |
| A | 3 | 137 | 9267 | 45.23 | 916 | 897 | 185.1 |
| B | 10 | 245 | 4072361 | 24683.88 | 842 | 822 | 164.9 |
| B | 10 | 246 | 95860 | 576.17 | 842 | 822 | 164.9 |
| B | 12 | 111 | 20901 | 121.73 | 842 | 822 | 164.9 |
| C | 14 | 238 | 139351 | 665.67 | 880 | 886 | 208.0 |
| C | 15 | 208 | 121312 | 578.95 | 880 | 886 | 208.0 |
| C | 10 | 22 | 28510 | 132.8 | 880 | 886 | 208.0 |
| D | 8 | 195 | 2070094 | 10032.35 | 864 | 841 | 206.3 |
| D | 1 | 52 | 830992 | 4024.82 | 864 | 841 | 206.3 |
| D | 2 | 234 | 24482 | 114.62 | 864 | 841 | 206.3 |
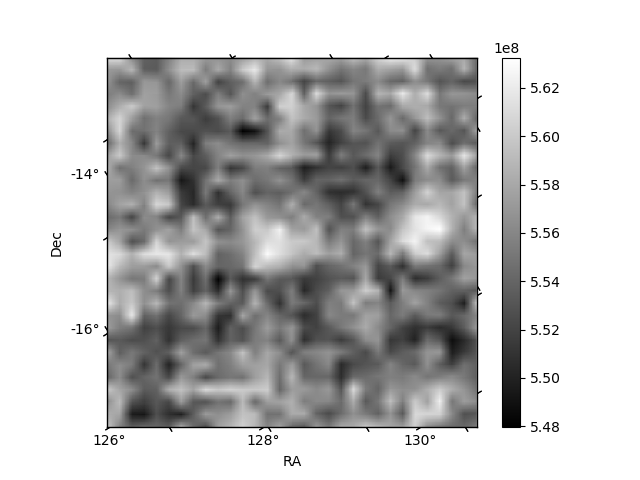
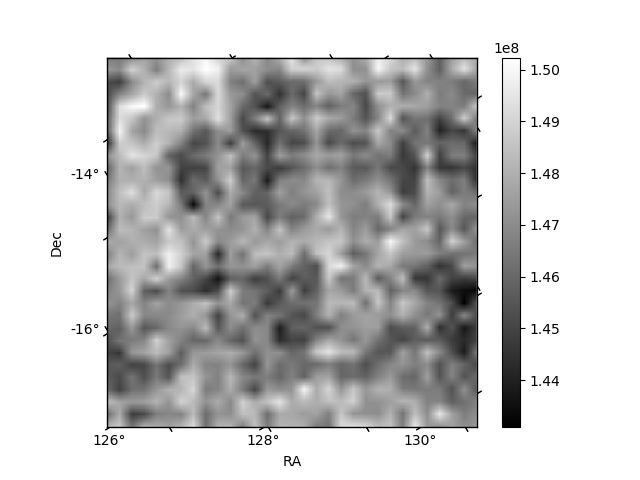
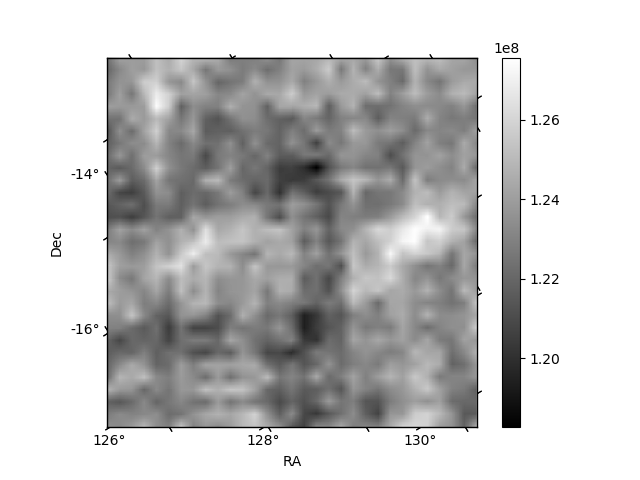
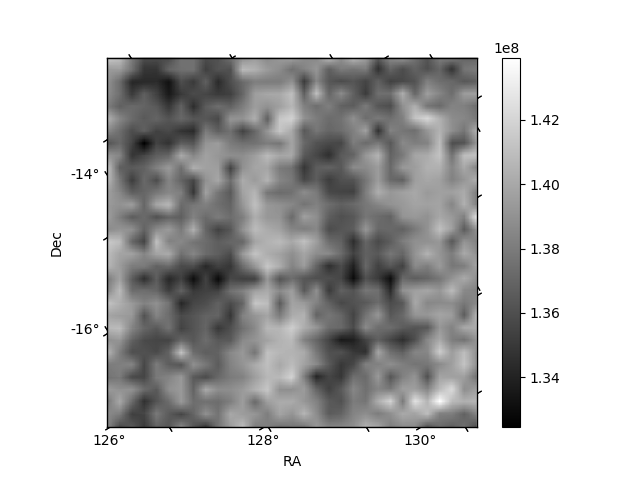
Histogram calculated using DETX and DETY for each event in the final _common_clean file
| Quadrant A |  |
 |
Quadrant B |
|---|---|---|---|
| Quadrant D |  |
 |
Quadrant C |
| Plot type | Count rate plots | Images |
|---|---|---|
| Comparison with Poisson distribution Blue bars denote a histogram of data divided into 1 sec bins. Red curve is a Poisson curve with rate = median count rate of data. |
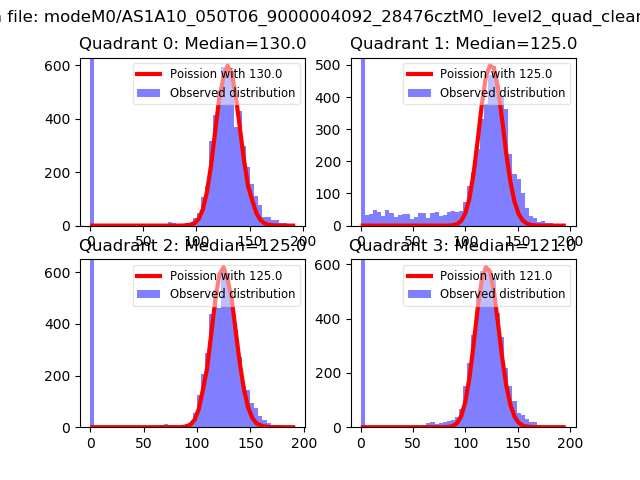 |
 |
| Quadrant-wise count rates Data is divided into 100 sec bins |
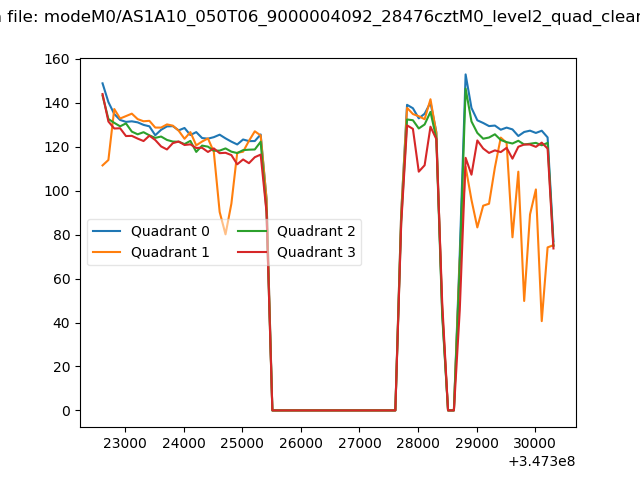 |
|
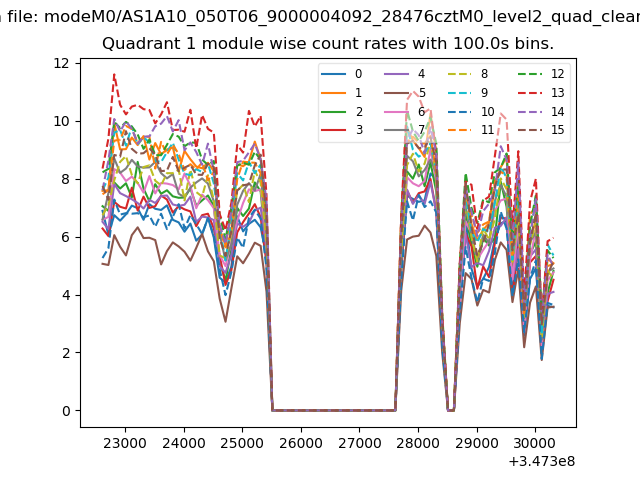
| Module-wise count rates for Quadrant A Data is divided into 100 sec bins |
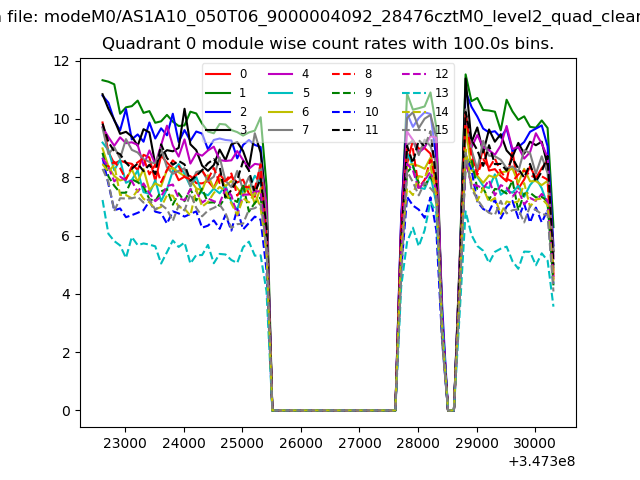 |
 |
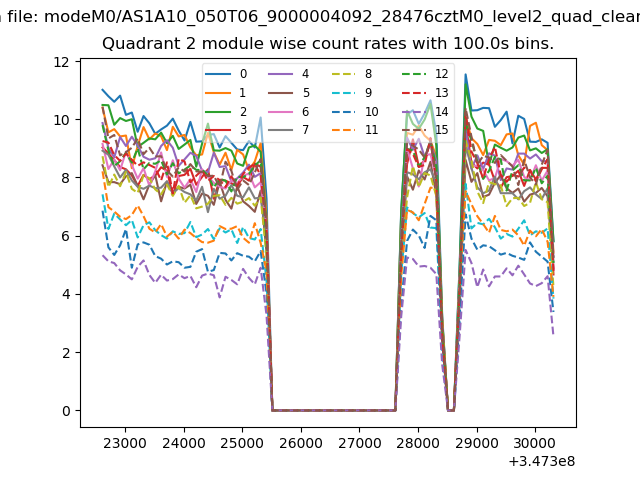
| Module-wise count rates for Quadrant B Data is divided into 100 sec bins |
 |
 |
| Module-wise count rates for Quadrant C Data is divided into 100 sec bins |
 |
 |
| Module-wise count rates for Quadrant D Data is divided into 100 sec bins |
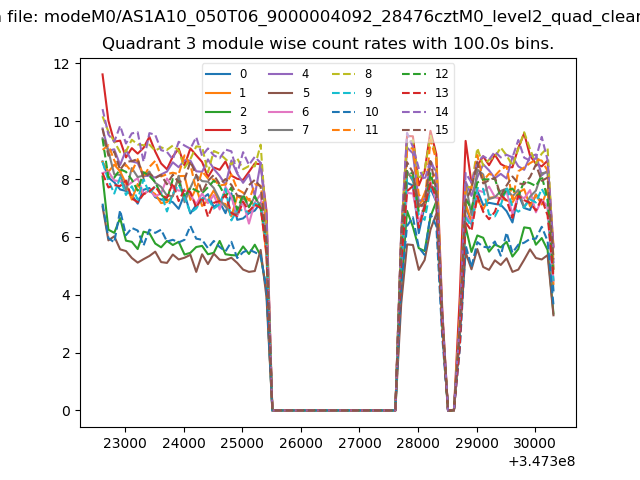 |
 |
| Parameter | Plot |
|---|---|
| CZT HV Monitor |  |
| D_VDD | 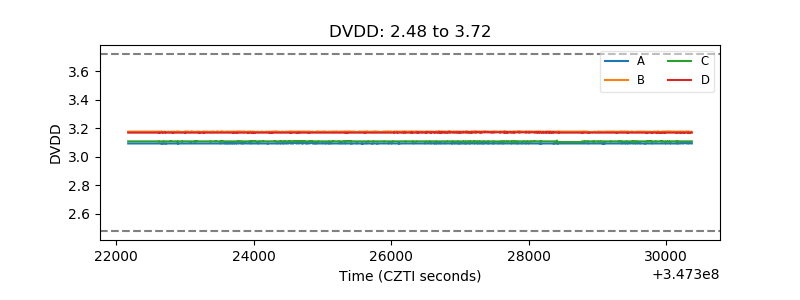 |
| Temperature 1 | 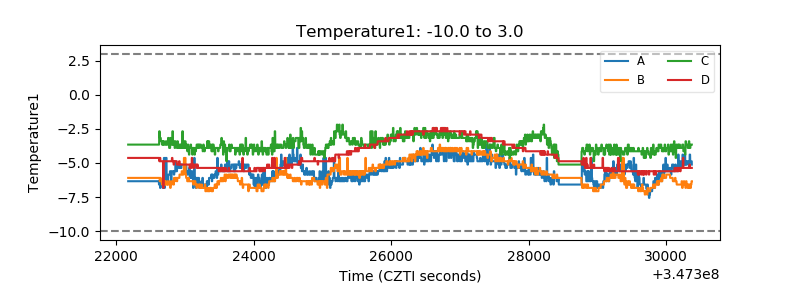 |
| Veto HV Monitor | 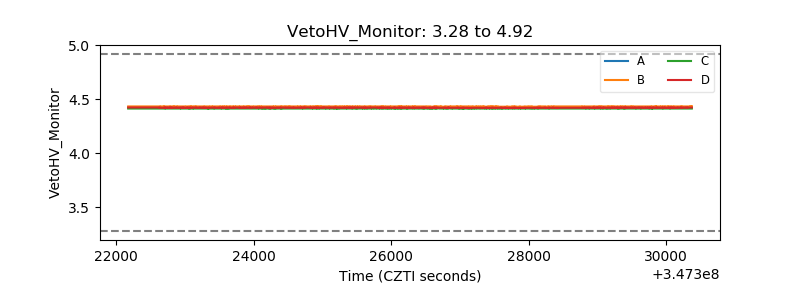 |
| Veto LLD | 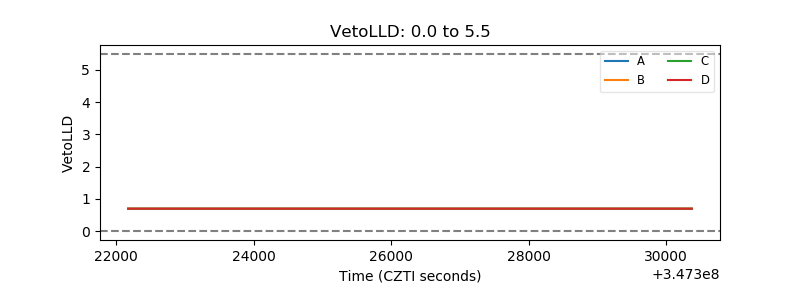 |
| Alpha Counter | 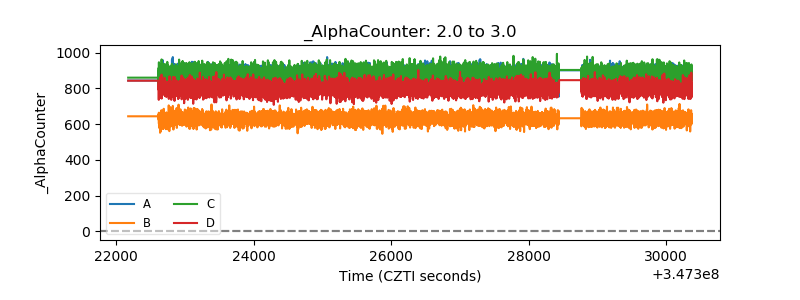 |
| _CPM_Rate | 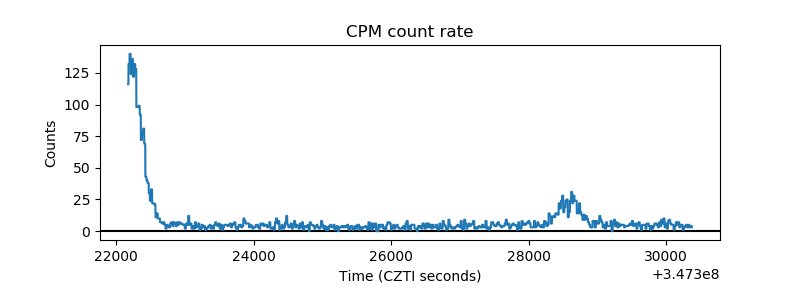 |
| CZT Counter | 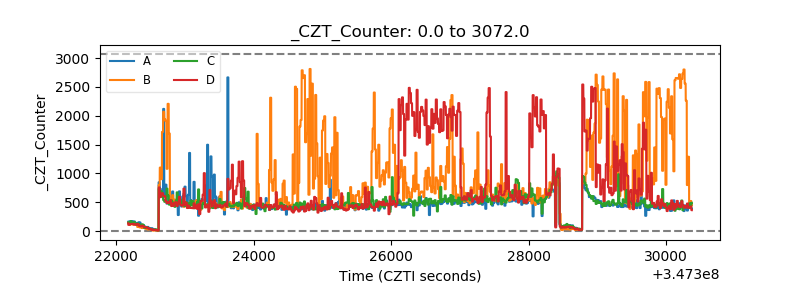 |
| +2.5 Volts monitor |  |
| +5 Volts monitor |  |
| _ROLL_ROT | 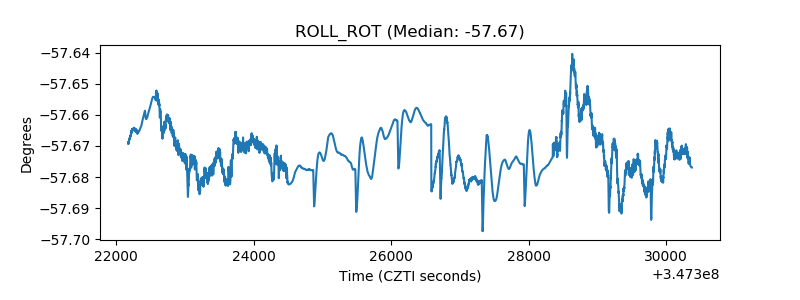 |
| _Roll_DEC | 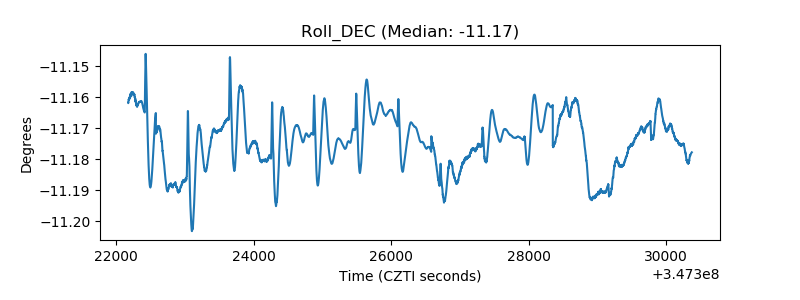 |
| _Roll_RA | 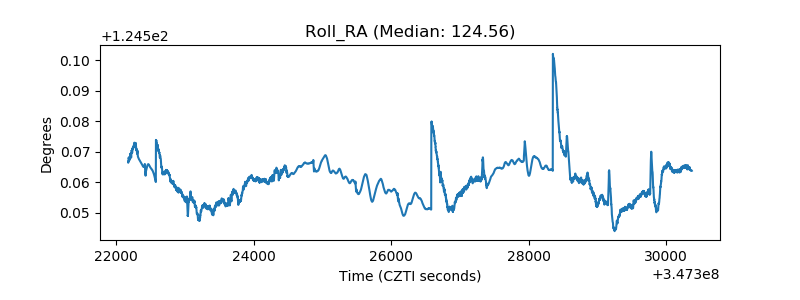 |
| Veto Counter | 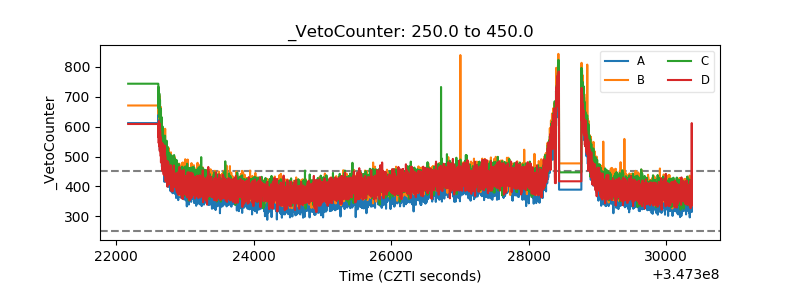 |