| Param | Original file | Final file |
|---|---|---|
| Filename | modeM0/AS1A10_050T06_9000004092_28477cztM0_level2.evt | modeM0/AS1A10_050T06_9000004092_28477cztM0_level2_quad_clean.evt |
| Size (bytes) | 695,865,600 | 109,128,960 |
| Size | 663.6 MB | 104.1 MB |
| Events in quadrant A | 3,780,460 | 728,177 |
| Events in quadrant B | 6,603,586 | 664,992 |
| Events in quadrant C | 3,934,005 | 697,717 |
| Events in quadrant D | 6,223,645 | 666,461 |
| Mode M0 | |||
|---|---|---|---|
| Quadrant | BADHDUFLAG | Total packets | Discarded packets |
| A | 0 | 16387 | 2 |
| B | 0 | 24718 | 2 |
| C | 0 | 16645 | 3 |
| D | 0 | 23742 | 2 |
| Mode SS | |||
|---|---|---|---|
| Quadrant | BADHDUFLAG | Total packets | Discarded packets |
| A | 0 | 162 | 0 |
| B | 0 | 162 | 0 |
| C | 0 | 162 | 0 |
| D | 0 | 162 | 0 |
| Mode M9 | |||
|---|---|---|---|
| Quadrant | BADHDUFLAG | Total packets | Discarded packets |
| A | 0 | 4 | 0 |
| B | 0 | 4 | 0 |
| C | 0 | 4 | 0 |
| D | 0 | 4 | 0 |
| Quadrant | Total seconds | Saturated seconds | Saturation percentage |
|---|---|---|---|
| A | 7862 | 165 | 2.098703% |
| B | 7862 | 1146 | 14.576444% |
| C | 7861 | 261 | 3.320188% |
| D | 7862 | 755 | 9.603154% |
Noise dominated data is calculated using 1-second bins in cleaned event files. If a bin has >2000 counts, and if more than 50% of those come from <1% of pixels, then it is considered to be noise-dominated and hence unusable.
| Quadrant | # 1 sec bins | Bins with >0 counts | Bins with >2000 counts | High rate bins dominated by noise | Noise dominated (total time) | Noise dominated (detector-on time) | Marked lightcurve |
|---|---|---|---|---|---|---|---|
| A | 7932 | 7862 | 0 | 0 | 0.00% | 0.00% | 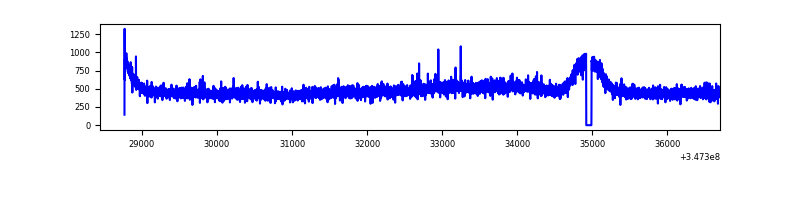 |
| B | 7932 | 7862 | 720 | 720 | 9.08% | 9.16% | 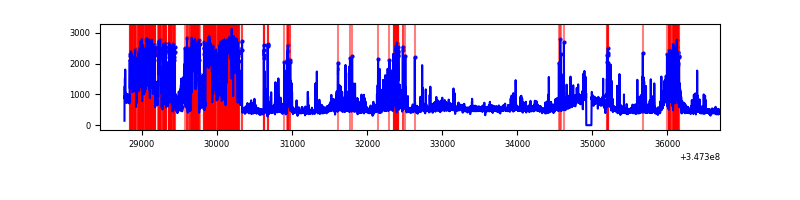 |
| C | 7931 | 7861 | 0 | 0 | 0.00% | 0.00% | 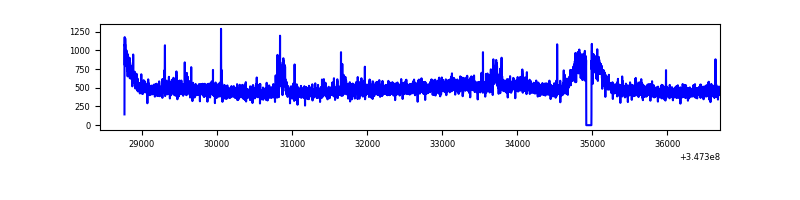 |
| D | 8257 | 7862 | 543 | 543 | 6.58% | 6.91% | 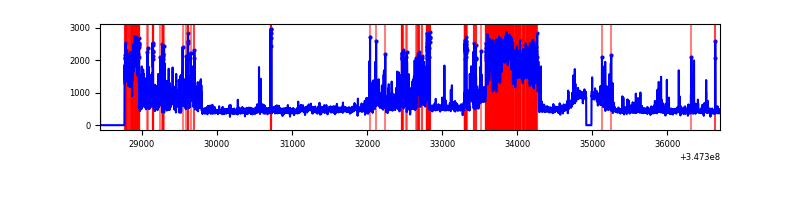 |
Top three noisy pixels from each quadrant. If the there are fewer than three noisy pixels in the level2.evt file, extra rows are filled as -1
| Pixel properties | Quadrant properties | ||||||
|---|---|---|---|---|---|---|---|
| Quadrant | DetID | PixID | Counts | Sigma | Mean | Median | Sigma |
| A | 13 | 254 | 11920 | 55.52 | 975 | 952 | 197.6 |
| A | 12 | 96 | 10515 | 48.4 | 975 | 952 | 197.6 |
| A | 3 | 137 | 10183 | 46.72 | 975 | 952 | 197.6 |
| B | 10 | 245 | 2993470 | 16872.79 | 910 | 884 | 177.4 |
| B | 12 | 111 | 22985 | 124.61 | 910 | 884 | 177.4 |
| B | 10 | 246 | 22692 | 122.96 | 910 | 884 | 177.4 |
| C | 14 | 238 | 147296 | 655.88 | 938 | 943 | 223.1 |
| C | 15 | 208 | 59813 | 263.83 | 938 | 943 | 223.1 |
| C | 3 | 233 | 42041 | 184.18 | 938 | 943 | 223.1 |
| D | 1 | 52 | 1412455 | 6322.74 | 926 | 901 | 223.3 |
| D | 8 | 195 | 1222815 | 5473.29 | 926 | 901 | 223.3 |
| D | 13 | 104 | 33970 | 148.13 | 926 | 901 | 223.3 |
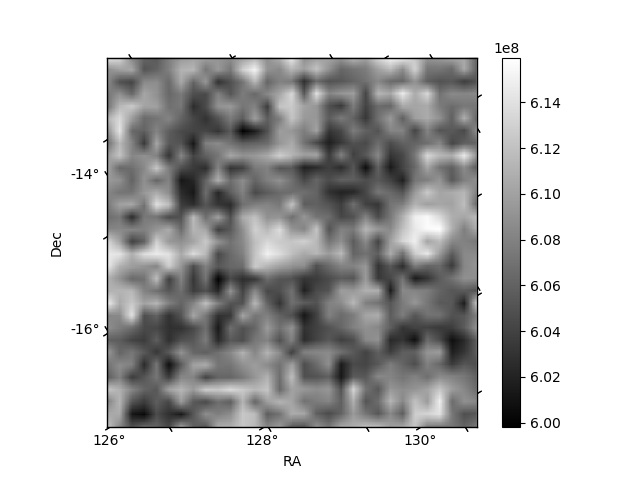
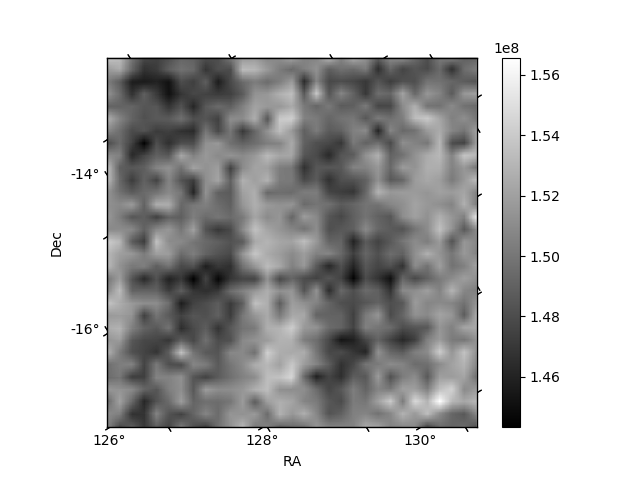
Histogram calculated using DETX and DETY for each event in the final _common_clean file
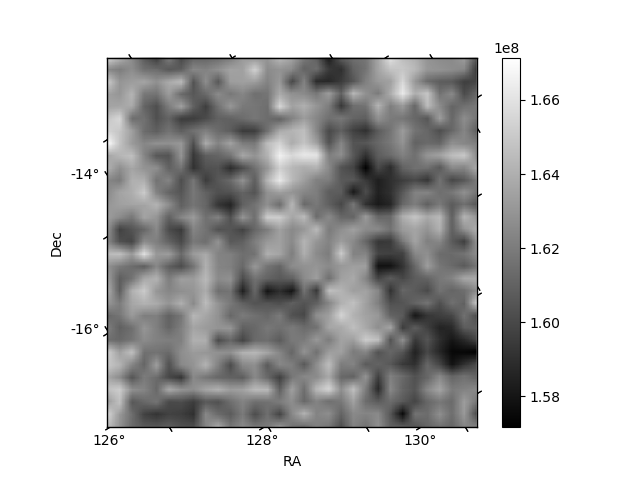
| Quadrant A |  |
 |
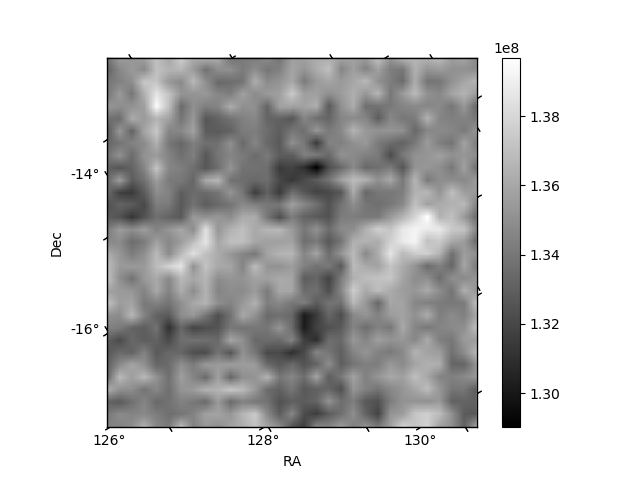
Quadrant B |
|---|---|---|---|
| Quadrant D |  |
 |
Quadrant C |
| Plot type | Count rate plots | Images |
|---|---|---|
| Comparison with Poisson distribution Blue bars denote a histogram of data divided into 1 sec bins. Red curve is a Poisson curve with rate = median count rate of data. |
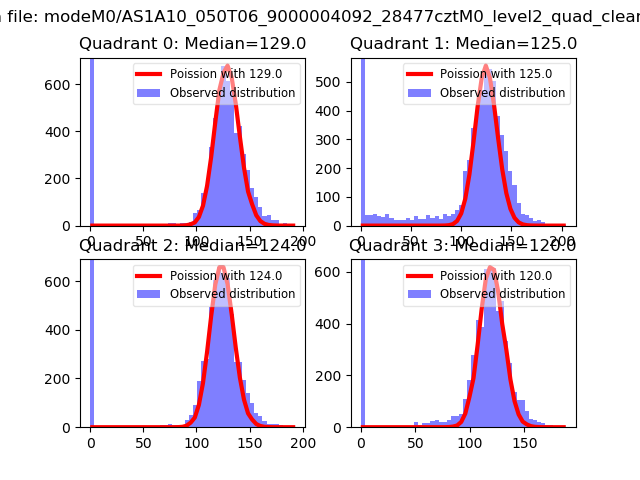 |
 |
| Quadrant-wise count rates Data is divided into 100 sec bins |
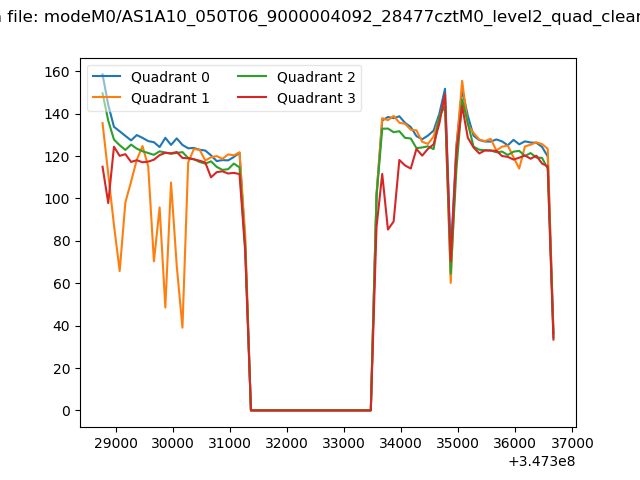 |
|
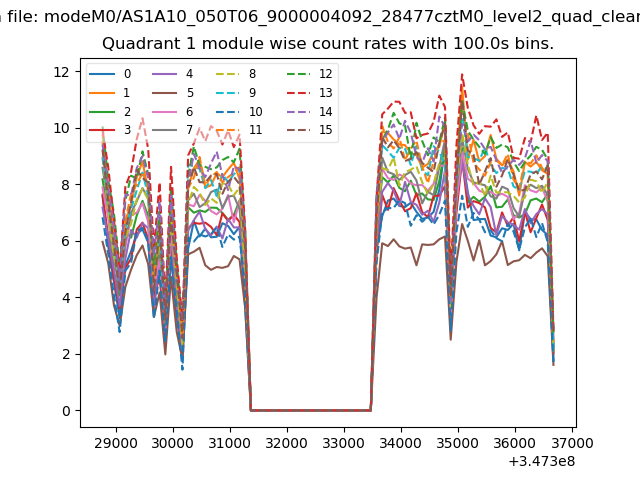
| Module-wise count rates for Quadrant A Data is divided into 100 sec bins |
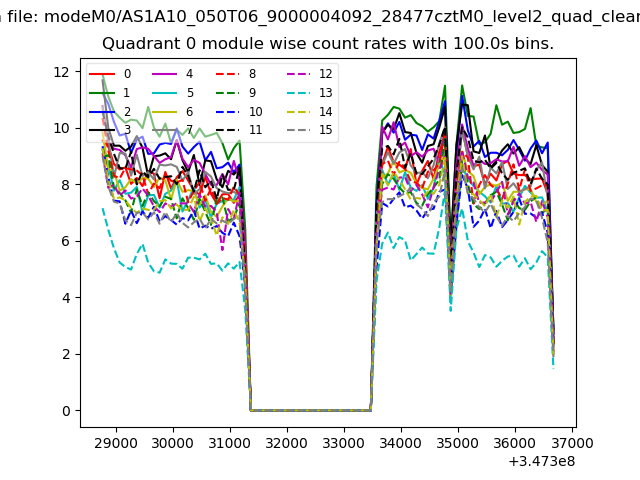 |
 |
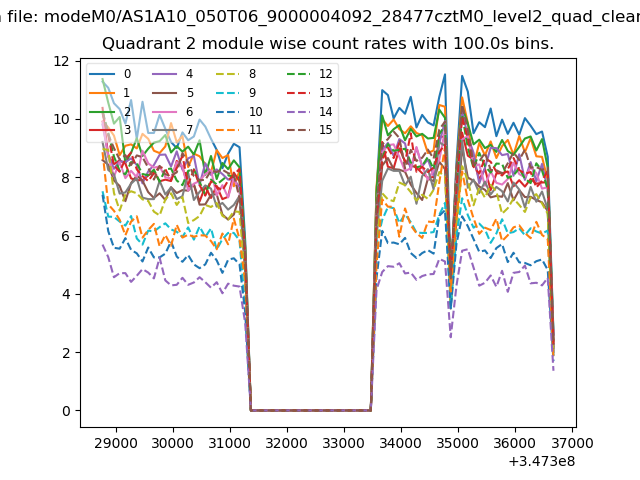
| Module-wise count rates for Quadrant B Data is divided into 100 sec bins |
 |
 |
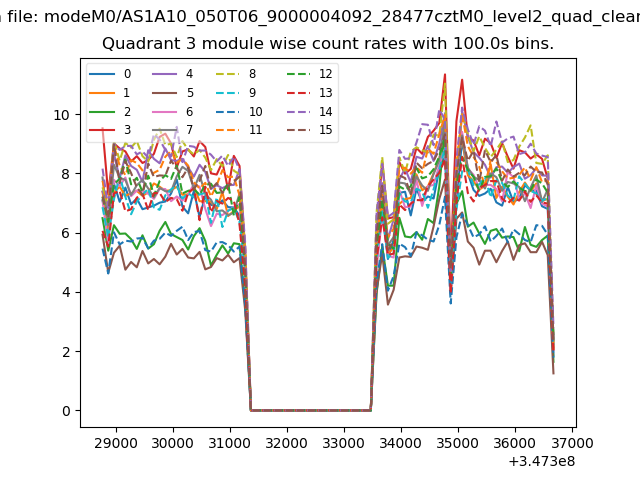
| Module-wise count rates for Quadrant C Data is divided into 100 sec bins |
 |
 |
| Module-wise count rates for Quadrant D Data is divided into 100 sec bins |
 |
 |
| Parameter | Plot |
|---|---|
| CZT HV Monitor | 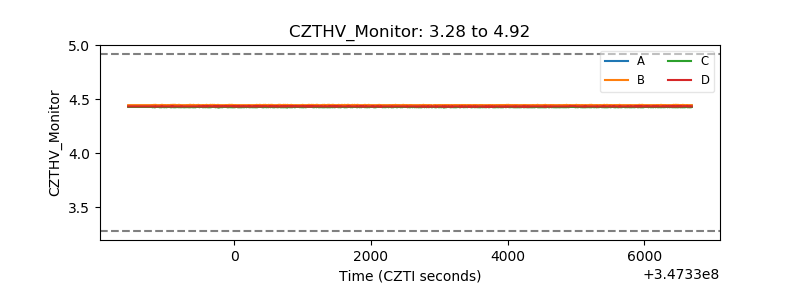 |
| D_VDD | 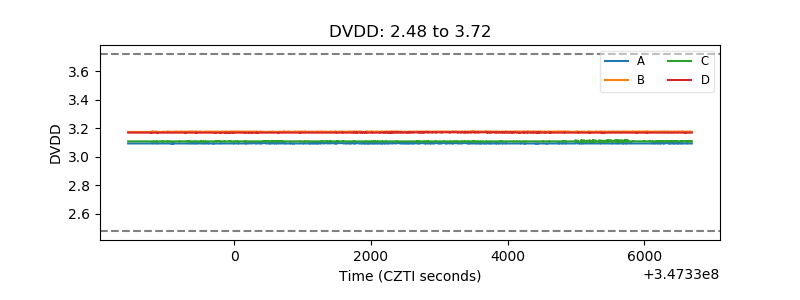 |
| Temperature 1 | 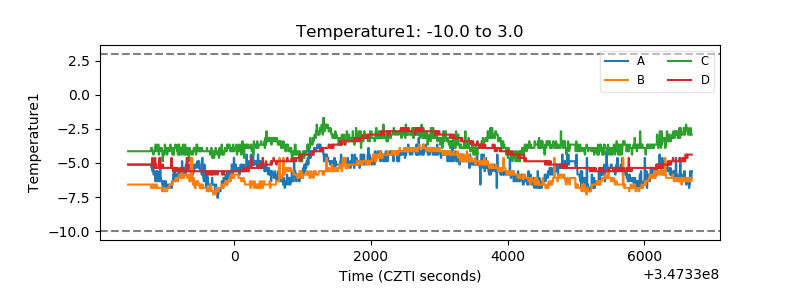 |
| Veto HV Monitor | 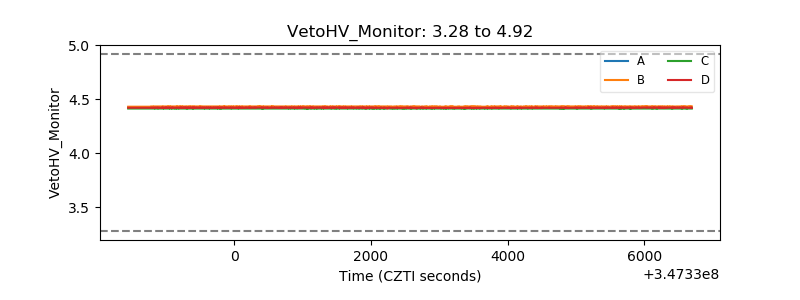 |
| Veto LLD | 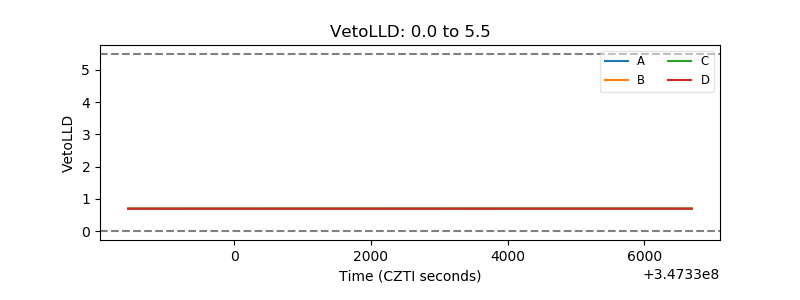 |
| Alpha Counter | 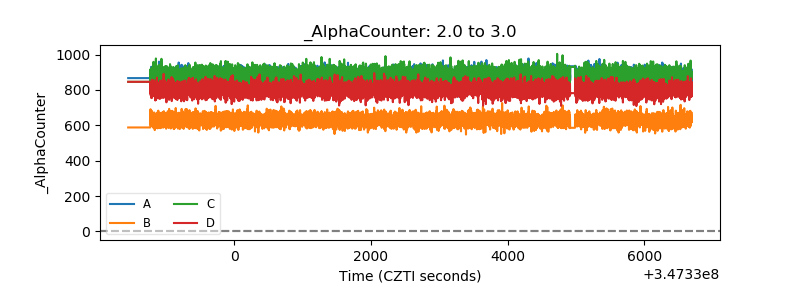 |
| _CPM_Rate | 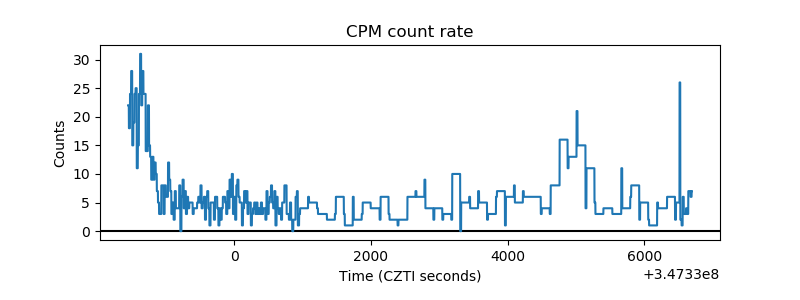 |
| CZT Counter | 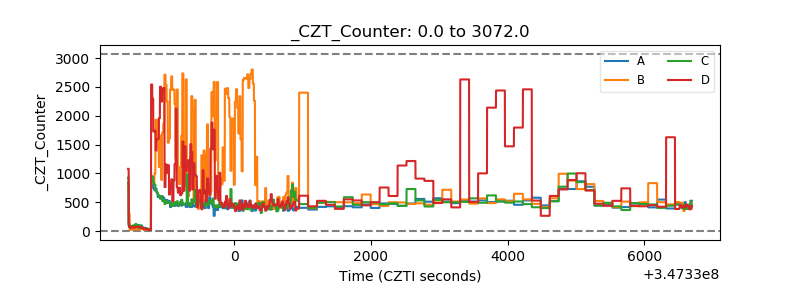 |
| +2.5 Volts monitor |  |
| +5 Volts monitor | 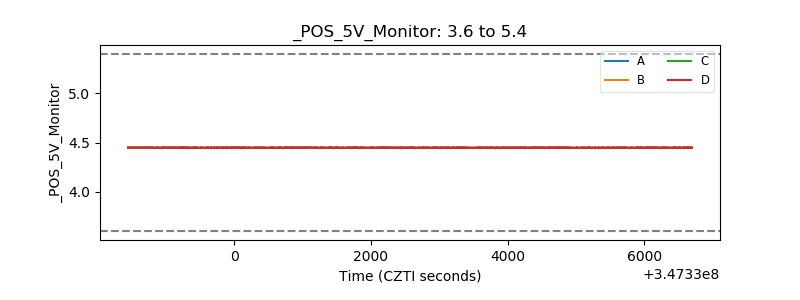 |
| _ROLL_ROT | 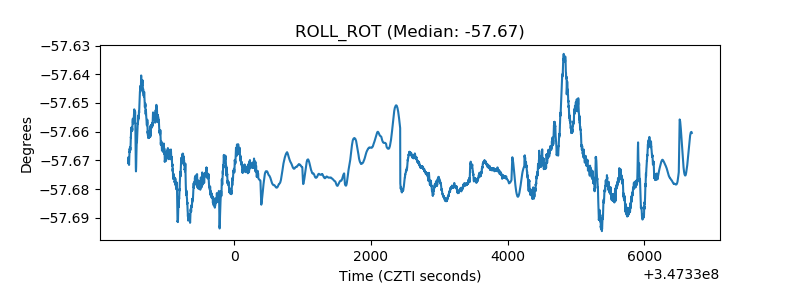 |
| _Roll_DEC | 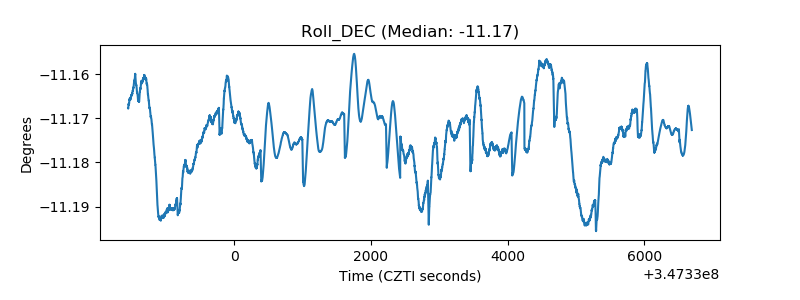 |
| _Roll_RA | 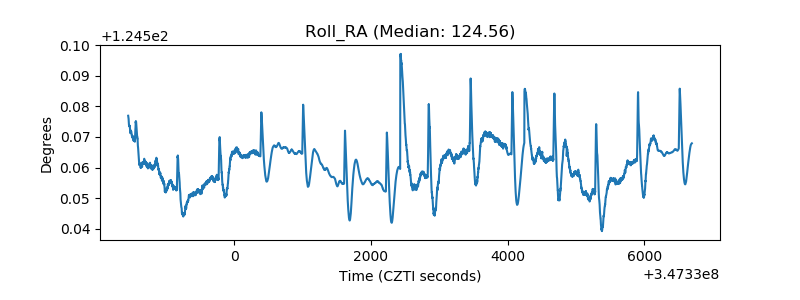 |
| Veto Counter | 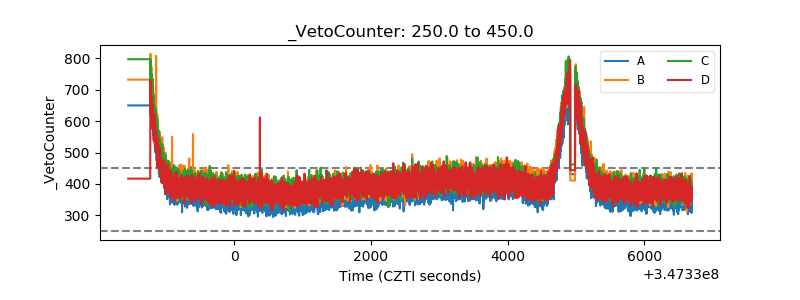 |