| Param | Original file | Final file |
|---|---|---|
| Filename | modeM0/AS1A10_050T06_9000004092_28478cztM0_level2.evt | modeM0/AS1A10_050T06_9000004092_28478cztM0_level2_quad_clean.evt |
| Size (bytes) | 681,042,240 | 108,570,240 |
| Size | 649.5 MB | 103.5 MB |
| Events in quadrant A | 3,746,120 | 715,624 |
| Events in quadrant B | 6,817,068 | 676,277 |
| Events in quadrant C | 3,824,128 | 685,411 |
| Events in quadrant D | 5,708,276 | 666,381 |
| Mode M0 | |||
|---|---|---|---|
| Quadrant | BADHDUFLAG | Total packets | Discarded packets |
| A | 0 | 16204 | 2 |
| B | 0 | 25526 | 2 |
| C | 0 | 16281 | 2 |
| D | 0 | 22176 | 2 |
| Mode SS | |||
|---|---|---|---|
| Quadrant | BADHDUFLAG | Total packets | Discarded packets |
| A | 0 | 158 | 0 |
| B | 0 | 158 | 0 |
| C | 0 | 158 | 0 |
| D | 0 | 158 | 0 |
| Mode M9 | |||
|---|---|---|---|
| Quadrant | BADHDUFLAG | Total packets | Discarded packets |
| A | 0 | 5 | 0 |
| B | 0 | 5 | 0 |
| C | 0 | 5 | 0 |
| D | 0 | 5 | 0 |
| Quadrant | Total seconds | Saturated seconds | Saturation percentage |
|---|---|---|---|
| A | 7826 | 179 | 2.287248% |
| B | 7827 | 1246 | 15.919254% |
| C | 7827 | 295 | 3.769005% |
| D | 7827 | 444 | 5.672672% |
Noise dominated data is calculated using 1-second bins in cleaned event files. If a bin has >2000 counts, and if more than 50% of those come from <1% of pixels, then it is considered to be noise-dominated and hence unusable.
| Quadrant | # 1 sec bins | Bins with >0 counts | Bins with >2000 counts | High rate bins dominated by noise | Noise dominated (total time) | Noise dominated (detector-on time) | Marked lightcurve |
|---|---|---|---|---|---|---|---|
| A | 8231 | 7826 | 0 | 0 | 0.00% | 0.00% | 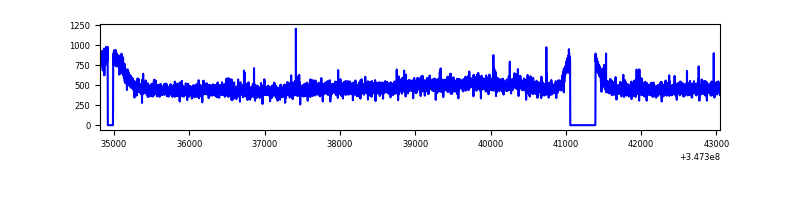 |
| B | 8232 | 7827 | 767 | 767 | 9.32% | 9.80% | 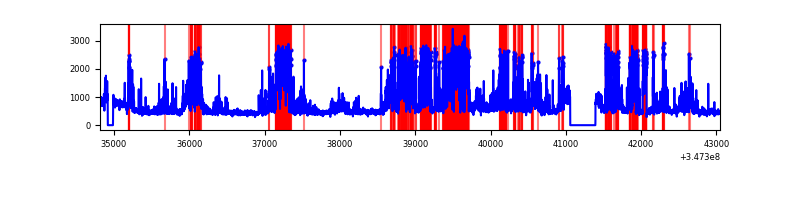 |
| C | 8232 | 7827 | 0 | 0 | 0.00% | 0.00% |  |
| D | 8232 | 7827 | 322 | 322 | 3.91% | 4.11% | 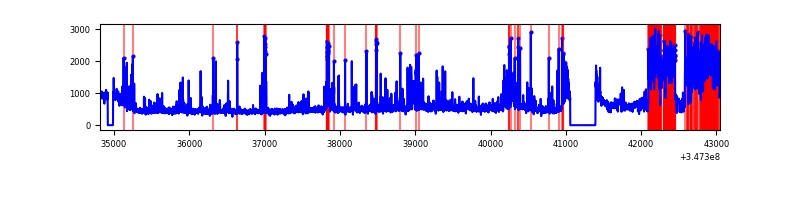 |
Top three noisy pixels from each quadrant. If the there are fewer than three noisy pixels in the level2.evt file, extra rows are filled as -1
| Pixel properties | Quadrant properties | ||||||
|---|---|---|---|---|---|---|---|
| Quadrant | DetID | PixID | Counts | Sigma | Mean | Median | Sigma |
| A | 15 | 174 | 24016 | 118.82 | 963 | 941 | 194.2 |
| A | 13 | 254 | 11325 | 53.47 | 963 | 941 | 194.2 |
| A | 3 | 137 | 10027 | 46.79 | 963 | 941 | 194.2 |
| B | 10 | 245 | 3047694 | 17408.18 | 902 | 878 | 175.0 |
| B | 10 | 246 | 221656 | 1261.43 | 902 | 878 | 175.0 |
| B | 12 | 111 | 22873 | 125.67 | 902 | 878 | 175.0 |
| C | 14 | 238 | 145428 | 658.77 | 927 | 927 | 219.3 |
| C | 7 | 247 | 33471 | 148.37 | 927 | 927 | 219.3 |
| C | 3 | 233 | 23161 | 101.36 | 927 | 927 | 219.3 |
| D | 8 | 195 | 1130388 | 5097.88 | 929 | 903 | 221.6 |
| D | 1 | 52 | 1010007 | 4554.54 | 929 | 903 | 221.6 |
| D | 2 | 234 | 29155 | 127.51 | 929 | 903 | 221.6 |
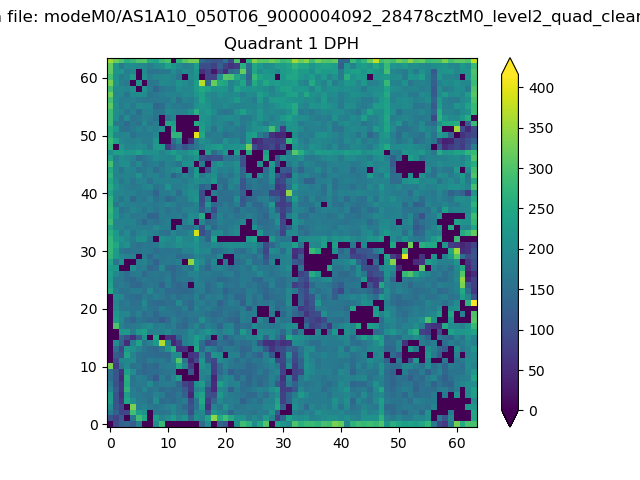
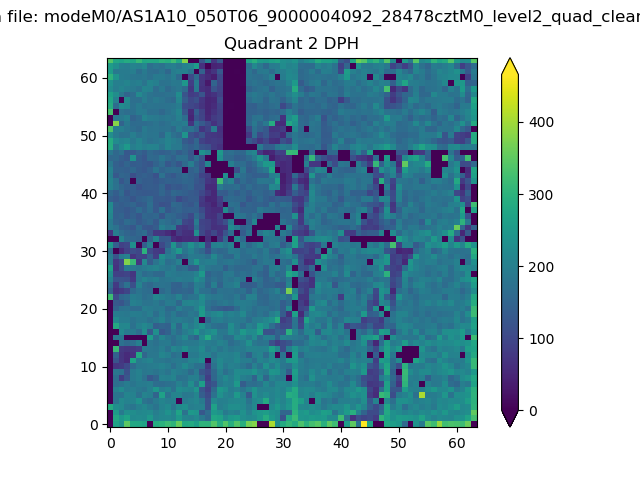
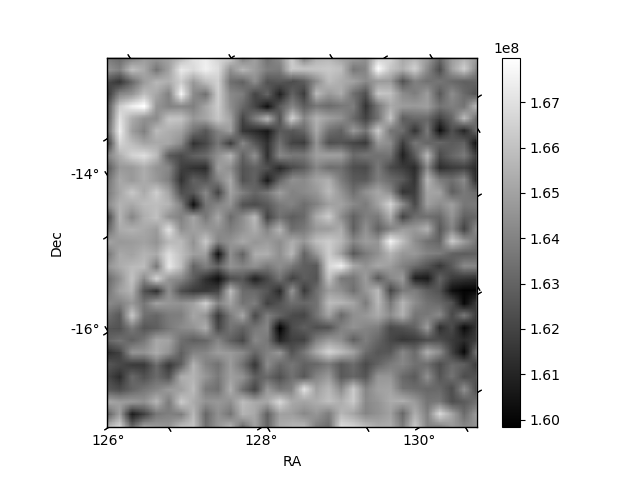
Histogram calculated using DETX and DETY for each event in the final _common_clean file
| Quadrant A |  |
 |
Quadrant B |
|---|---|---|---|
| Quadrant D | 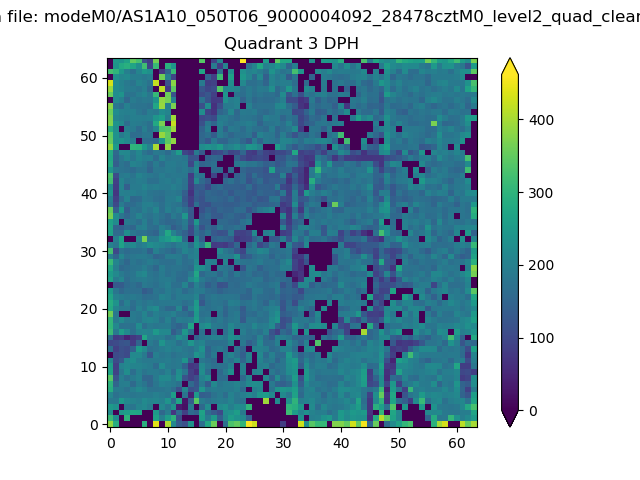 |
 |
Quadrant C |
| Plot type | Count rate plots | Images |
|---|---|---|
| Comparison with Poisson distribution Blue bars denote a histogram of data divided into 1 sec bins. Red curve is a Poisson curve with rate = median count rate of data. |
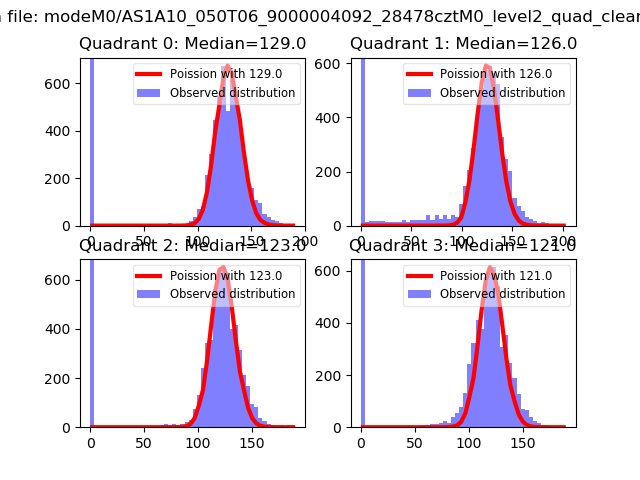 |
 |
| Quadrant-wise count rates Data is divided into 100 sec bins |
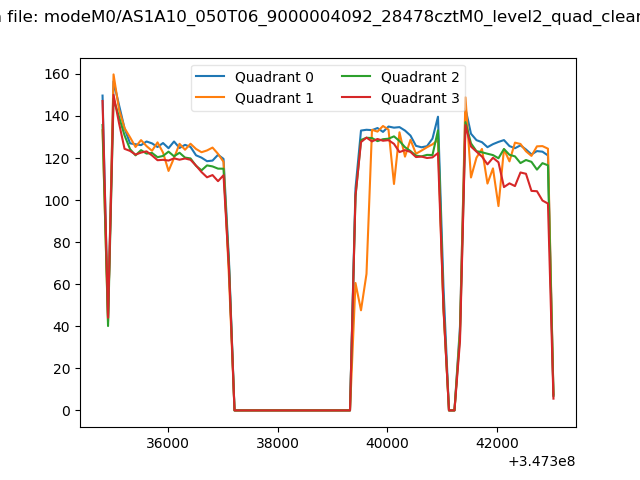 |
|
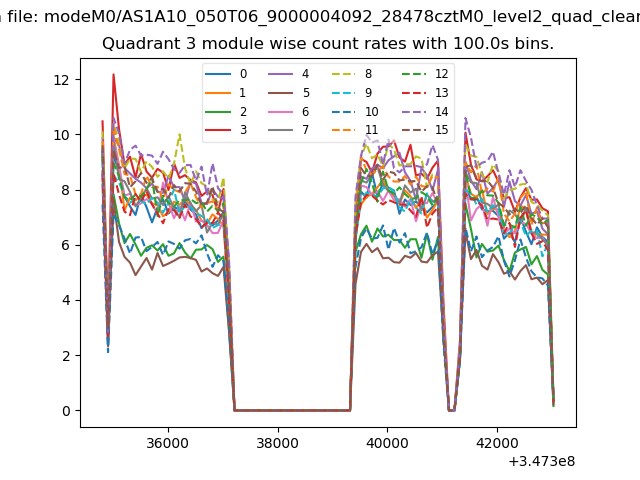
| Module-wise count rates for Quadrant A Data is divided into 100 sec bins |
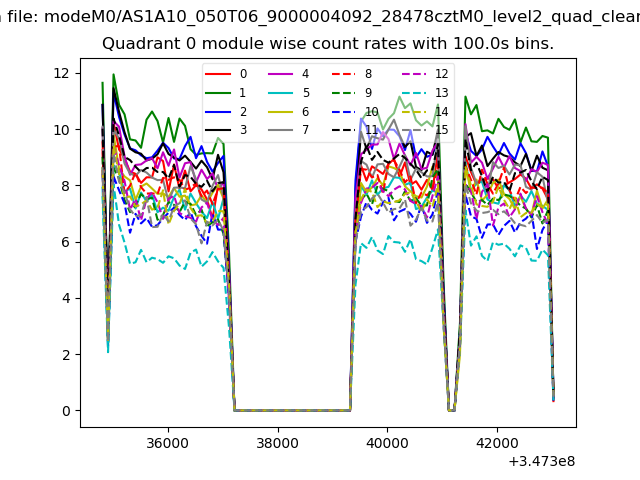 |
 |
| Module-wise count rates for Quadrant B Data is divided into 100 sec bins |
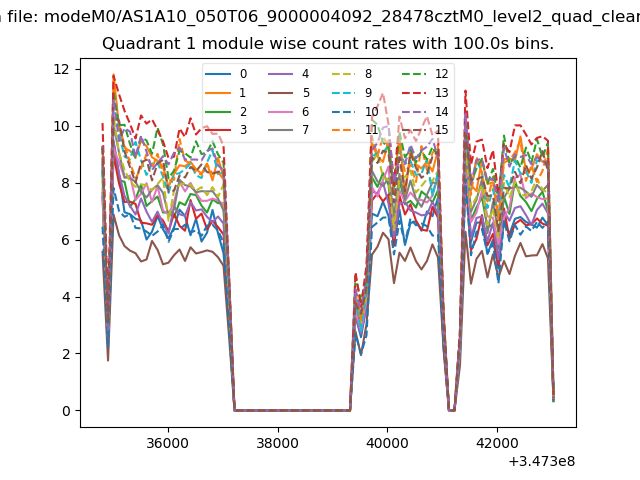 |
 |
| Module-wise count rates for Quadrant C Data is divided into 100 sec bins |
 |
 |
| Module-wise count rates for Quadrant D Data is divided into 100 sec bins |
 |
 |
| Parameter | Plot |
|---|---|
| CZT HV Monitor | 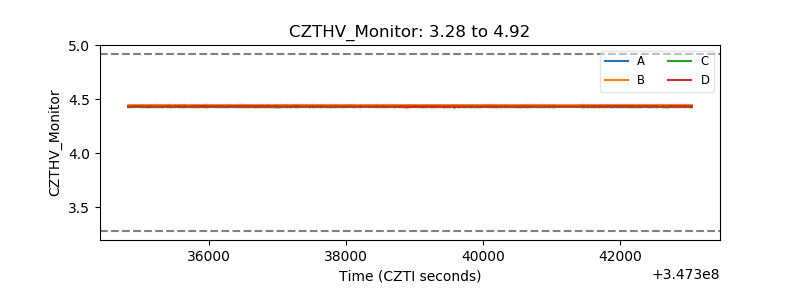 |
| D_VDD | 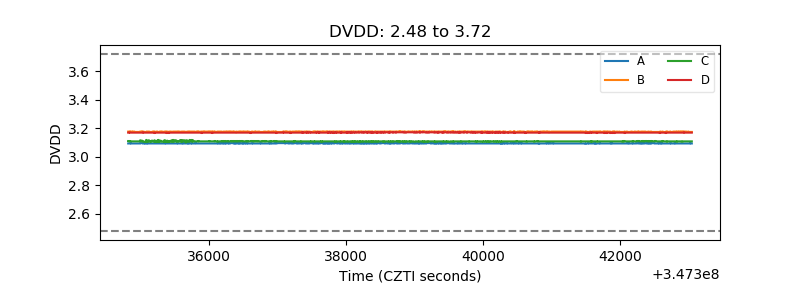 |
| Temperature 1 | 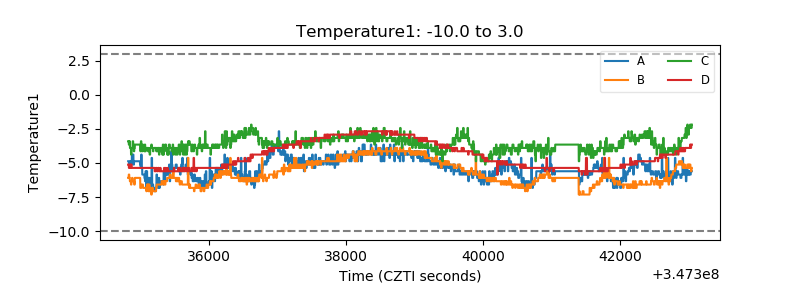 |
| Veto HV Monitor | 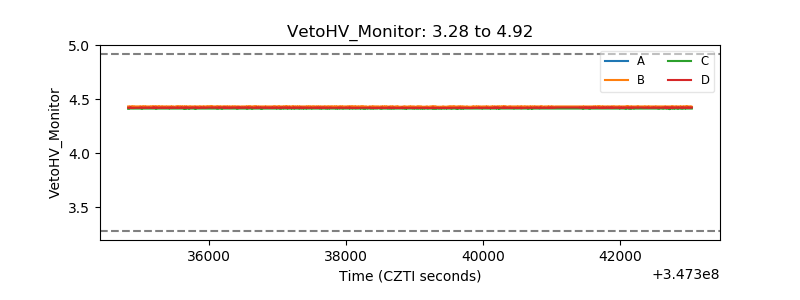 |
| Veto LLD | 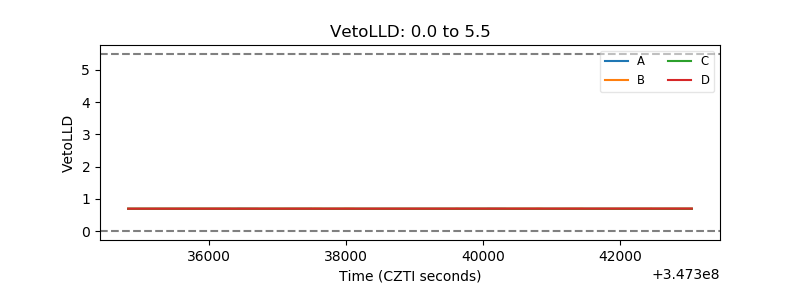 |
| Alpha Counter | 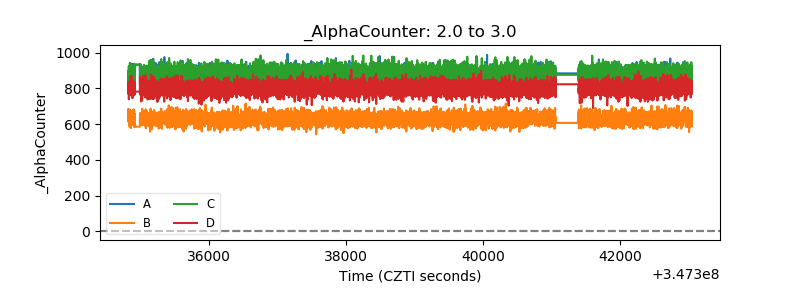 |
| _CPM_Rate | 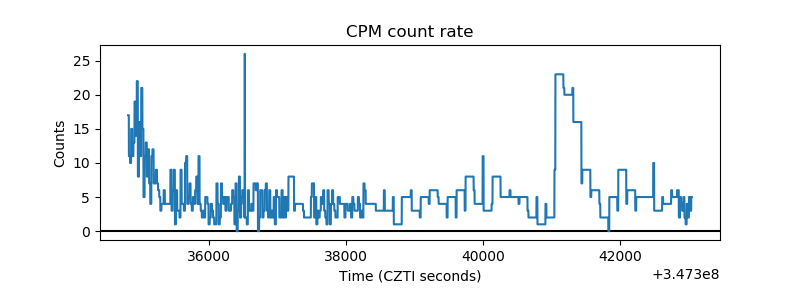 |
| CZT Counter | 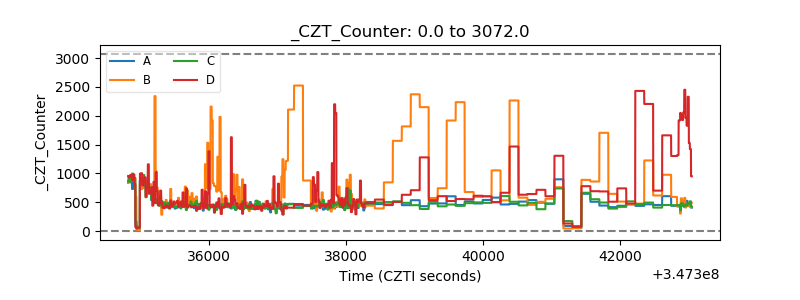 |
| +2.5 Volts monitor |  |
| +5 Volts monitor | 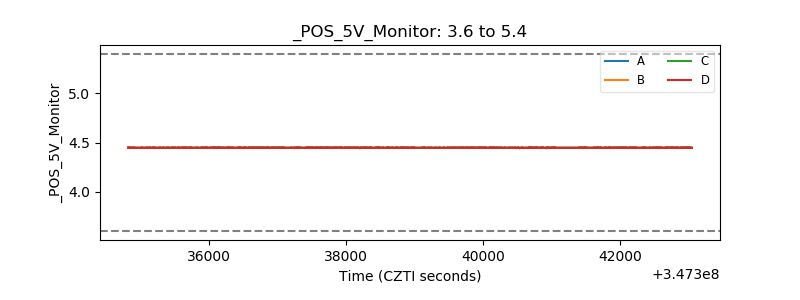 |
| _ROLL_ROT | 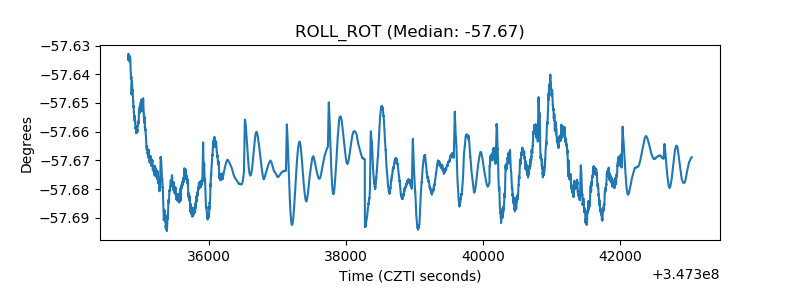 |
| _Roll_DEC | 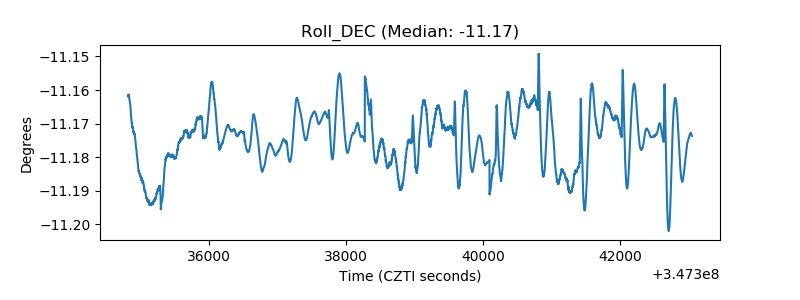 |
| _Roll_RA | 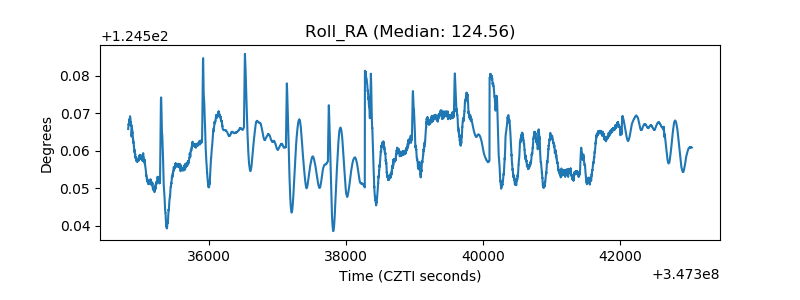 |
| Veto Counter | 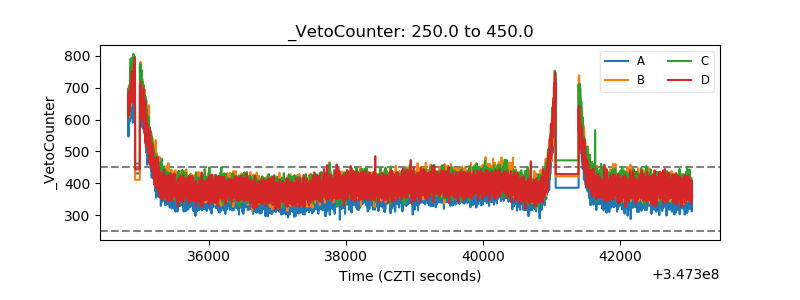 |