| Param | Original file | Final file |
|---|---|---|
| Filename | modeM0/AS1A10_050T06_9000004092_28480cztM0_level2.evt | modeM0/AS1A10_050T06_9000004092_28480cztM0_level2_quad_clean.evt |
| Size (bytes) | 985,536,000 | 141,505,920 |
| Size | 939.9 MB | 135.0 MB |
| Events in quadrant A | 5,761,534 | 883,741 |
| Events in quadrant B | 8,055,432 | 878,730 |
| Events in quadrant C | 6,090,555 | 848,197 |
| Events in quadrant D | 9,110,870 | 826,663 |
| Mode M0 | |||
|---|---|---|---|
| Quadrant | BADHDUFLAG | Total packets | Discarded packets |
| A | 0 | 24943 | 2 |
| B | 0 | 31832 | 3 |
| C | 0 | 25585 | 2 |
| D | 0 | 34974 | 2 |
| Mode SS | |||
|---|---|---|---|
| Quadrant | BADHDUFLAG | Total packets | Discarded packets |
| A | 0 | 248 | 0 |
| B | 0 | 250 | 0 |
| C | 0 | 250 | 0 |
| D | 0 | 250 | 0 |
| Mode M9 | |||
|---|---|---|---|
| Quadrant | BADHDUFLAG | Total packets | Discarded packets |
| A | 0 | 12 | 0 |
| B | 0 | 12 | 0 |
| C | 0 | 12 | 0 |
| D | 0 | 12 | 0 |
| Quadrant | Total seconds | Saturated seconds | Saturation percentage |
|---|---|---|---|
| A | 12263 | 120 | 0.978553% |
| B | 12263 | 852 | 6.947729% |
| C | 12263 | 195 | 1.590149% |
| D | 12263 | 434 | 3.539101% |
Noise dominated data is calculated using 1-second bins in cleaned event files. If a bin has >2000 counts, and if more than 50% of those come from <1% of pixels, then it is considered to be noise-dominated and hence unusable.
| Quadrant | # 1 sec bins | Bins with >0 counts | Bins with >2000 counts | High rate bins dominated by noise | Noise dominated (total time) | Noise dominated (detector-on time) | Marked lightcurve |
|---|---|---|---|---|---|---|---|
| A | 13453 | 12263 | 0 | 0 | 0.00% | 0.00% | 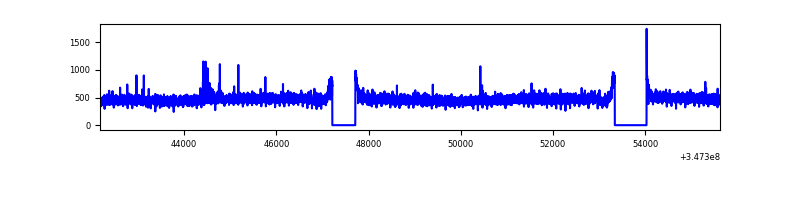 |
| B | 13453 | 12263 | 574 | 574 | 4.27% | 4.68% | 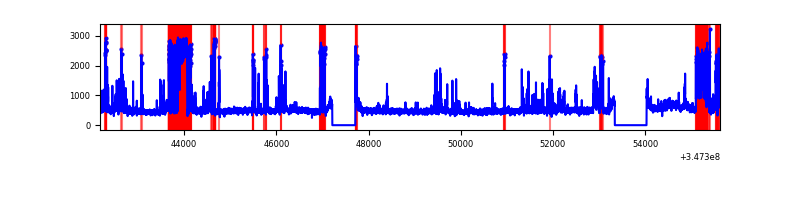 |
| C | 13453 | 12263 | 13 | 13 | 0.10% | 0.11% | 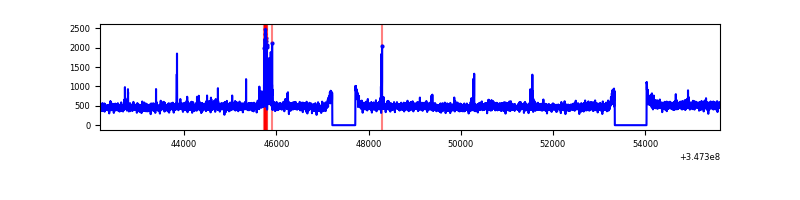 |
| D | 13453 | 12263 | 403 | 403 | 3.00% | 3.29% | 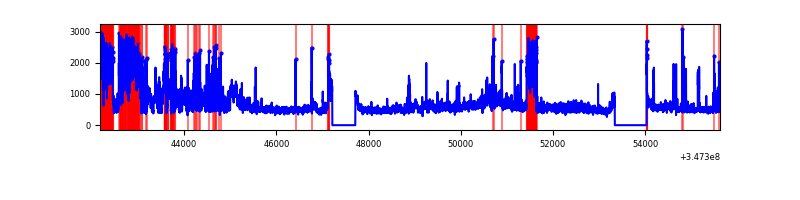 |
Top three noisy pixels from each quadrant. If the there are fewer than three noisy pixels in the level2.evt file, extra rows are filled as -1
| Pixel properties | Quadrant properties | ||||||
|---|---|---|---|---|---|---|---|
| Quadrant | DetID | PixID | Counts | Sigma | Mean | Median | Sigma |
| A | 12 | 96 | 24557 | 77.5 | 1485 | 1453 | 298.1 |
| A | 13 | 254 | 17054 | 52.33 | 1485 | 1453 | 298.1 |
| A | 3 | 137 | 15281 | 46.39 | 1485 | 1453 | 298.1 |
| B | 10 | 245 | 1409843 | 5146.76 | 1414 | 1377 | 273.7 |
| B | 10 | 246 | 1057061 | 3857.64 | 1414 | 1377 | 273.7 |
| B | 12 | 111 | 35576 | 124.97 | 1414 | 1377 | 273.7 |
| C | 14 | 238 | 224699 | 659.35 | 1431 | 1440 | 338.6 |
| C | 15 | 208 | 139954 | 409.07 | 1431 | 1440 | 338.6 |
| C | 7 | 247 | 96420 | 280.5 | 1431 | 1440 | 338.6 |
| D | 1 | 52 | 1946126 | 5699.79 | 1432 | 1394 | 341.2 |
| D | 8 | 195 | 1561749 | 4573.23 | 1432 | 1394 | 341.2 |
| D | 13 | 104 | 114209 | 330.65 | 1432 | 1394 | 341.2 |
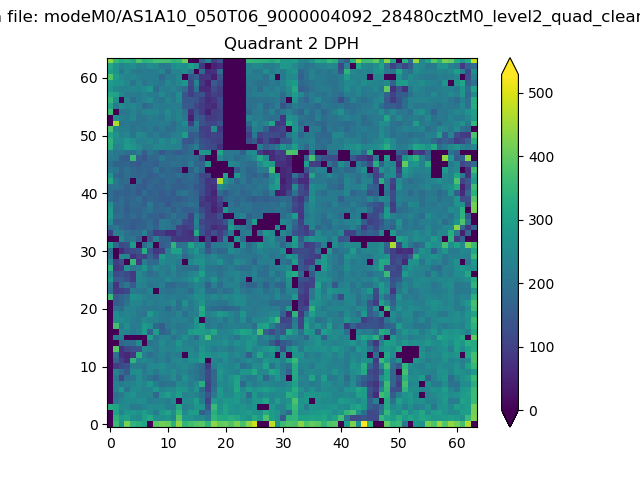
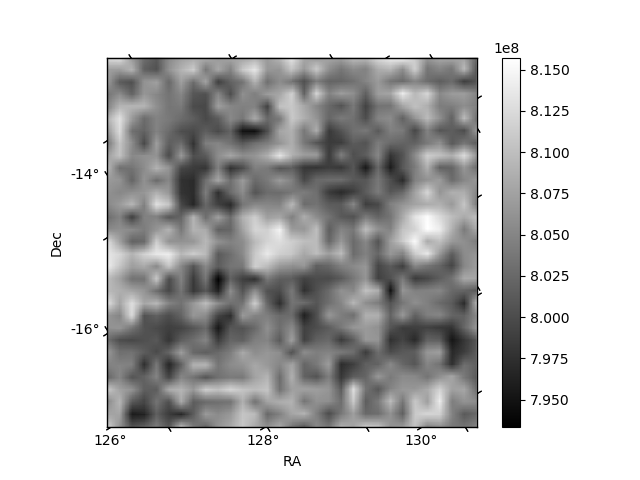
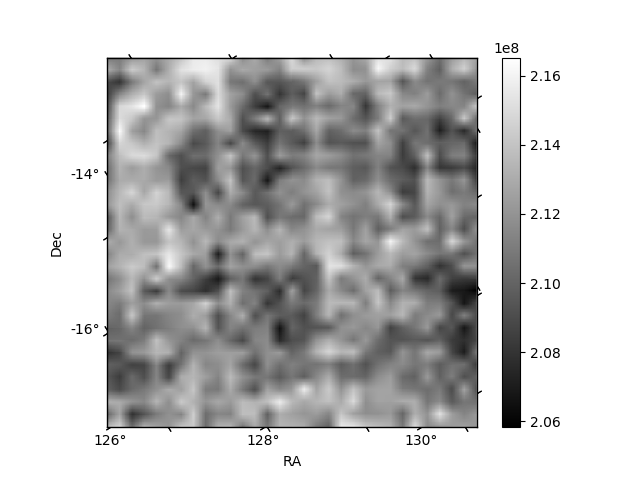
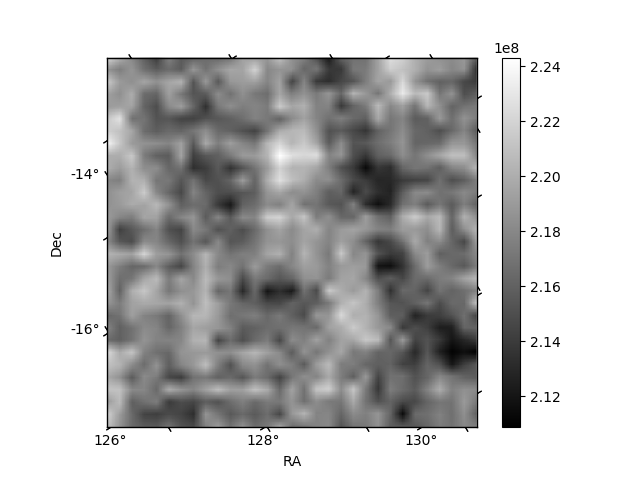
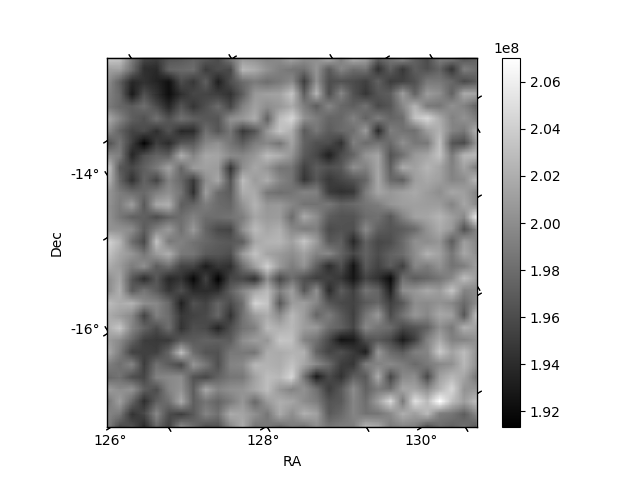
Histogram calculated using DETX and DETY for each event in the final _common_clean file
| Quadrant A | 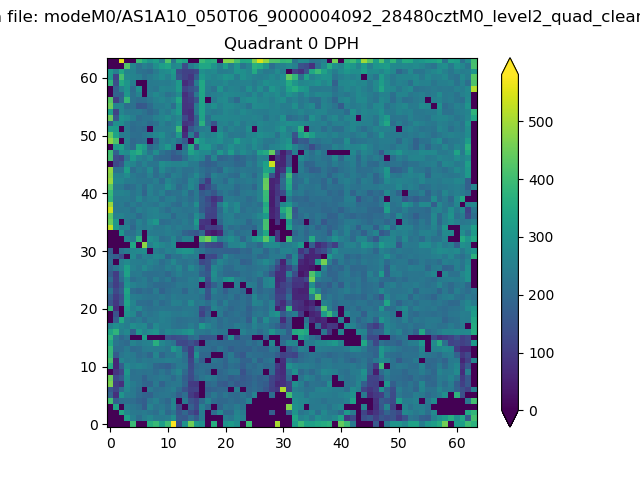 |
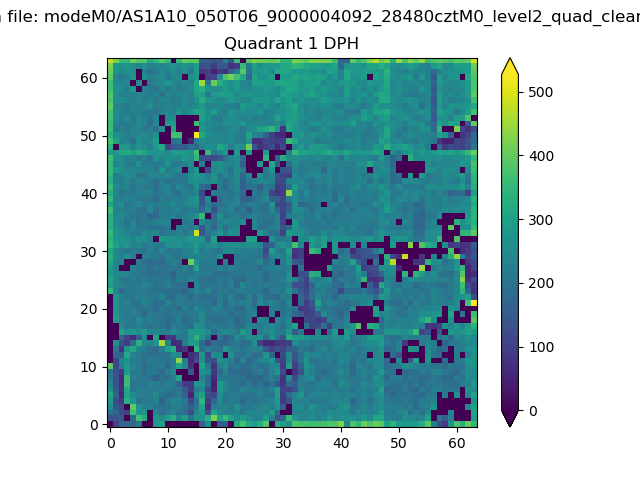 |
Quadrant B |
|---|---|---|---|
| Quadrant D | 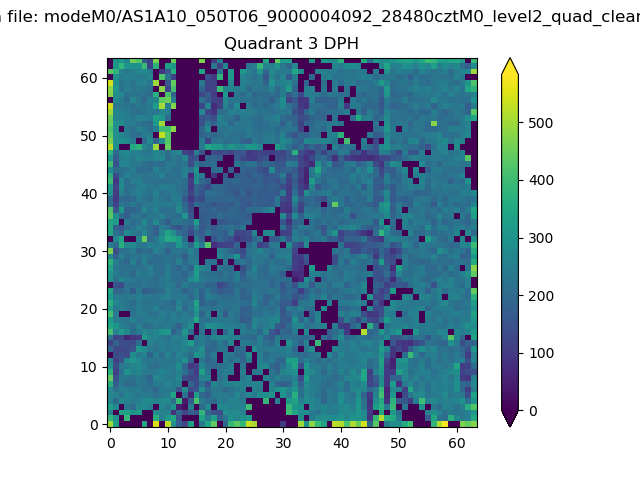 |
 |
Quadrant C |
| Plot type | Count rate plots | Images |
|---|---|---|
| Comparison with Poisson distribution Blue bars denote a histogram of data divided into 1 sec bins. Red curve is a Poisson curve with rate = median count rate of data. |
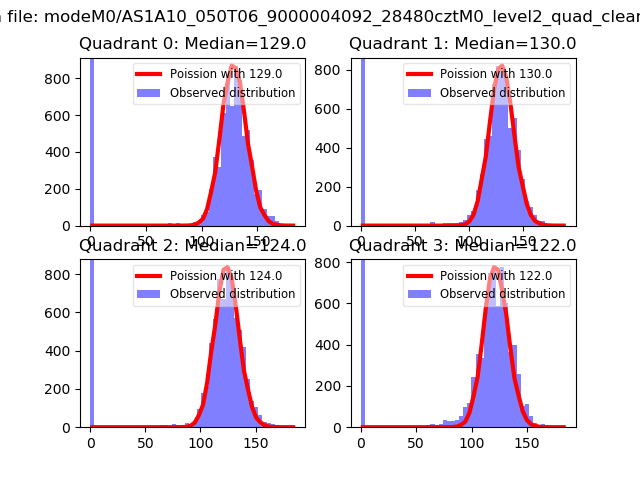 |
 |
| Quadrant-wise count rates Data is divided into 100 sec bins |
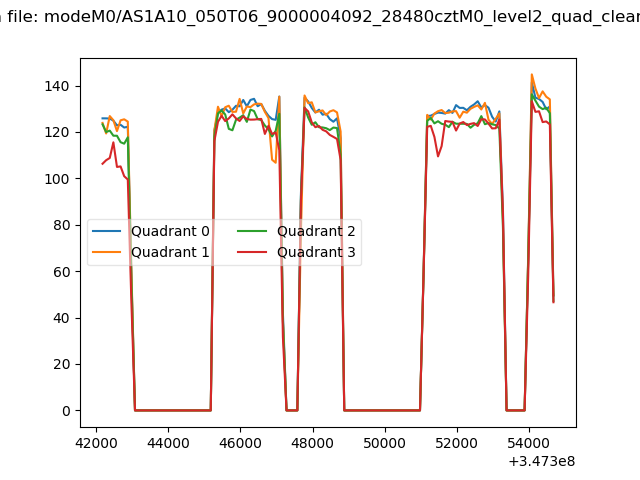 |
|
| Module-wise count rates for Quadrant A Data is divided into 100 sec bins |
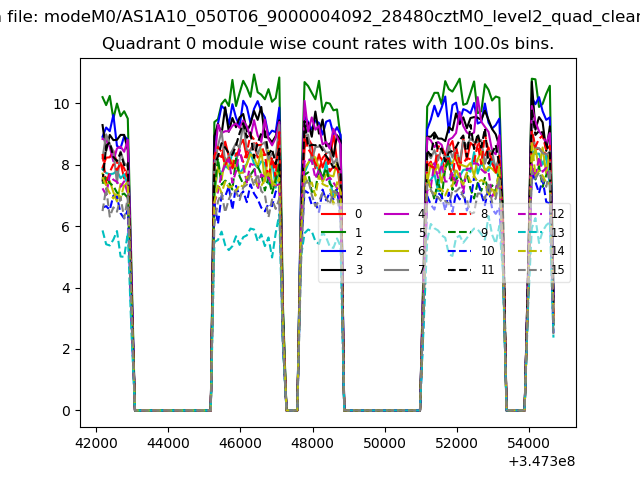 |
 |
| Module-wise count rates for Quadrant B Data is divided into 100 sec bins |
 |
 |
| Module-wise count rates for Quadrant C Data is divided into 100 sec bins |
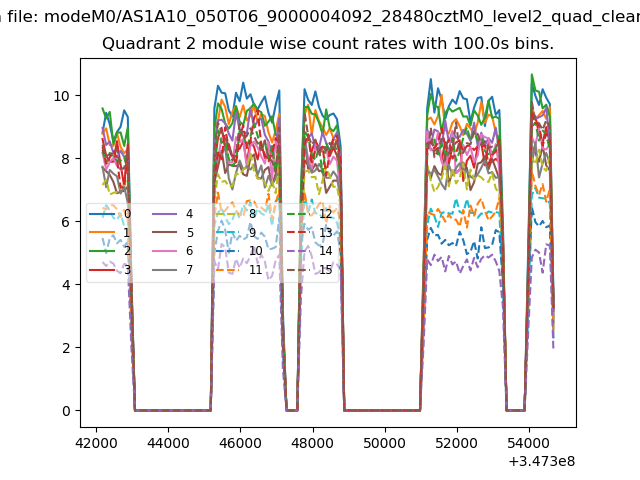 |
 |
| Module-wise count rates for Quadrant D Data is divided into 100 sec bins |
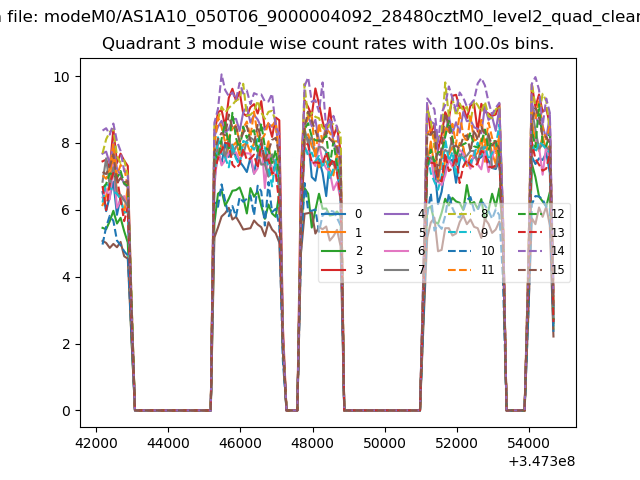 |
 |
| Parameter | Plot |
|---|---|
| CZT HV Monitor | 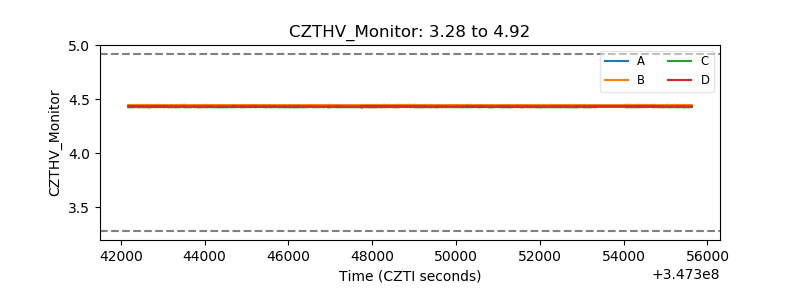 |
| D_VDD | 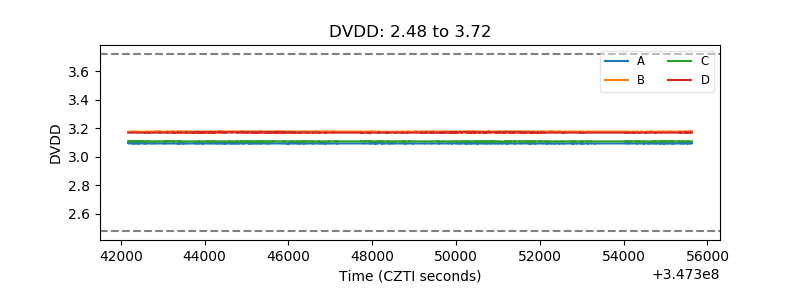 |
| Temperature 1 |  |
| Veto HV Monitor | 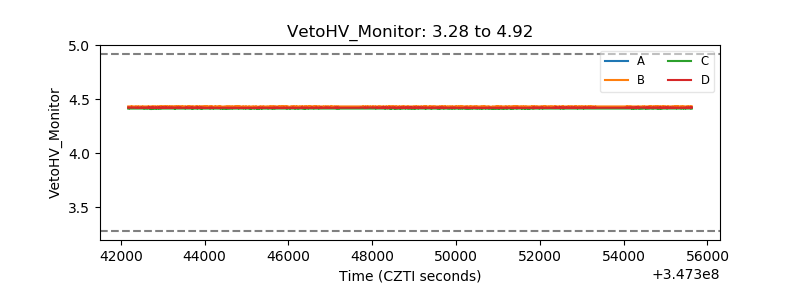 |
| Veto LLD | 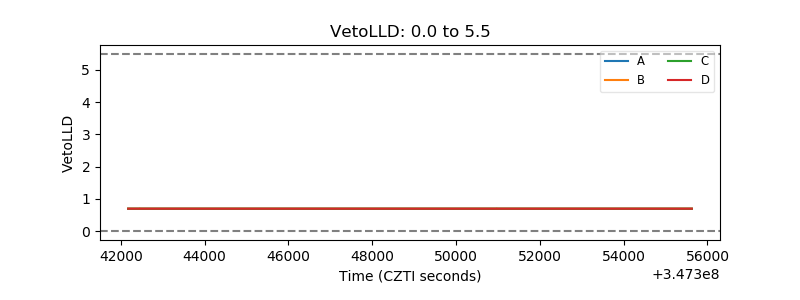 |
| Alpha Counter | 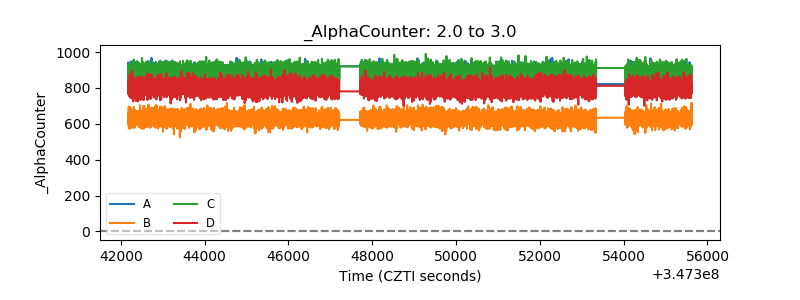 |
| _CPM_Rate | 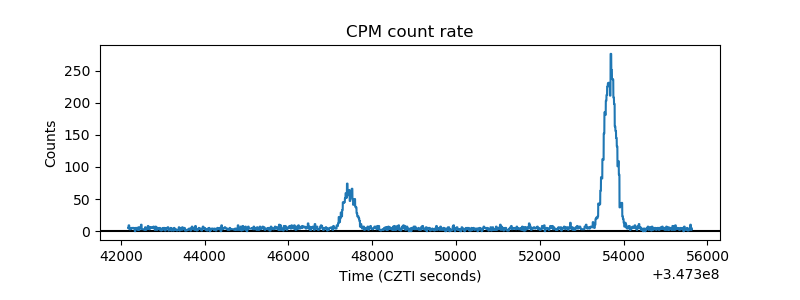 |
| CZT Counter | 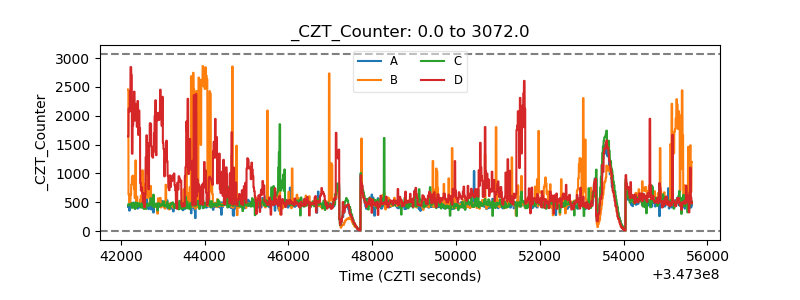 |
| +2.5 Volts monitor |  |
| +5 Volts monitor | 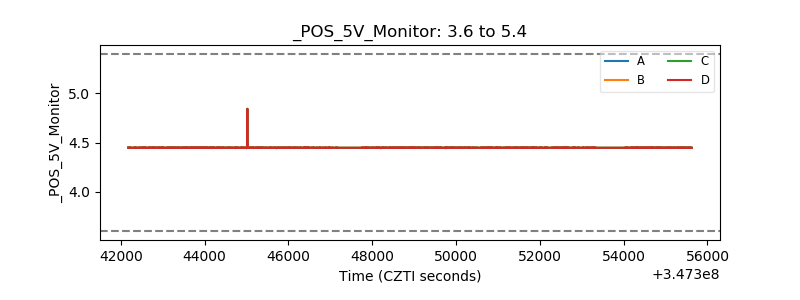 |
| _ROLL_ROT |  |
| _Roll_DEC | 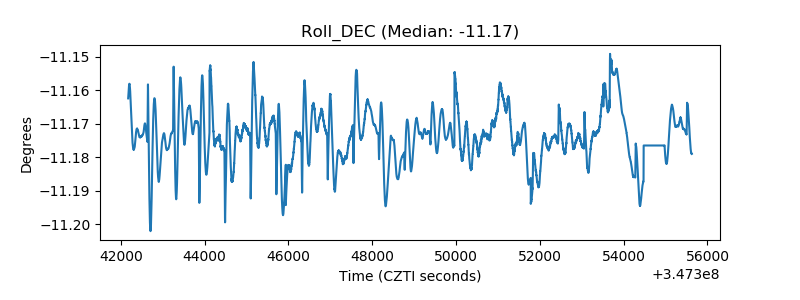 |
| _Roll_RA | 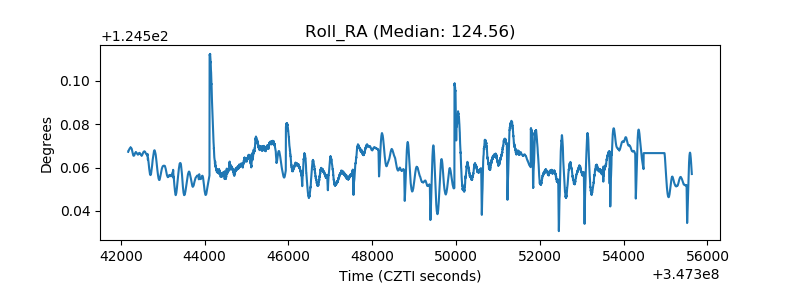 |
| Veto Counter | 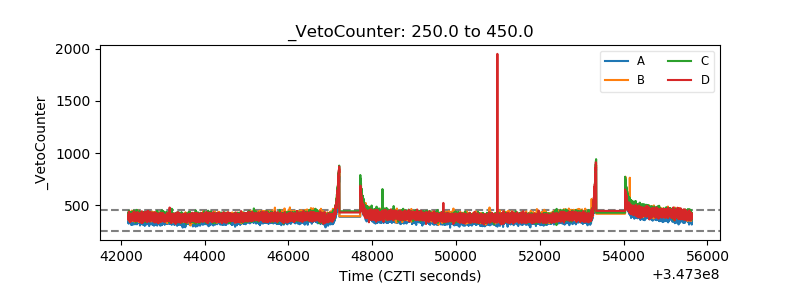 |