| Param | Original file | Final file |
|---|---|---|
| Filename | modeM0/AS1A10_050T06_9000004092_28481cztM0_level2.evt | modeM0/AS1A10_050T06_9000004092_28481cztM0_level2_quad_clean.evt |
| Size (bytes) | 390,450,240 | 54,060,480 |
| Size | 372.4 MB | 51.6 MB |
| Events in quadrant A | 2,242,344 | 333,852 |
| Events in quadrant B | 4,139,691 | 320,505 |
| Events in quadrant C | 2,351,203 | 323,216 |
| Events in quadrant D | 2,762,331 | 319,162 |
| Mode M0 | |||
|---|---|---|---|
| Quadrant | BADHDUFLAG | Total packets | Discarded packets |
| A | 0 | 9753 | 1 |
| B | 0 | 15579 | 1 |
| C | 0 | 9889 | 1 |
| D | 0 | 11298 | 1 |
| Mode SS | |||
|---|---|---|---|
| Quadrant | BADHDUFLAG | Total packets | Discarded packets |
| A | 0 | 98 | 0 |
| B | 0 | 98 | 0 |
| C | 0 | 98 | 0 |
| D | 0 | 98 | 0 |
| Quadrant | Total seconds | Saturated seconds | Saturation percentage |
|---|---|---|---|
| A | 4837 | 2 | 0.041348% |
| B | 4837 | 479 | 9.902832% |
| C | 4837 | 28 | 0.578871% |
| D | 4837 | 22 | 0.454827% |
Noise dominated data is calculated using 1-second bins in cleaned event files. If a bin has >2000 counts, and if more than 50% of those come from <1% of pixels, then it is considered to be noise-dominated and hence unusable.
| Quadrant | # 1 sec bins | Bins with >0 counts | Bins with >2000 counts | High rate bins dominated by noise | Noise dominated (total time) | Noise dominated (detector-on time) | Marked lightcurve |
|---|---|---|---|---|---|---|---|
| A | 4837 | 4837 | 0 | 0 | 0.00% | 0.00% | 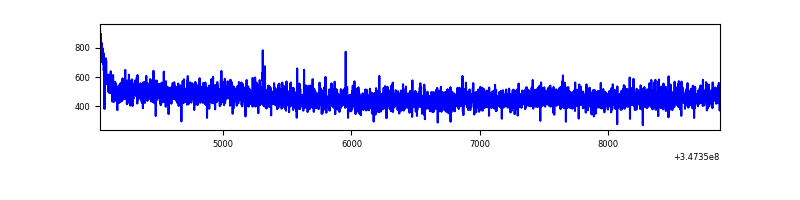 |
| B | 4837 | 4837 | 365 | 365 | 7.55% | 7.55% | 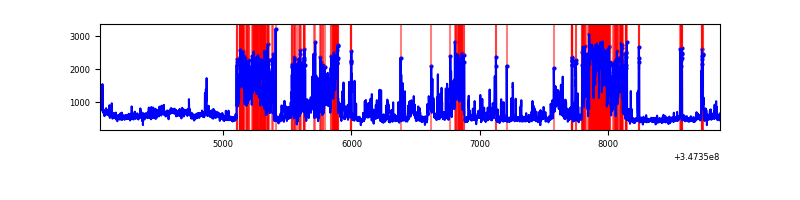 |
| C | 4837 | 4837 | 0 | 0 | 0.00% | 0.00% | 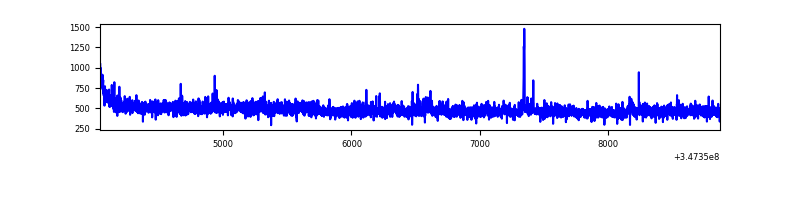 |
| D | 4837 | 4837 | 19 | 19 | 0.39% | 0.39% | 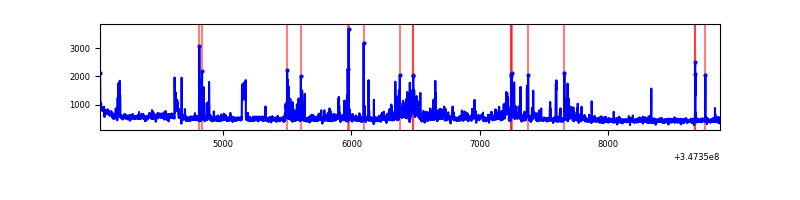 |
Top three noisy pixels from each quadrant. If the there are fewer than three noisy pixels in the level2.evt file, extra rows are filled as -1
| Pixel properties | Quadrant properties | ||||||
|---|---|---|---|---|---|---|---|
| Quadrant | DetID | PixID | Counts | Sigma | Mean | Median | Sigma |
| A | 15 | 174 | 18309 | 150.76 | 576 | 563 | 117.7 |
| A | 13 | 254 | 6744 | 52.51 | 576 | 563 | 117.7 |
| A | 3 | 137 | 5839 | 44.82 | 576 | 563 | 117.7 |
| B | 10 | 245 | 1936769 | 17880.62 | 552 | 537 | 108.3 |
| B | 0 | 230 | 28818 | 261.17 | 552 | 537 | 108.3 |
| B | 12 | 111 | 13661 | 121.2 | 552 | 537 | 108.3 |
| C | 14 | 238 | 88783 | 659.83 | 559 | 562 | 133.7 |
| C | 7 | 247 | 76164 | 565.45 | 559 | 562 | 133.7 |
| C | 3 | 233 | 5910 | 40.0 | 559 | 562 | 133.7 |
| D | 1 | 52 | 237546 | 1768.5 | 561 | 548 | 134.0 |
| D | 13 | 104 | 202911 | 1510.05 | 561 | 548 | 134.0 |
| D | 8 | 195 | 149995 | 1115.19 | 561 | 548 | 134.0 |
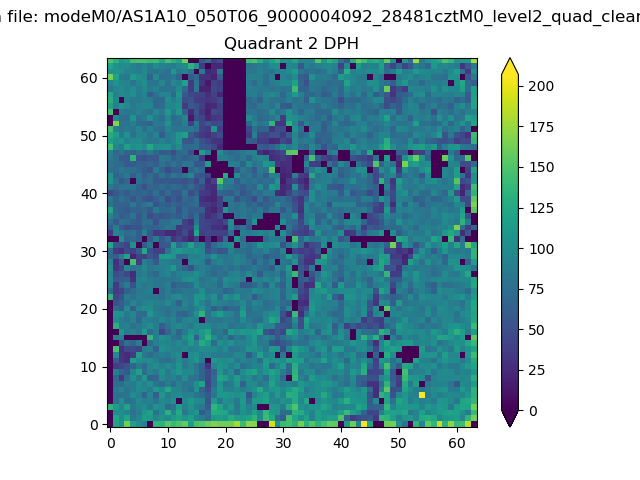
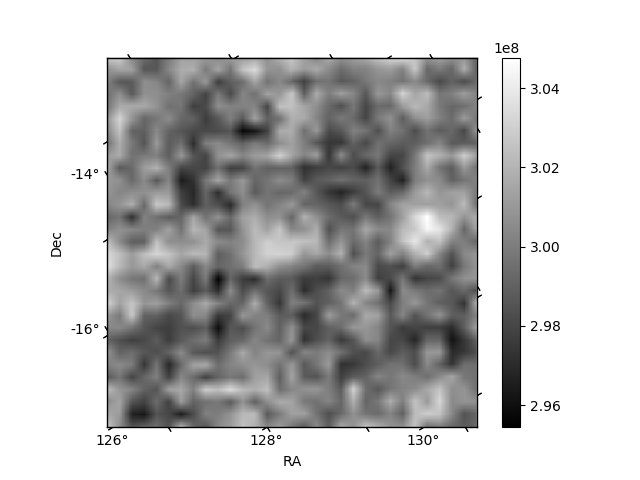
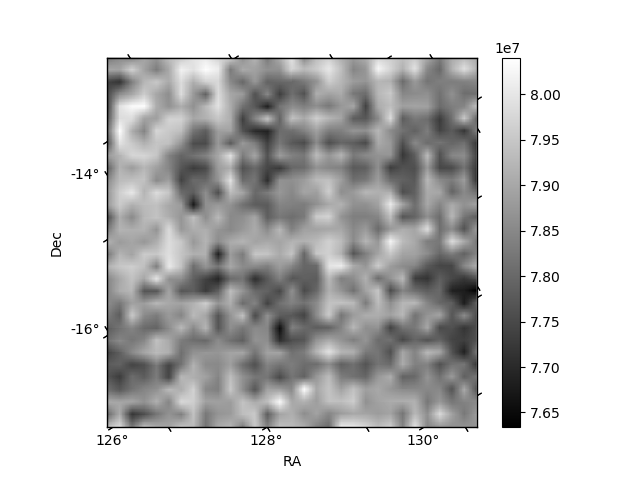
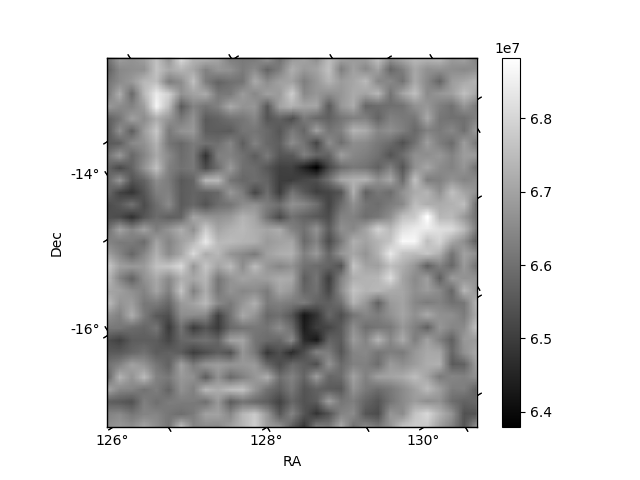
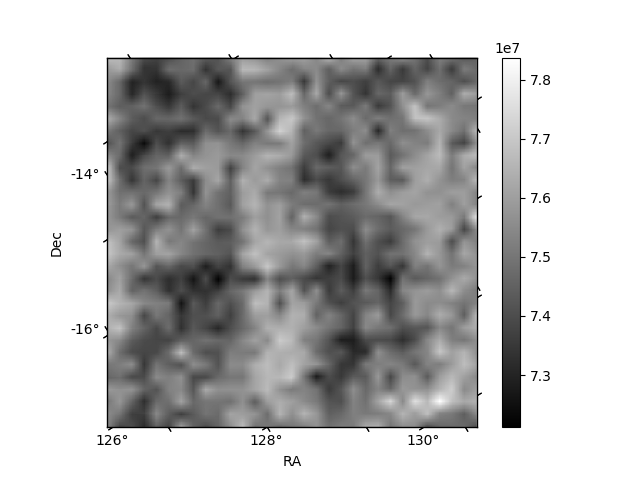
Histogram calculated using DETX and DETY for each event in the final _common_clean file
| Quadrant A | 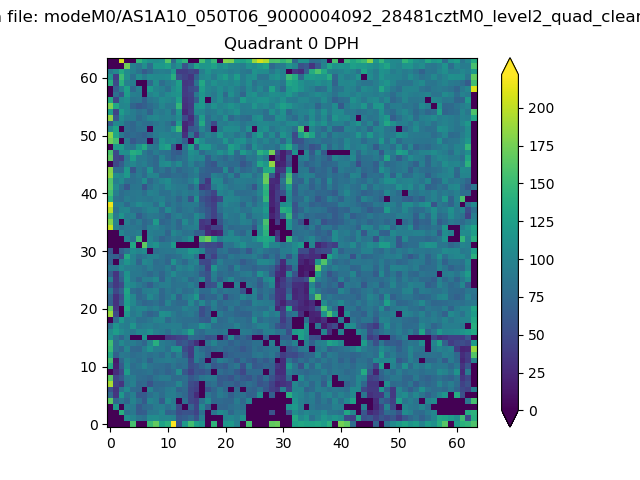 |
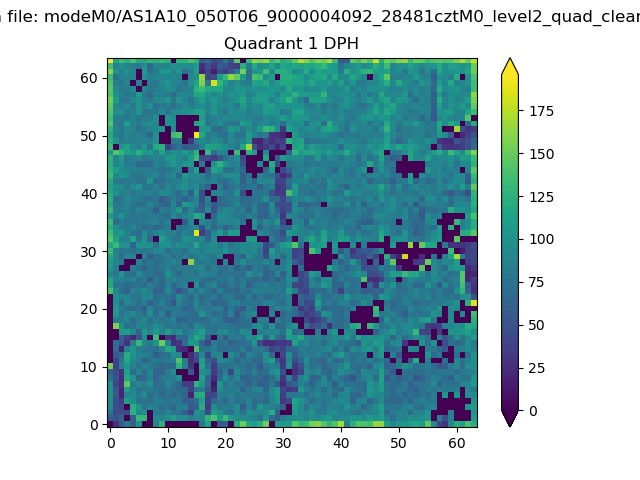 |
Quadrant B |
|---|---|---|---|
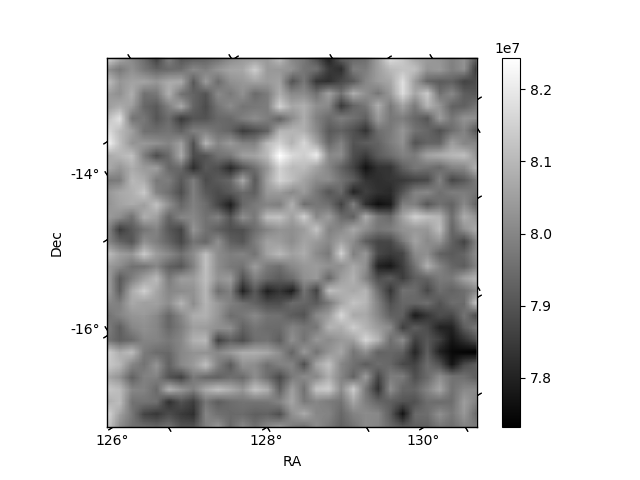
| Quadrant D | 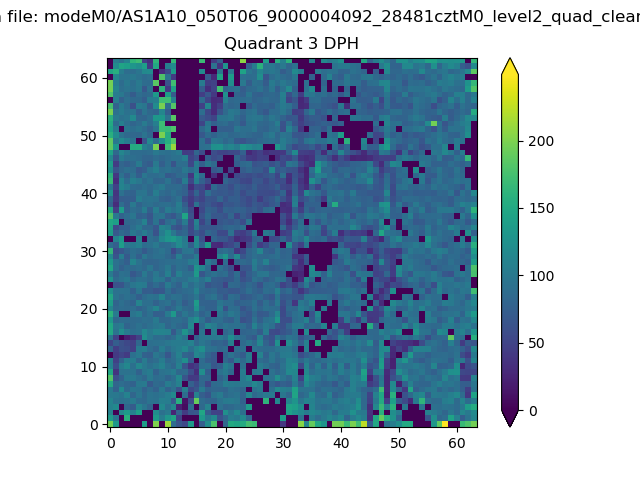 |
 |
Quadrant C |
| Plot type | Count rate plots | Images |
|---|---|---|
| Comparison with Poisson distribution Blue bars denote a histogram of data divided into 1 sec bins. Red curve is a Poisson curve with rate = median count rate of data. |
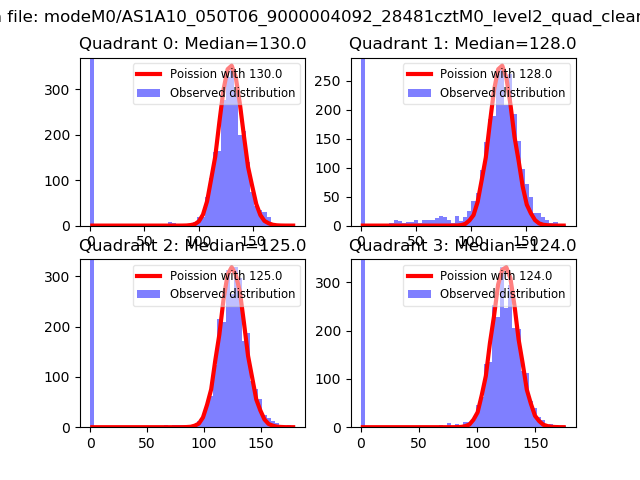 |
 |
| Quadrant-wise count rates Data is divided into 100 sec bins |
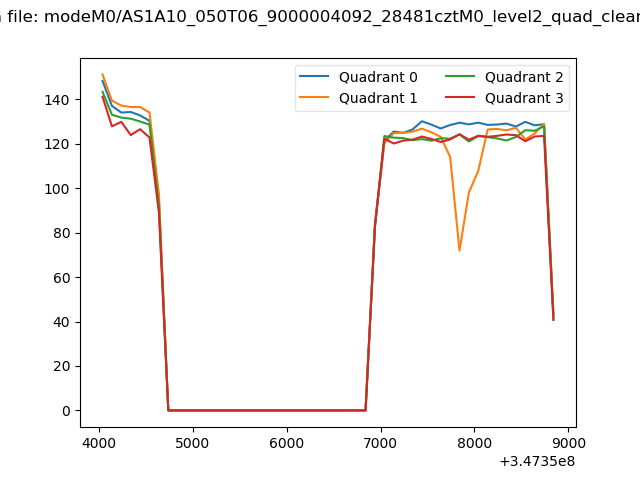 |
|
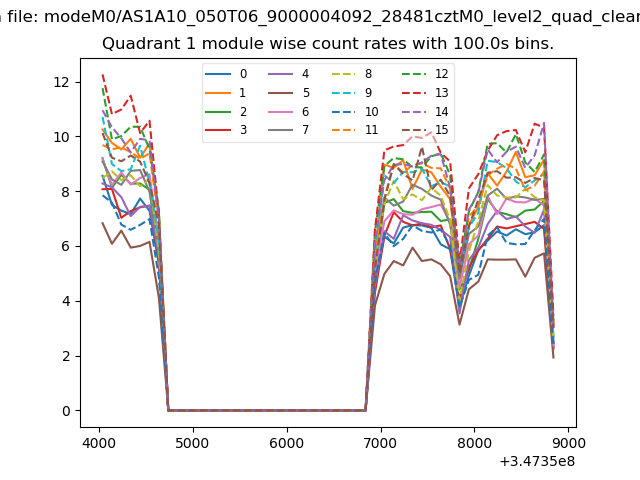
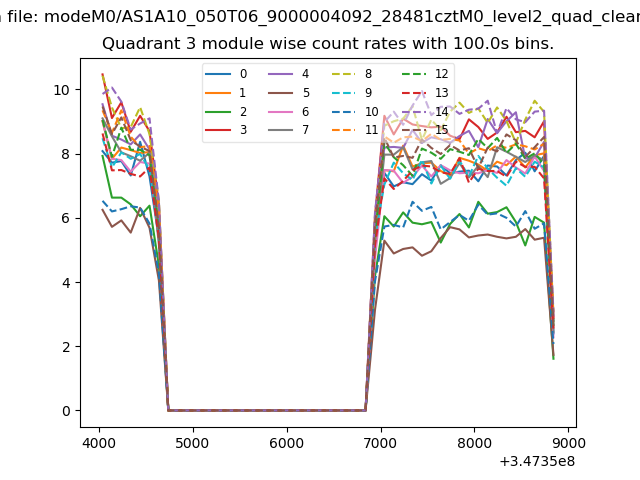
| Module-wise count rates for Quadrant A Data is divided into 100 sec bins |
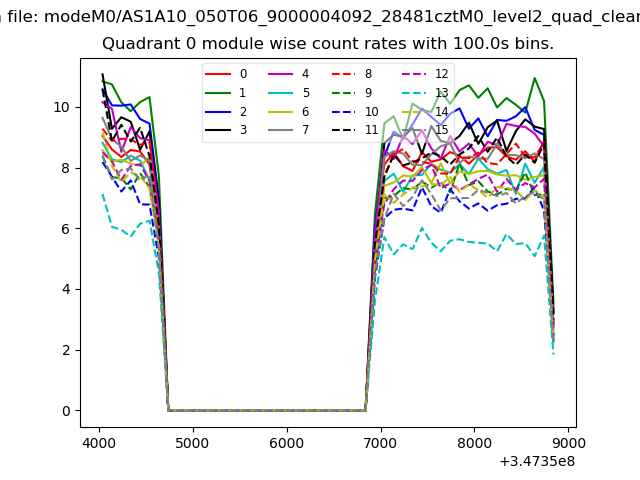 |
 |
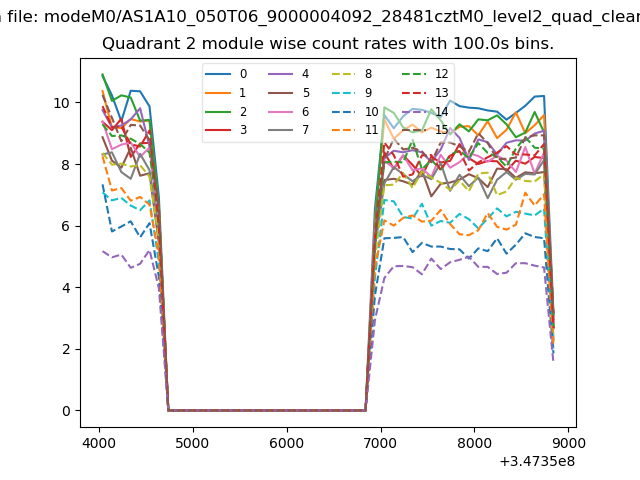
| Module-wise count rates for Quadrant B Data is divided into 100 sec bins |
 |
 |
| Module-wise count rates for Quadrant C Data is divided into 100 sec bins |
 |
 |
| Module-wise count rates for Quadrant D Data is divided into 100 sec bins |
 |
 |
| Parameter | Plot |
|---|---|
| CZT HV Monitor | 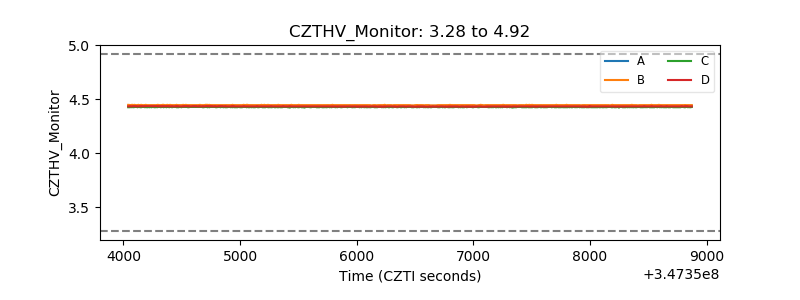 |
| D_VDD | 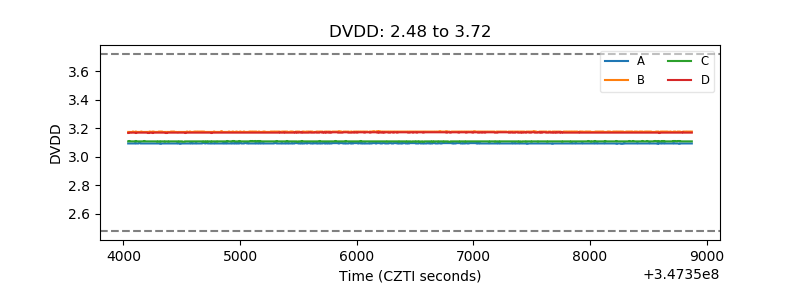 |
| Temperature 1 | 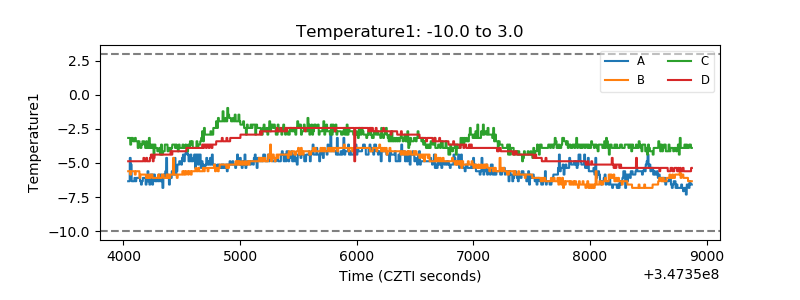 |
| Veto HV Monitor |  |
| Veto LLD | 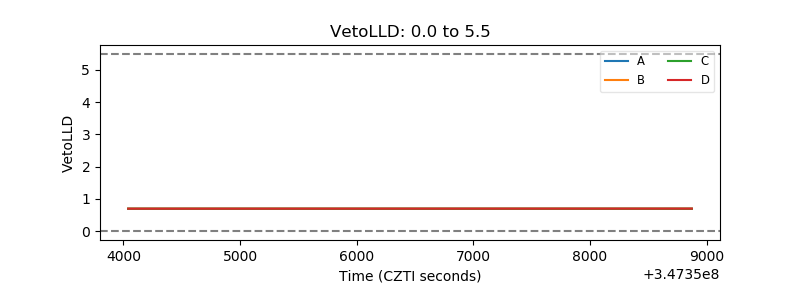 |
| Alpha Counter | 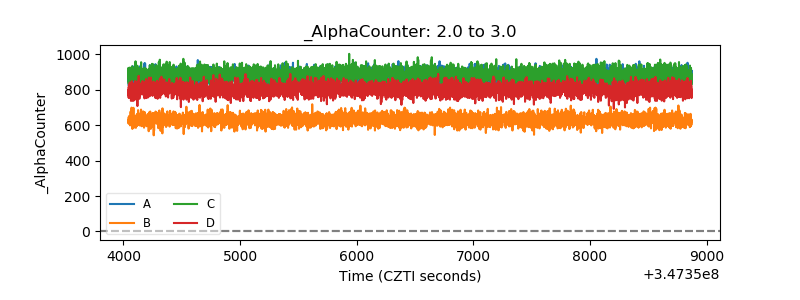 |
| _CPM_Rate | 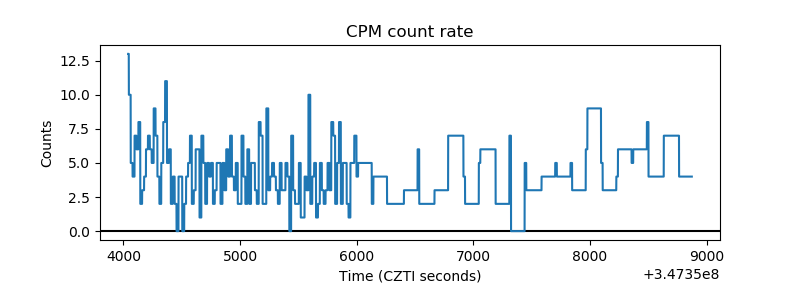 |
| CZT Counter | 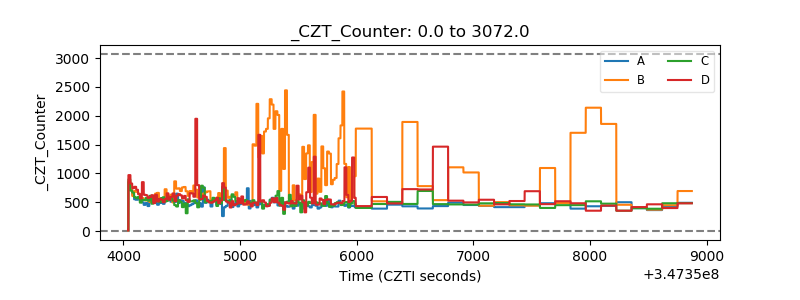 |
| +2.5 Volts monitor |  |
| +5 Volts monitor |  |
| _ROLL_ROT | 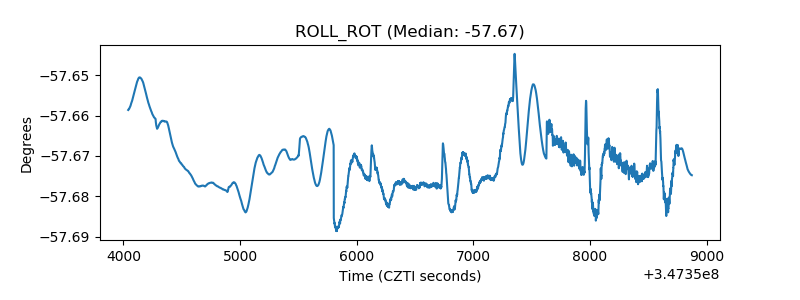 |
| _Roll_DEC | 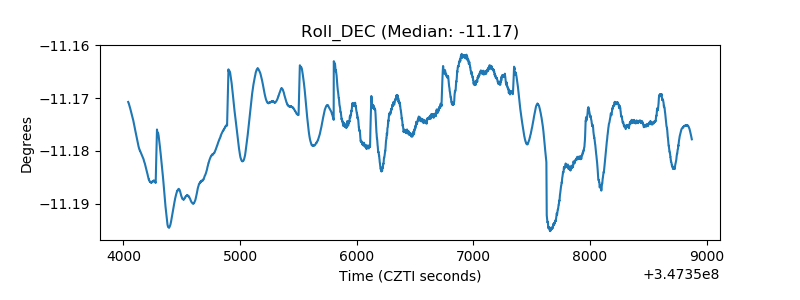 |
| _Roll_RA | 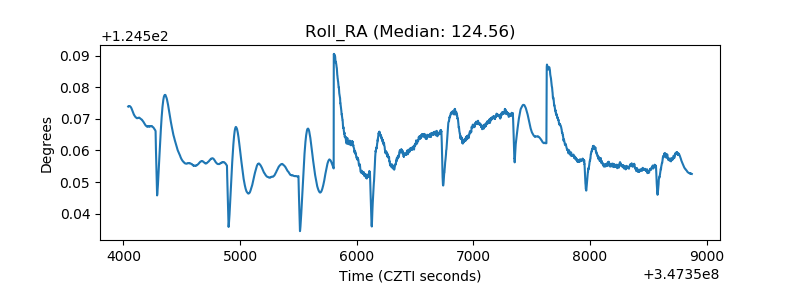 |
| Veto Counter | 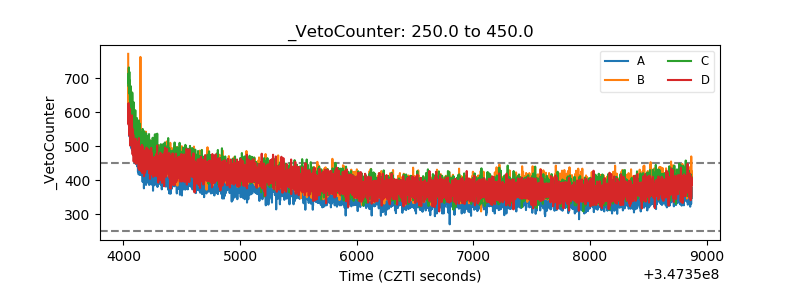 |