| Param | Original file | Final file |
|---|---|---|
| Filename | modeM0/AS1A10_110T04_9000004094cztM0_level2.fits | modeM0/AS1A10_110T04_9000004094cztM0_level2_quad_clean.evt |
| Size (bytes) | 546,710,400 | 447,082,560 |
| Size | 521.4 MB | 426.4 MB |
| Events in quadrant A | 3,496,706 | 2,652,342 |
| Events in quadrant B | 3,139,998 | 2,517,614 |
| Events in quadrant C | 3,468,512 | 2,569,381 |
| Events in quadrant D | 2,739,328 | 2,093,791 |
| Mode M0 | |||
|---|---|---|---|
| Quadrant | BADHDUFLAG | Total packets | Discarded packets |
| A | 0 | 124062 | 0 |
| B | 0 | 175161 | 0 |
| C | 0 | 118261 | 0 |
| D | 0 | 211416 | 0 |
| Mode SS | |||
|---|---|---|---|
| Quadrant | BADHDUFLAG | Total packets | Discarded packets |
| A | 0 | 1100 | 0 |
| B | 0 | 1100 | 0 |
| C | 0 | 1100 | 0 |
| D | 0 | 1100 | 0 |
| Mode M9 | |||
|---|---|---|---|
| Quadrant | BADHDUFLAG | Total packets | Discarded packets |
| A | 0 | 98 | 0 |
| B | 0 | 98 | 0 |
| C | 0 | 98 | 0 |
| D | 0 | 98 | 0 |
| Quadrant | Total seconds | Saturated seconds | Saturation percentage |
|---|---|---|---|
| A | 53997 | 1353 | 2.505695% |
| B | 53997 | 7350 | 13.611867% |
| C | 53997 | 1303 | 2.413097% |
| D | 53997 | 10451 | 19.354779% |
Noise dominated data is calculated using 1-second bins in cleaned event files. If a bin has >2000 counts, and if more than 50% of those come from <1% of pixels, then it is considered to be noise-dominated and hence unusable.
| Quadrant | # 1 sec bins | Bins with >0 counts | Bins with >2000 counts | High rate bins dominated by noise | Noise dominated (total time) | Noise dominated (detector-on time) | Marked lightcurve |
|---|---|---|---|---|---|---|---|
| A | 63326 | 53980 | 0 | 0 | 0.00% | 0.00% |  |
| B | 63326 | 53765 | 0 | 0 | 0.00% | 0.00% | 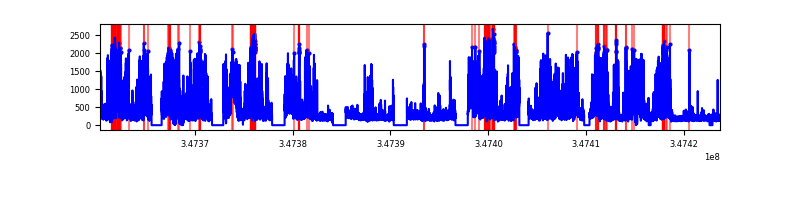 |
| C | 63326 | 53986 | 0 | 0 | 0.00% | 0.00% | 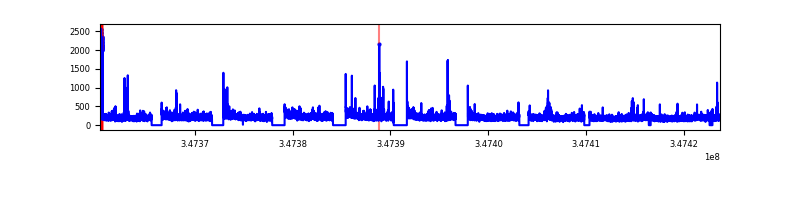 |
| D | 63326 | 53505 | 0 | 0 | 0.00% | 0.00% | 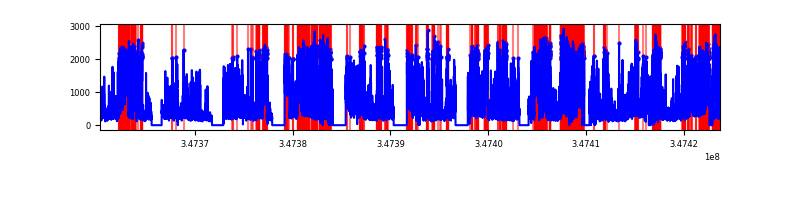 |
Top three noisy pixels from each quadrant. If the there are fewer than three noisy pixels in the level2.evt file, extra rows are filled as -1
| Pixel properties | Quadrant properties | ||||||
|---|---|---|---|---|---|---|---|
| Quadrant | DetID | PixID | Counts | Sigma | Mean | Median | Sigma |
| A | 0 | 29 | 3349 | 11.38 | 911 | 859 | 218.8 |
| A | 7 | 110 | 2742 | 8.61 | 911 | 859 | 218.8 |
| A | 9 | 19 | 2578 | 7.86 | 911 | 859 | 218.8 |
| B | 2 | 9 | 2516 | 10.66 | 830 | 794 | 161.6 |
| B | 2 | 8 | 2079 | 7.95 | 830 | 794 | 161.6 |
| B | 5 | 128 | 2040 | 7.71 | 830 | 794 | 161.6 |
| C | 1 | 81 | 2694 | 8.04 | 918 | 866 | 227.4 |
| C | 1 | 80 | 2667 | 7.92 | 918 | 866 | 227.4 |
| C | 12 | 241 | 2356 | 6.55 | 918 | 866 | 227.4 |
| D | 6 | 67 | 1976 | 6.13 | 782 | 715 | 205.8 |
| D | 15 | 47 | 1901 | 5.76 | 782 | 715 | 205.8 |
| D | 10 | 189 | 1892 | 5.72 | 782 | 715 | 205.8 |
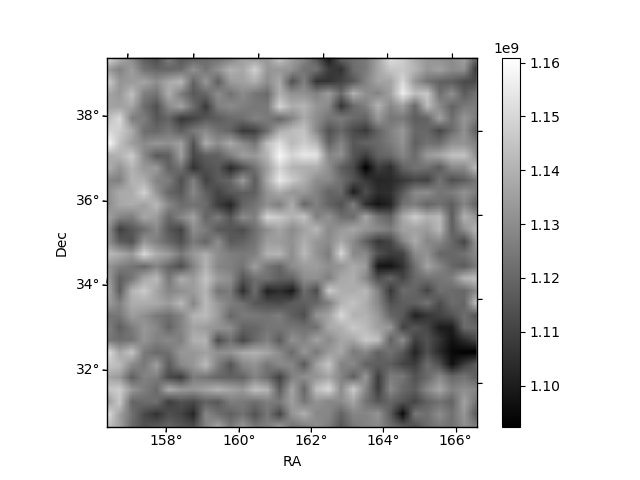
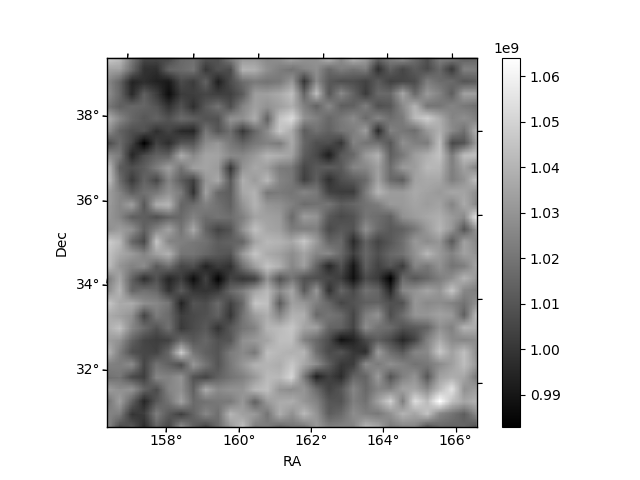
Histogram calculated using DETX and DETY for each event in the final _common_clean file
| Quadrant A |  |
 |
Quadrant B |
|---|---|---|---|
| Quadrant D |  |
 |
Quadrant C |
| Plot type | Count rate plots | Images |
|---|---|---|
| Comparison with Poisson distribution Blue bars denote a histogram of data divided into 1 sec bins. Red curve is a Poisson curve with rate = median count rate of data. |
 |
 |
| Quadrant-wise count rates Data is divided into 100 sec bins |
 |
|
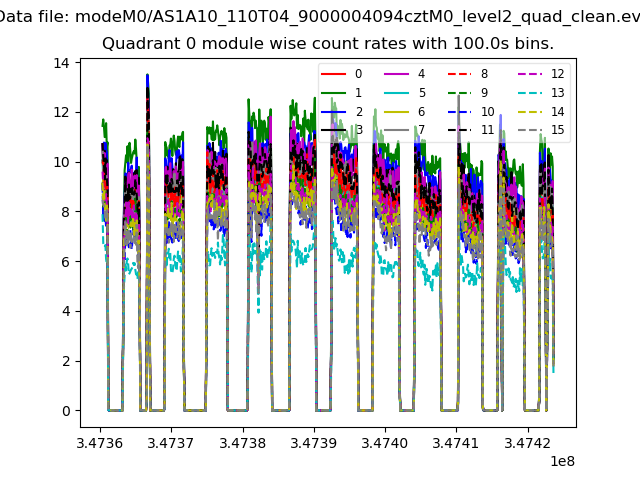
| Module-wise count rates for Quadrant A Data is divided into 100 sec bins |
 |
 |
| Module-wise count rates for Quadrant B Data is divided into 100 sec bins |
 |
 |
| Module-wise count rates for Quadrant C Data is divided into 100 sec bins |
 |
 |
| Module-wise count rates for Quadrant D Data is divided into 100 sec bins |
 |
 |
| Parameter | Plot |
|---|---|
| CZT HV Monitor |  |
| D_VDD |  |
| Temperature 1 |  |
| Veto HV Monitor | 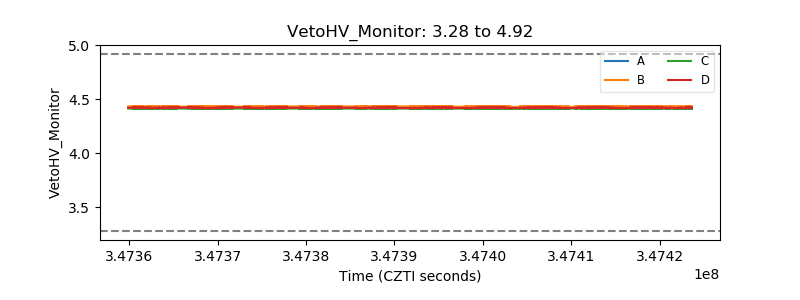 |
| Veto LLD | 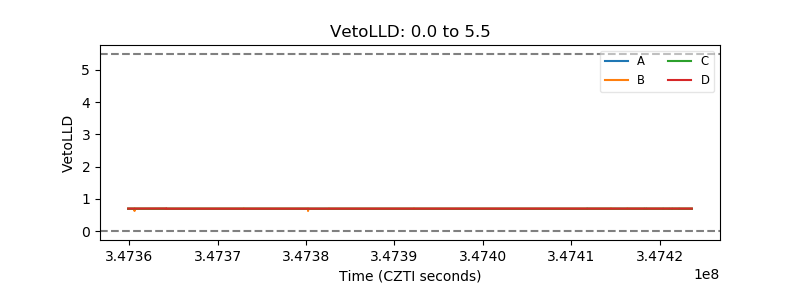 |
| Alpha Counter |  |
| _CPM_Rate |  |
| CZT Counter |  |
| +2.5 Volts monitor | 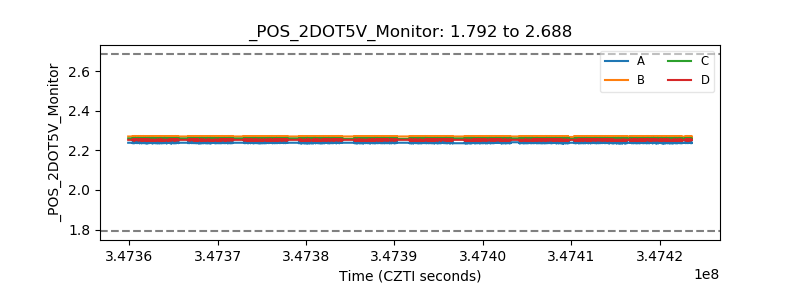 |
| +5 Volts monitor | 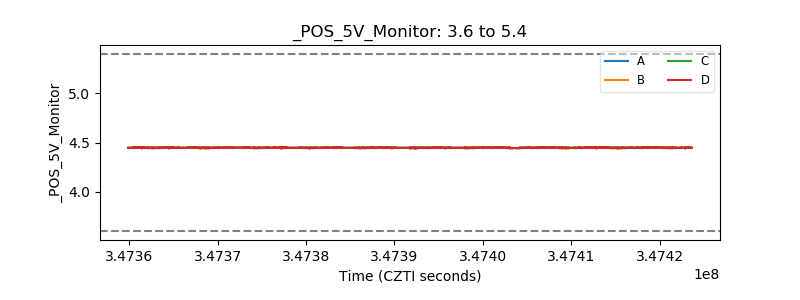 |
| _ROLL_ROT |  |
| _Roll_DEC |  |
| _Roll_RA |  |
| Veto Counter | 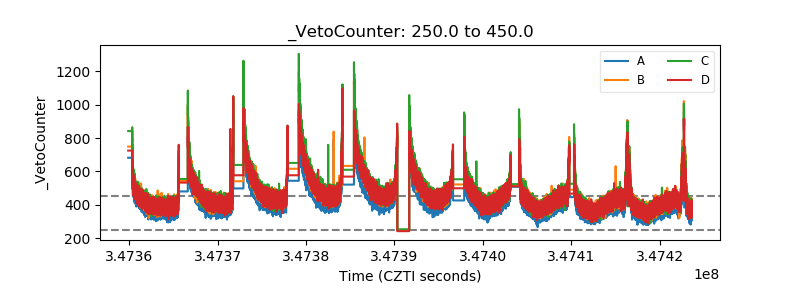 |