| Param | Original file | Final file |
|---|---|---|
| Filename | modeM0/AS1A10_110T04_9000004094_28481cztM0_level2.evt | modeM0/AS1A10_110T04_9000004094_28481cztM0_level2_quad_clean.evt |
| Size (bytes) | 139,020,480 | 18,239,040 |
| Size | 132.6 MB | 17.4 MB |
| Events in quadrant A | 728,180 | 115,956 |
| Events in quadrant B | 1,512,826 | 113,890 |
| Events in quadrant C | 943,449 | 107,398 |
| Events in quadrant D | 928,327 | 110,518 |
| Mode M0 | |||
|---|---|---|---|
| Quadrant | BADHDUFLAG | Total packets | Discarded packets |
| A | 0 | 2908 | 0 |
| B | 0 | 5375 | 0 |
| C | 0 | 3587 | 0 |
| D | 0 | 3694 | 0 |
| Mode M9 | |||
|---|---|---|---|
| Quadrant | BADHDUFLAG | Total packets | Discarded packets |
| A | 0 | 5 | 0 |
| B | 0 | 5 | 0 |
| C | 0 | 5 | 0 |
| D | 0 | 5 | 0 |
| Quadrant | Total seconds | Saturated seconds | Saturation percentage |
|---|---|---|---|
| A | 1395 | 11 | 0.788530% |
| B | 1394 | 366 | 26.255380% |
| C | 1394 | 133 | 9.540890% |
| D | 1394 | 12 | 0.860832% |
Noise dominated data is calculated using 1-second bins in cleaned event files. If a bin has >2000 counts, and if more than 50% of those come from <1% of pixels, then it is considered to be noise-dominated and hence unusable.
| Quadrant | # 1 sec bins | Bins with >0 counts | Bins with >2000 counts | High rate bins dominated by noise | Noise dominated (total time) | Noise dominated (detector-on time) | Marked lightcurve |
|---|---|---|---|---|---|---|---|
| A | 1395 | 1395 | 0 | 0 | 0.00% | 0.00% | 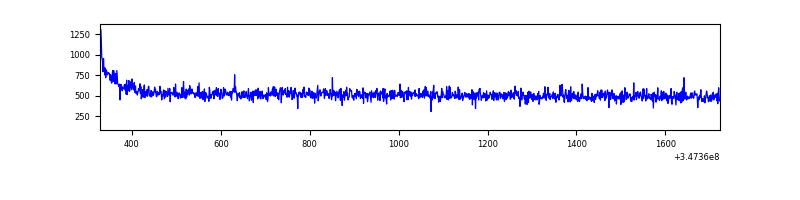 |
| B | 1394 | 1394 | 292 | 292 | 20.95% | 20.95% | 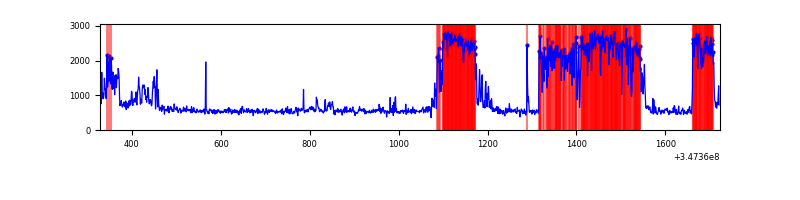 |
| C | 1394 | 1394 | 90 | 90 | 6.46% | 6.46% | 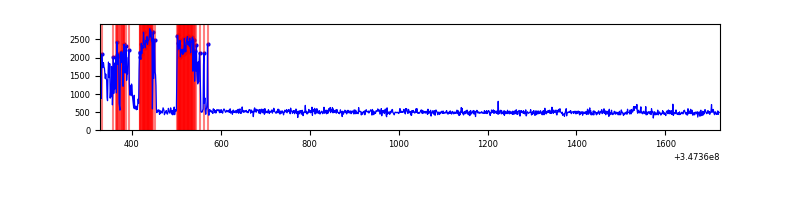 |
| D | 1394 | 1394 | 3 | 3 | 0.22% | 0.22% | 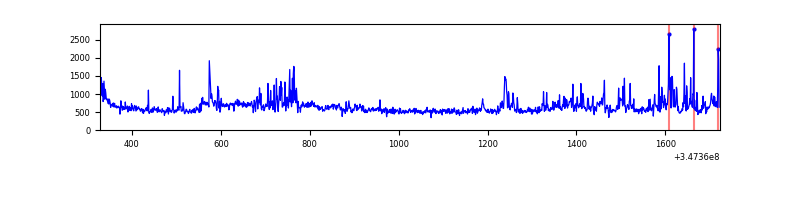 |
Top three noisy pixels from each quadrant. If the there are fewer than three noisy pixels in the level2.evt file, extra rows are filled as -1
| Pixel properties | Quadrant properties | ||||||
|---|---|---|---|---|---|---|---|
| Quadrant | DetID | PixID | Counts | Sigma | Mean | Median | Sigma |
| A | 8 | 192 | 1900 | 44.01 | 188 | 184 | 39.0 |
| A | 13 | 254 | 1893 | 43.83 | 188 | 184 | 39.0 |
| A | 3 | 137 | 1856 | 42.88 | 188 | 184 | 39.0 |
| B | 10 | 245 | 867974 | 26137.79 | 161 | 158 | 33.2 |
| B | 14 | 207 | 6686 | 196.62 | 161 | 158 | 33.2 |
| B | 12 | 111 | 3862 | 111.56 | 161 | 158 | 33.2 |
| C | 7 | 238 | 237814 | 5760.2 | 170 | 171 | 41.3 |
| C | 14 | 238 | 28001 | 674.57 | 170 | 171 | 41.3 |
| C | 7 | 222 | 4688 | 109.49 | 170 | 171 | 41.3 |
| D | 1 | 52 | 170140 | 3825.1 | 180 | 174 | 44.4 |
| D | 8 | 195 | 30621 | 685.21 | 180 | 174 | 44.4 |
| D | 13 | 104 | 27184 | 607.86 | 180 | 174 | 44.4 |
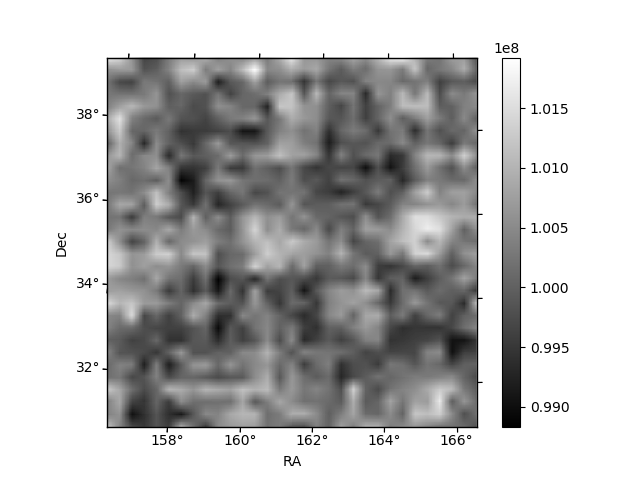
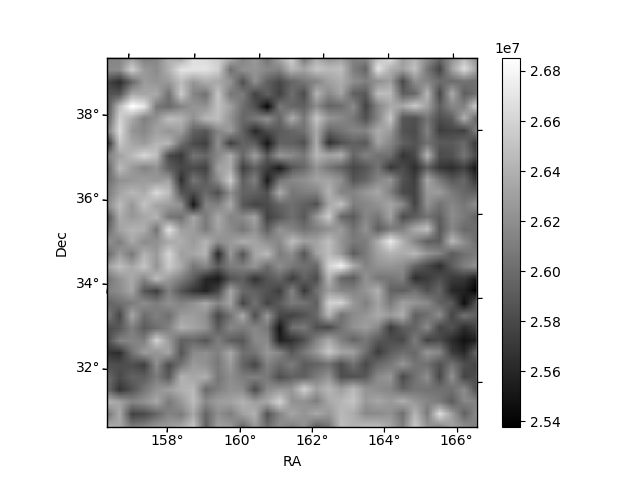
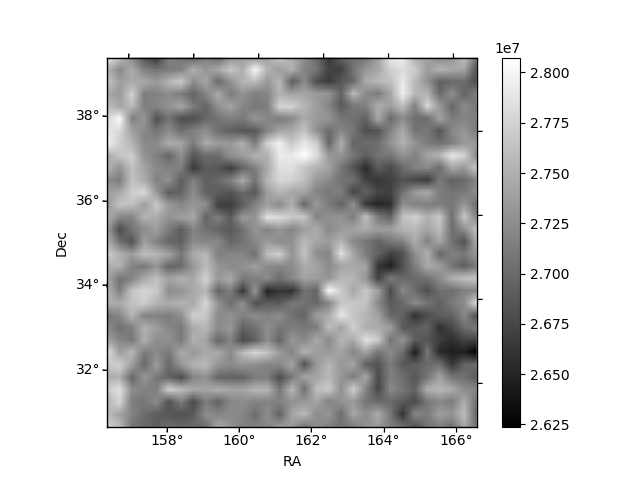
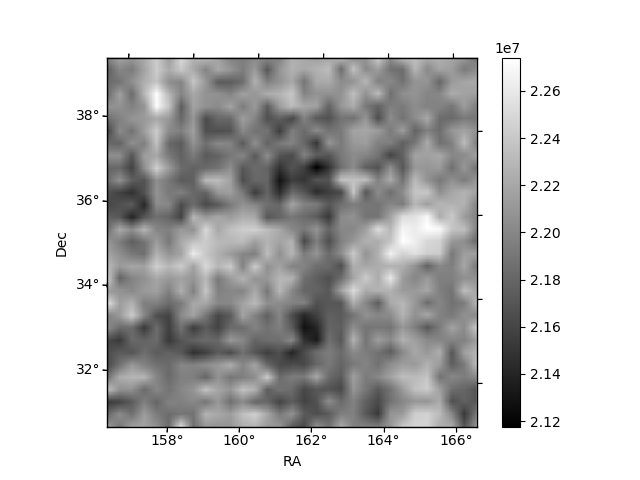
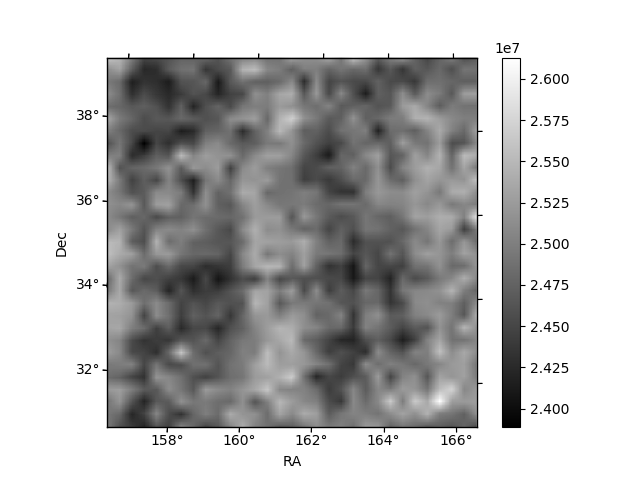
Histogram calculated using DETX and DETY for each event in the final _common_clean file
| Quadrant A | 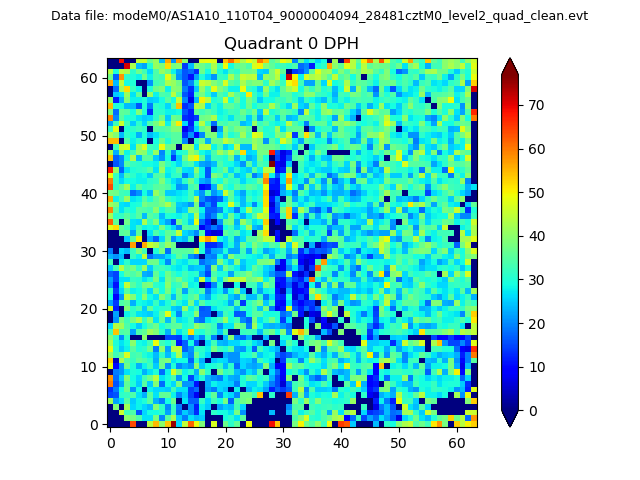 |
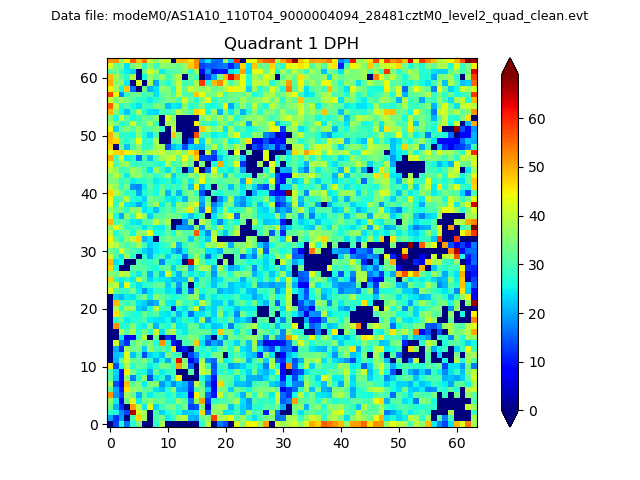 |
Quadrant B |
|---|---|---|---|
| Quadrant D | 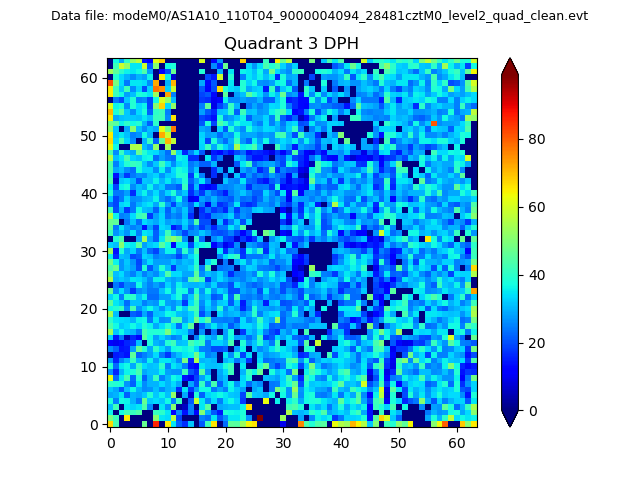 |
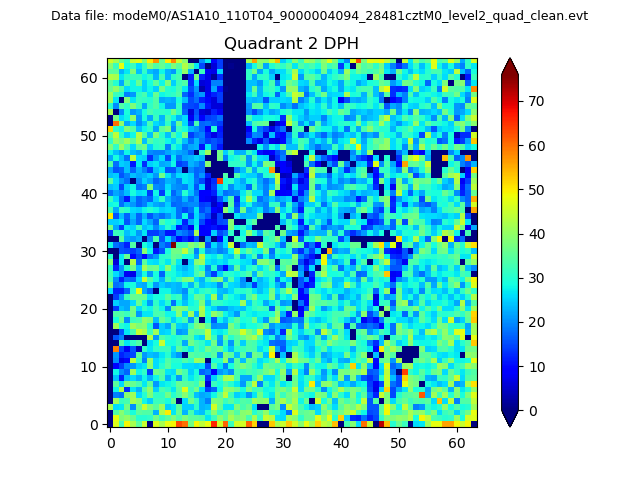 |
Quadrant C |
| Plot type | Count rate plots | Images |
|---|---|---|
| Comparison with Poisson distribution Blue bars denote a histogram of data divided into 1 sec bins. Red curve is a Poisson curve with rate = median count rate of data. |
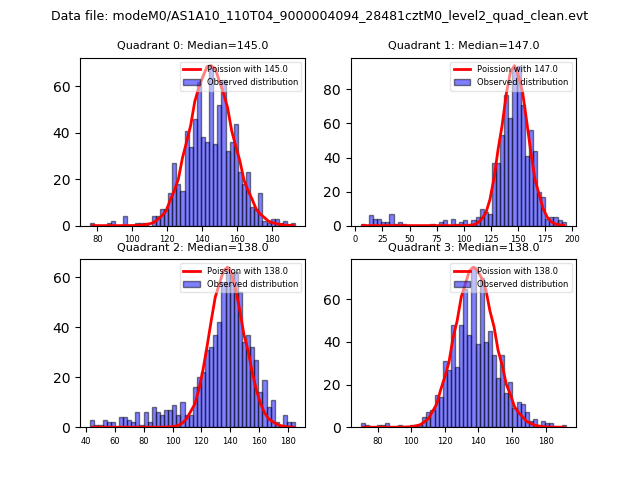 |
 |
| Quadrant-wise count rates Data is divided into 100 sec bins |
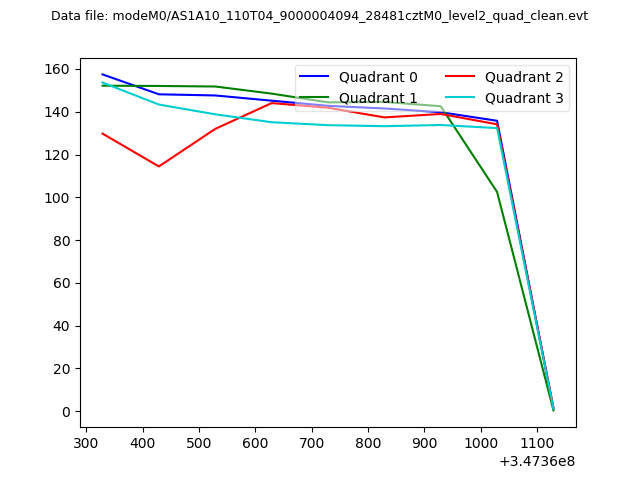 |
|
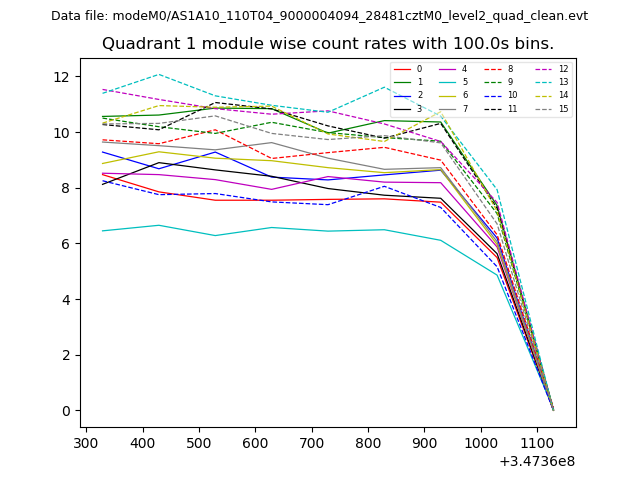
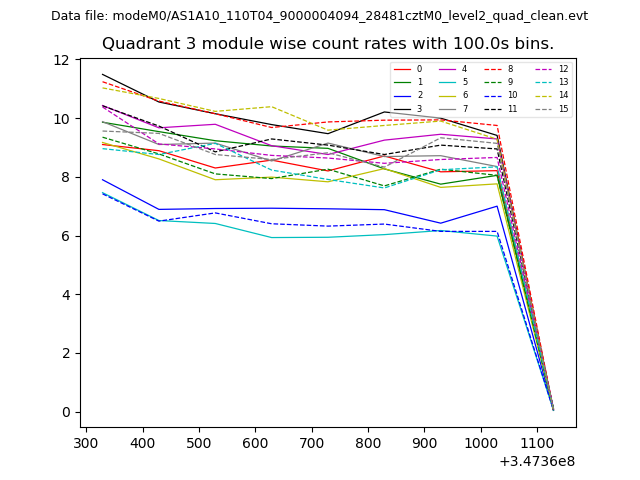
| Module-wise count rates for Quadrant A Data is divided into 100 sec bins |
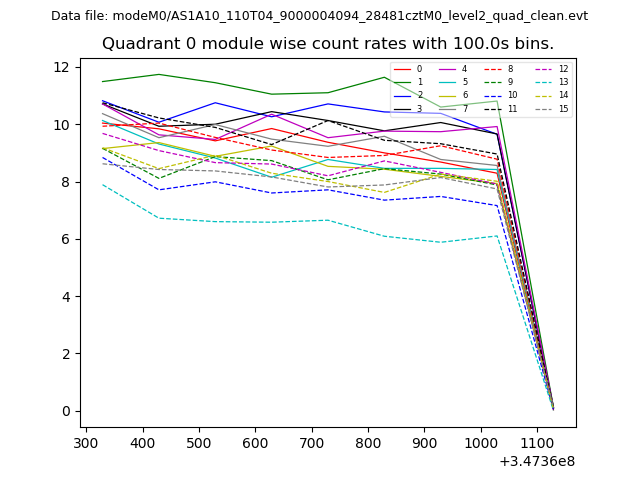 |
 |
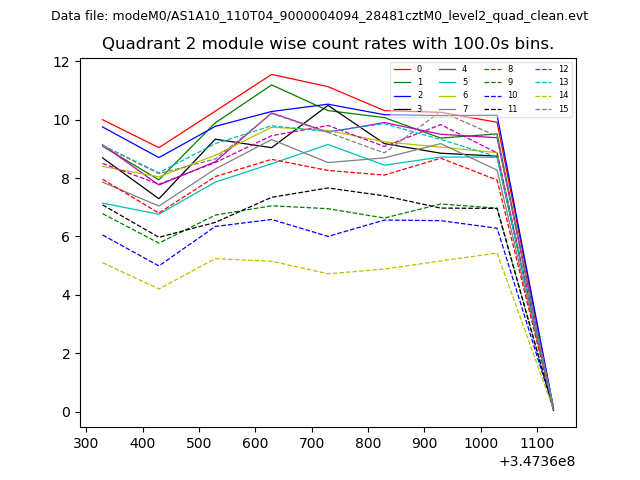
| Module-wise count rates for Quadrant B Data is divided into 100 sec bins |
 |
 |
| Module-wise count rates for Quadrant C Data is divided into 100 sec bins |
 |
 |
| Module-wise count rates for Quadrant D Data is divided into 100 sec bins |
 |
 |
| Parameter | Plot |
|---|---|
| CZT HV Monitor | 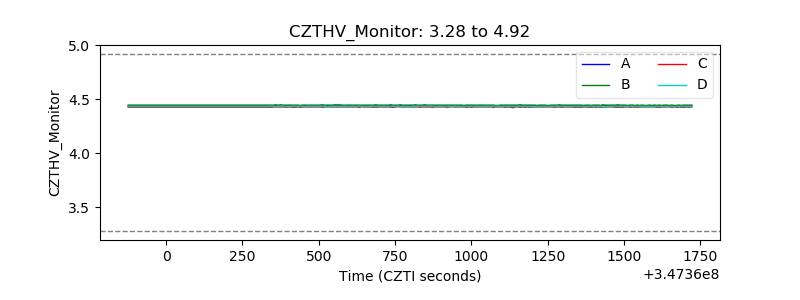 |
| D_VDD | 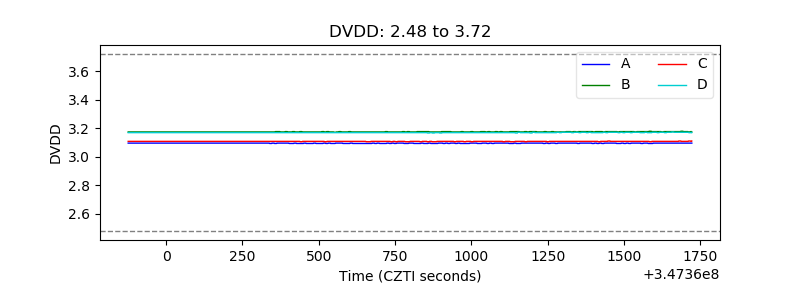 |
| Temperature 1 | 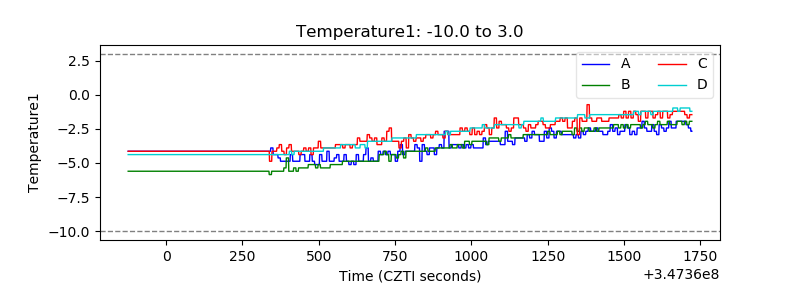 |
| Veto HV Monitor | 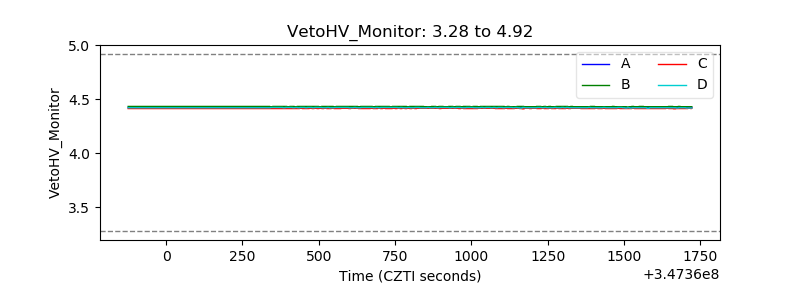 |
| Veto LLD | 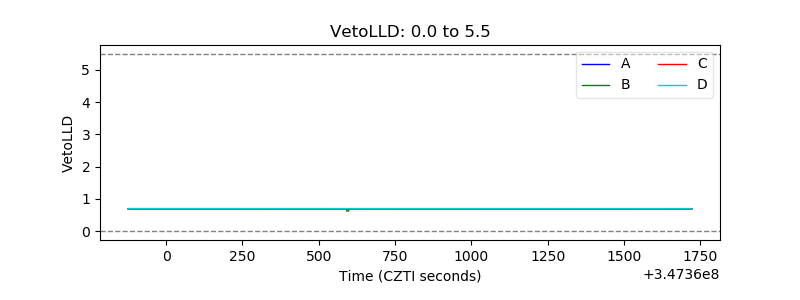 |
| Alpha Counter | 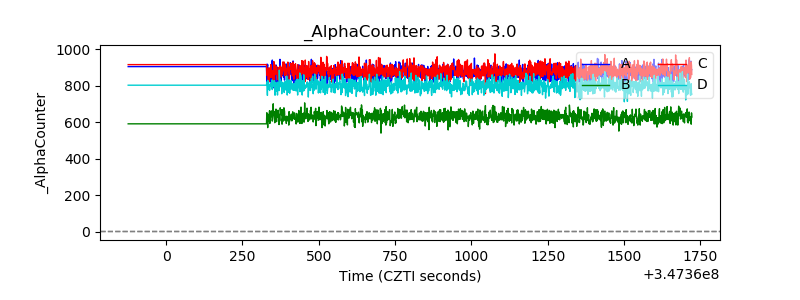 |
| _CPM_Rate | 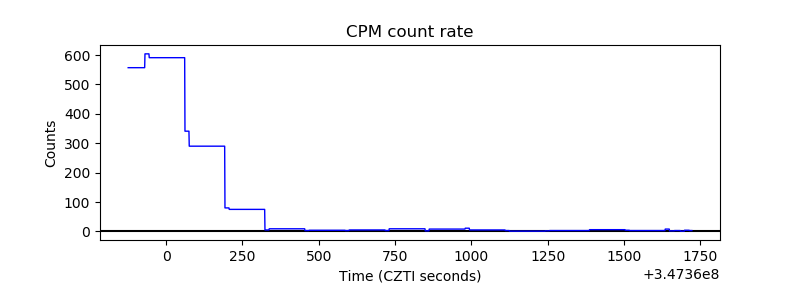 |
| CZT Counter | 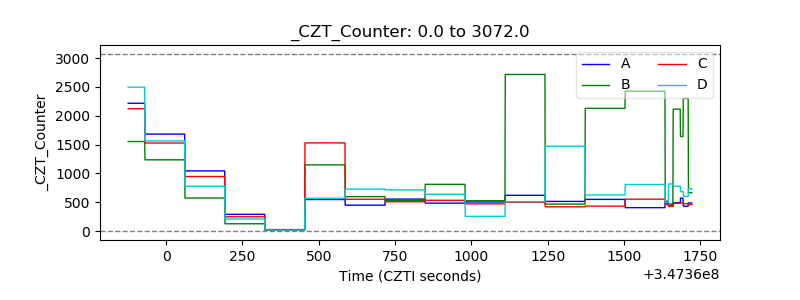 |
| +2.5 Volts monitor | 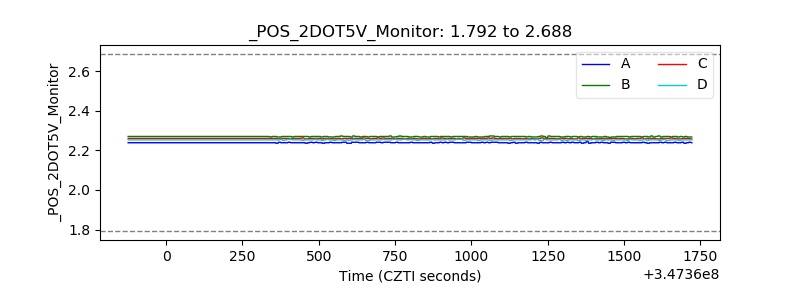 |
| +5 Volts monitor |  |
| _ROLL_ROT | 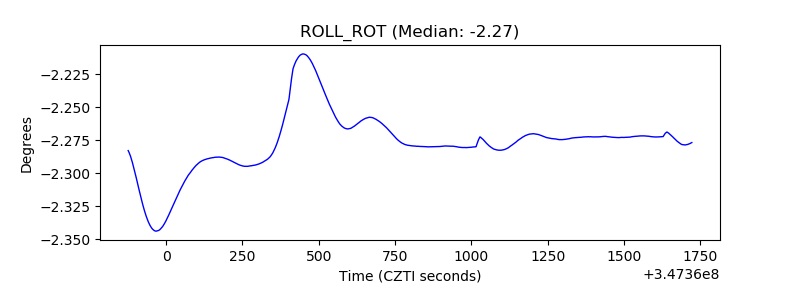 |
| _Roll_DEC | 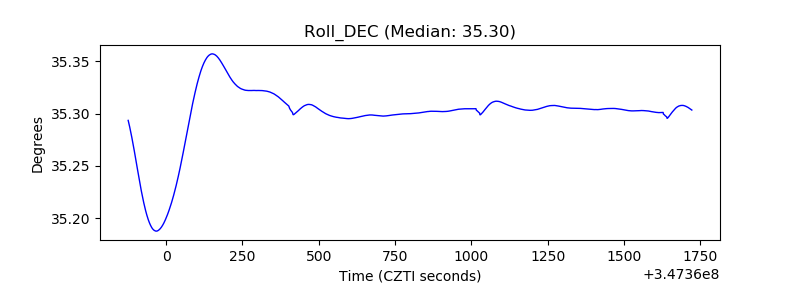 |
| _Roll_RA | 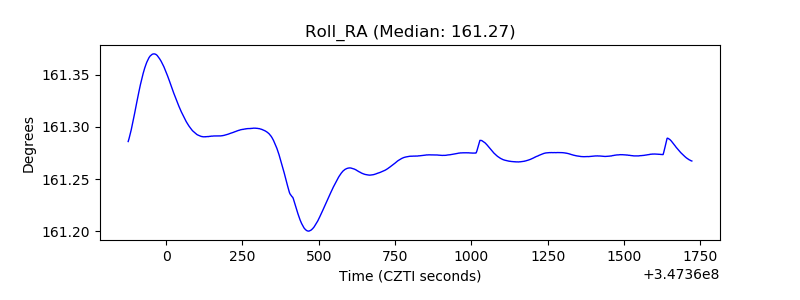 |
| Veto Counter | 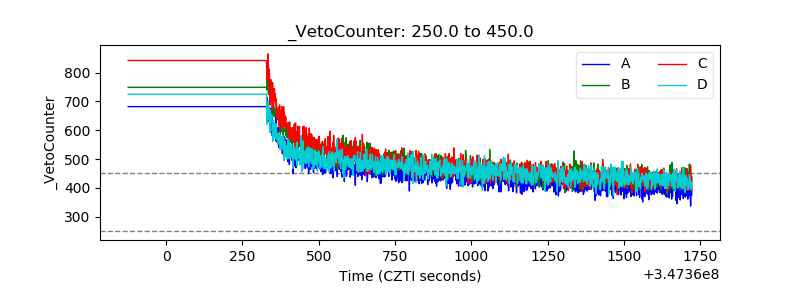 |