| Param | Original file | Final file |
|---|---|---|
| Filename | modeM0/AS1A10_110T04_9000004094_28482cztM0_level2.evt | modeM0/AS1A10_110T04_9000004094_28482cztM0_level2_quad_clean.evt |
| Size (bytes) | 773,686,080 | 76,754,880 |
| Size | 737.8 MB | 73.2 MB |
| Events in quadrant A | 4,424,465 | 473,781 |
| Events in quadrant B | 8,070,380 | 463,087 |
| Events in quadrant C | 3,735,848 | 460,243 |
| Events in quadrant D | 6,737,192 | 448,621 |
| Mode M0 | |||
|---|---|---|---|
| Quadrant | BADHDUFLAG | Total packets | Discarded packets |
| A | 0 | 17412 | 2 |
| B | 0 | 28586 | 2 |
| C | 0 | 15234 | 2 |
| D | 0 | 24704 | 2 |
| Mode SS | |||
|---|---|---|---|
| Quadrant | BADHDUFLAG | Total packets | Discarded packets |
| A | 0 | 140 | 0 |
| B | 0 | 140 | 0 |
| C | 0 | 140 | 0 |
| D | 0 | 140 | 0 |
| Mode M9 | |||
|---|---|---|---|
| Quadrant | BADHDUFLAG | Total packets | Discarded packets |
| A | 0 | 10 | 0 |
| B | 0 | 10 | 0 |
| C | 0 | 10 | 0 |
| D | 0 | 10 | 0 |
| Quadrant | Total seconds | Saturated seconds | Saturation percentage |
|---|---|---|---|
| A | 6856 | 297 | 4.331972% |
| B | 6857 | 1921 | 28.015167% |
| C | 6857 | 205 | 2.989646% |
| D | 6857 | 829 | 12.089835% |
Noise dominated data is calculated using 1-second bins in cleaned event files. If a bin has >2000 counts, and if more than 50% of those come from <1% of pixels, then it is considered to be noise-dominated and hence unusable.
| Quadrant | # 1 sec bins | Bins with >0 counts | Bins with >2000 counts | High rate bins dominated by noise | Noise dominated (total time) | Noise dominated (detector-on time) | Marked lightcurve |
|---|---|---|---|---|---|---|---|
| A | 7881 | 6856 | 214 | 214 | 2.72% | 3.12% | 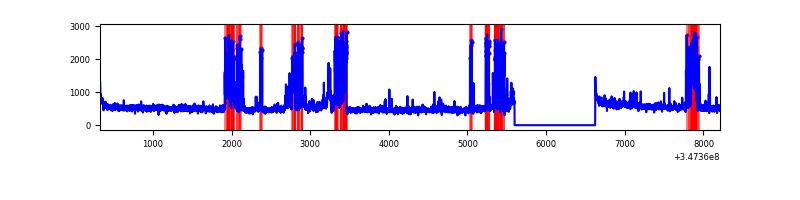 |
| B | 7881 | 6856 | 1649 | 1649 | 20.92% | 24.05% | 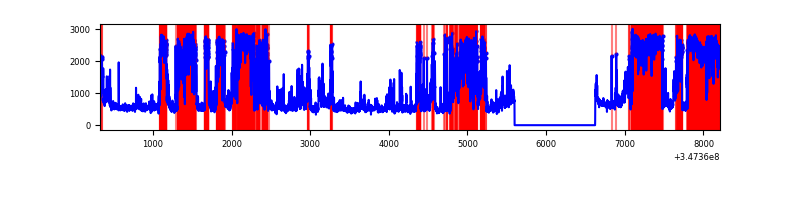 |
| C | 7882 | 6857 | 90 | 90 | 1.14% | 1.31% | 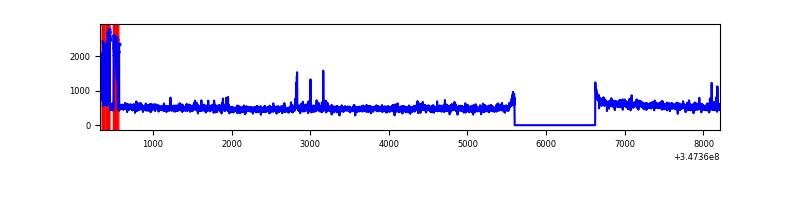 |
| D | 7881 | 6856 | 914 | 914 | 11.60% | 13.33% | 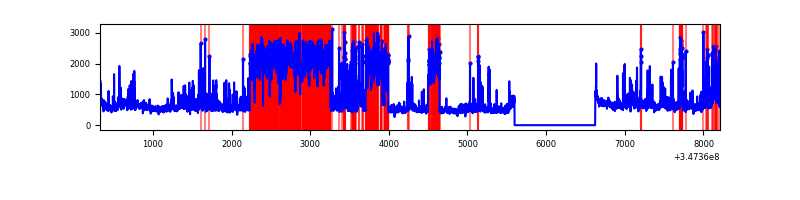 |
Top three noisy pixels from each quadrant. If the there are fewer than three noisy pixels in the level2.evt file, extra rows are filled as -1
| Pixel properties | Quadrant properties | ||||||
|---|---|---|---|---|---|---|---|
| Quadrant | DetID | PixID | Counts | Sigma | Mean | Median | Sigma |
| A | 15 | 174 | 1048552 | 6003.03 | 871 | 852 | 174.5 |
| A | 13 | 254 | 10944 | 57.82 | 871 | 852 | 174.5 |
| A | 1 | 113 | 9136 | 47.47 | 871 | 852 | 174.5 |
| B | 10 | 245 | 5127415 | 36185.29 | 740 | 720 | 141.7 |
| B | 12 | 111 | 17245 | 116.64 | 740 | 720 | 141.7 |
| B | 11 | 111 | 16020 | 107.99 | 740 | 720 | 141.7 |
| C | 7 | 238 | 238502 | 1225.42 | 833 | 839 | 193.9 |
| C | 14 | 238 | 136741 | 700.72 | 833 | 839 | 193.9 |
| C | 7 | 247 | 101210 | 517.52 | 833 | 839 | 193.9 |
| D | 8 | 195 | 2330961 | 11732.53 | 831 | 810 | 198.6 |
| D | 1 | 52 | 733121 | 3687.26 | 831 | 810 | 198.6 |
| D | 2 | 250 | 163662 | 819.98 | 831 | 810 | 198.6 |
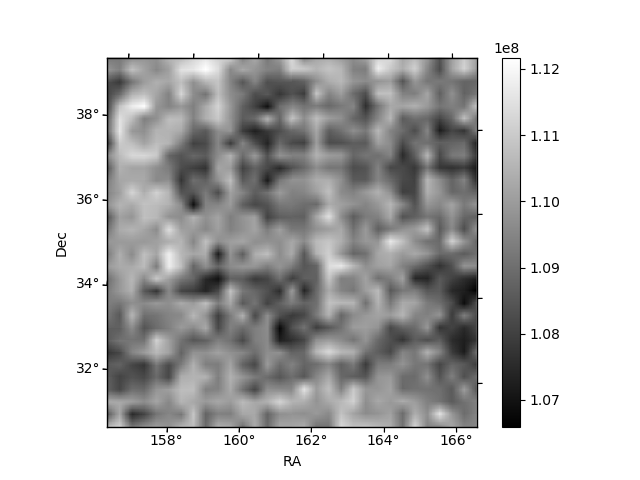
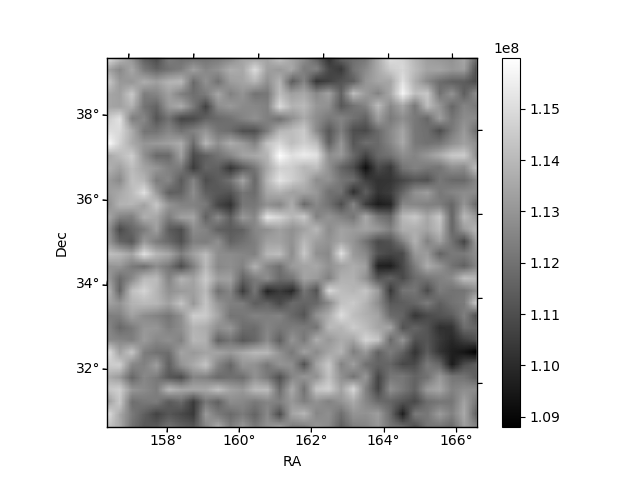
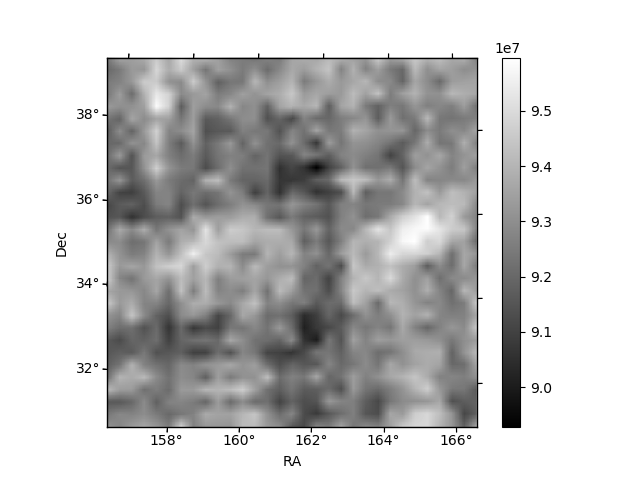
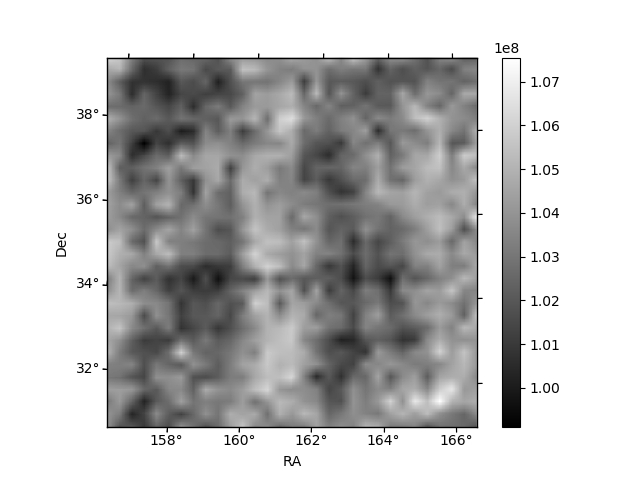
Histogram calculated using DETX and DETY for each event in the final _common_clean file
| Quadrant A | 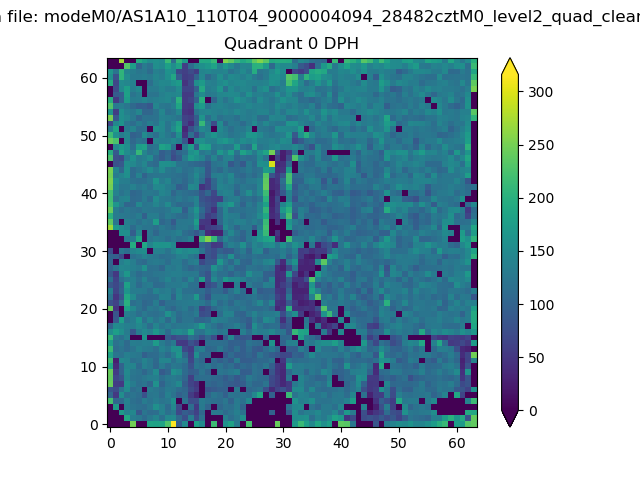 |
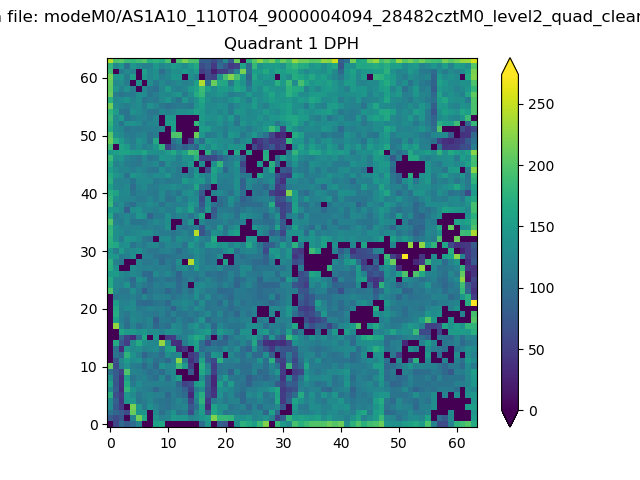 |
Quadrant B |
|---|---|---|---|
| Quadrant D | 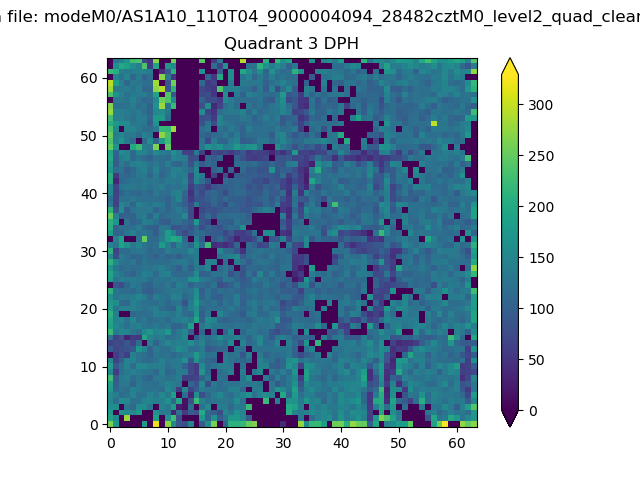 |
 |
Quadrant C |
| Plot type | Count rate plots | Images |
|---|---|---|
| Comparison with Poisson distribution Blue bars denote a histogram of data divided into 1 sec bins. Red curve is a Poisson curve with rate = median count rate of data. |
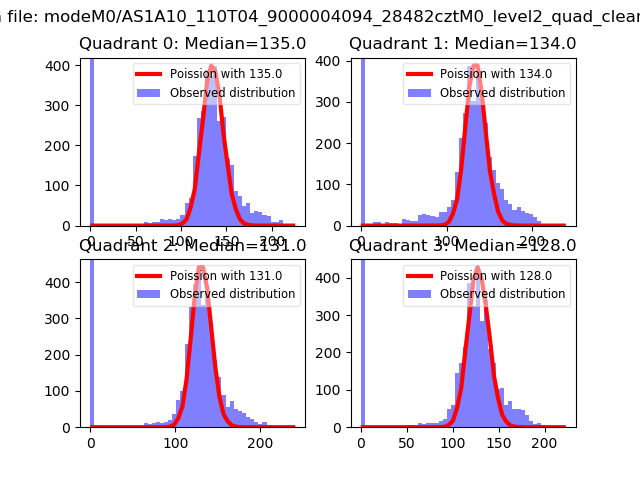 |
 |
| Quadrant-wise count rates Data is divided into 100 sec bins |
 |
|
| Module-wise count rates for Quadrant A Data is divided into 100 sec bins |
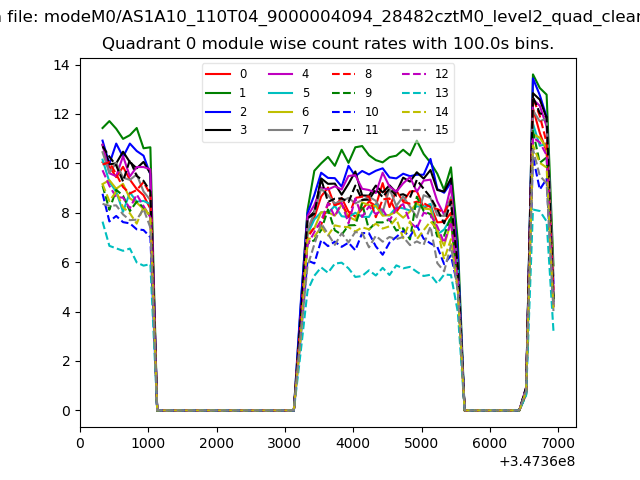 |
 |
| Module-wise count rates for Quadrant B Data is divided into 100 sec bins |
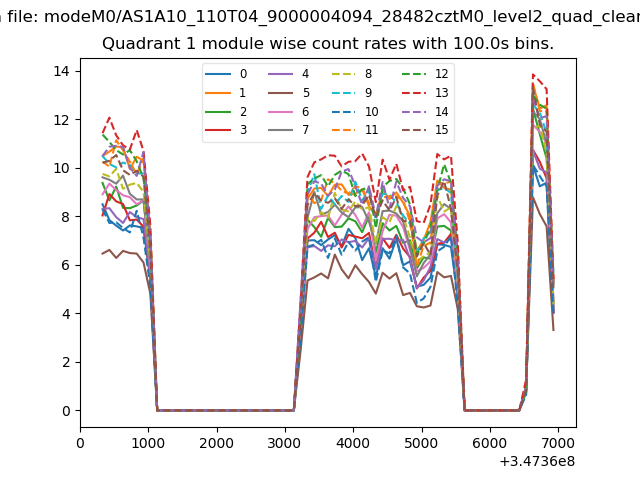 |
 |
| Module-wise count rates for Quadrant C Data is divided into 100 sec bins |
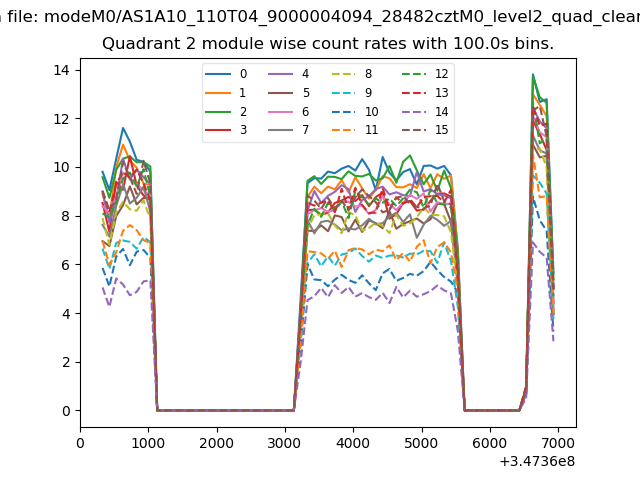 |
 |
| Module-wise count rates for Quadrant D Data is divided into 100 sec bins |
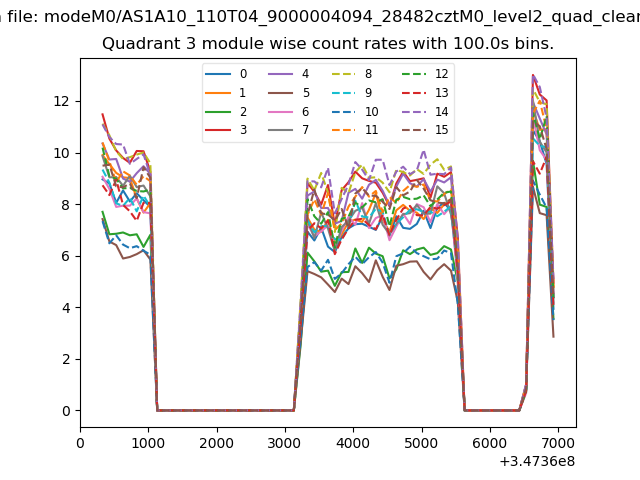 |
 |
| Parameter | Plot |
|---|---|
| CZT HV Monitor | 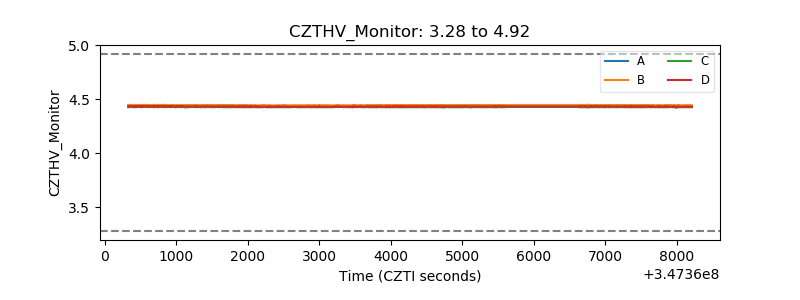 |
| D_VDD | 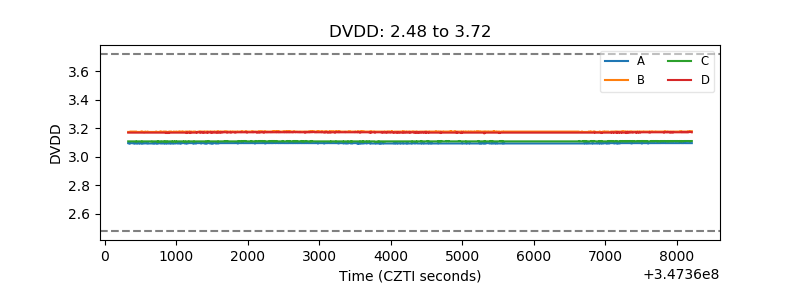 |
| Temperature 1 | 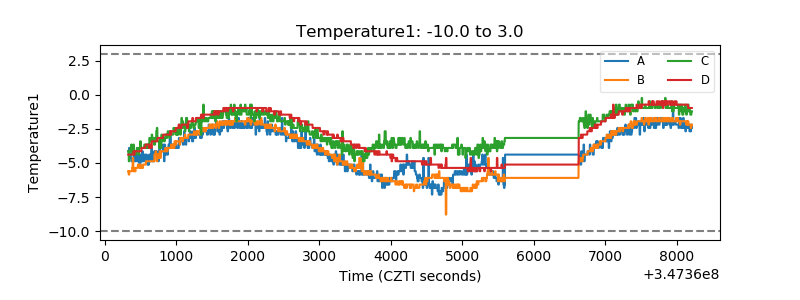 |
| Veto HV Monitor | 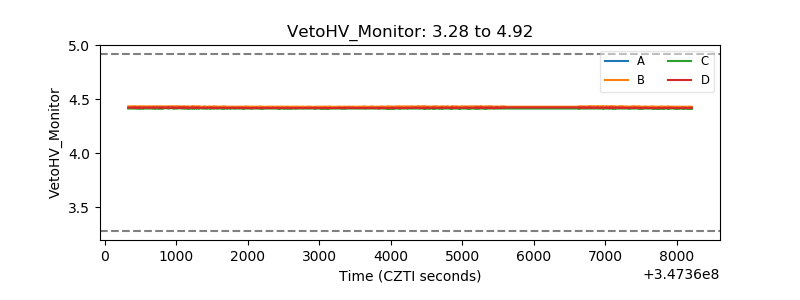 |
| Veto LLD | 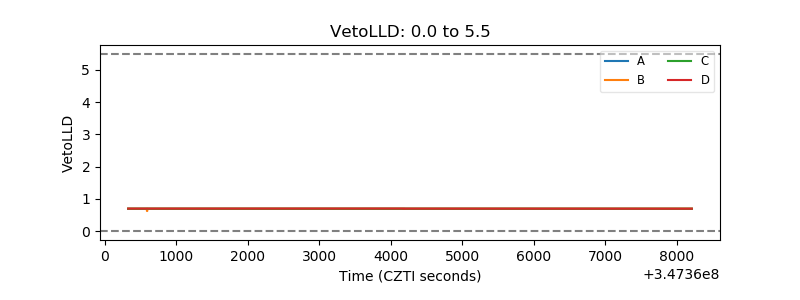 |
| Alpha Counter |  |
| _CPM_Rate | 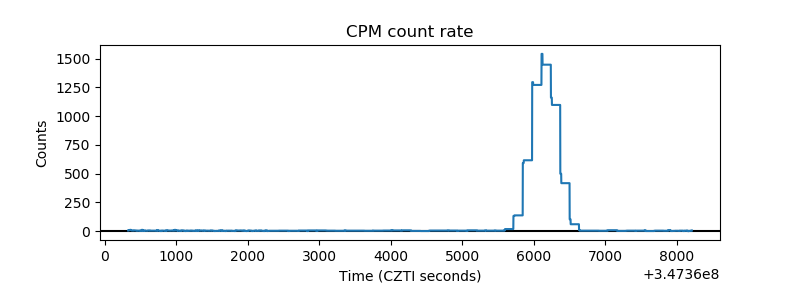 |
| CZT Counter |  |
| +2.5 Volts monitor |  |
| +5 Volts monitor |  |
| _ROLL_ROT | 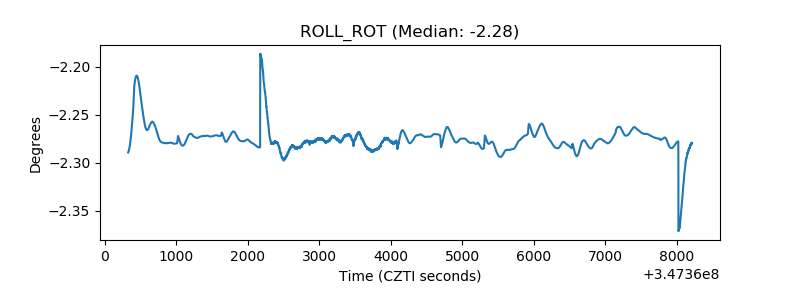 |
| _Roll_DEC | 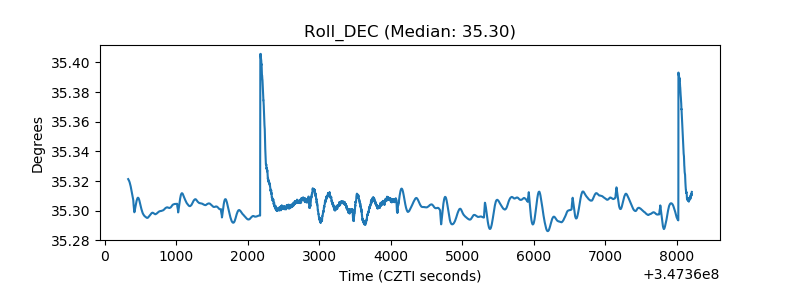 |
| _Roll_RA |  |
| Veto Counter | 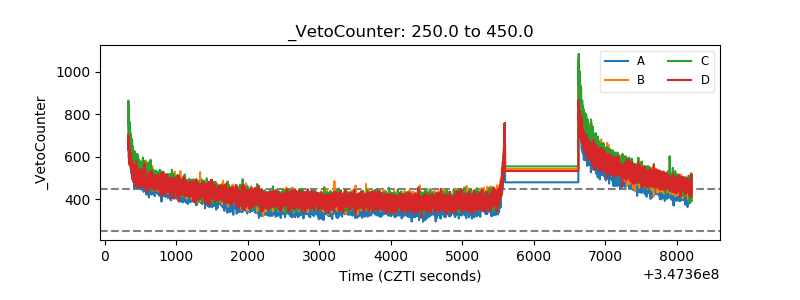 |