| Param | Original file | Final file |
|---|---|---|
| Filename | modeM0/AS1A10_110T04_9000004094_28484cztM0_level2.evt | modeM0/AS1A10_110T04_9000004094_28484cztM0_level2_quad_clean.evt |
| Size (bytes) | 701,167,680 | 66,530,880 |
| Size | 668.7 MB | 63.4 MB |
| Events in quadrant A | 3,993,305 | 400,063 |
| Events in quadrant B | 8,306,839 | 385,565 |
| Events in quadrant C | 3,609,870 | 388,217 |
| Events in quadrant D | 4,879,476 | 381,042 |
| Mode M0 | |||
|---|---|---|---|
| Quadrant | BADHDUFLAG | Total packets | Discarded packets |
| A | 0 | 16241 | 1 |
| B | 0 | 29193 | 1 |
| C | 0 | 14811 | 1 |
| D | 0 | 19127 | 1 |
| Mode SS | |||
|---|---|---|---|
| Quadrant | BADHDUFLAG | Total packets | Discarded packets |
| A | 0 | 132 | 0 |
| B | 0 | 132 | 0 |
| C | 0 | 132 | 0 |
| D | 0 | 132 | 0 |
| Mode M9 | |||
|---|---|---|---|
| Quadrant | BADHDUFLAG | Total packets | Discarded packets |
| A | 0 | 12 | 0 |
| B | 0 | 12 | 0 |
| C | 0 | 12 | 0 |
| D | 0 | 12 | 0 |
| Quadrant | Total seconds | Saturated seconds | Saturation percentage |
|---|---|---|---|
| A | 6592 | 218 | 3.307039% |
| B | 6592 | 2098 | 31.826456% |
| C | 6592 | 123 | 1.865898% |
| D | 6592 | 293 | 4.444782% |
Noise dominated data is calculated using 1-second bins in cleaned event files. If a bin has >2000 counts, and if more than 50% of those come from <1% of pixels, then it is considered to be noise-dominated and hence unusable.
| Quadrant | # 1 sec bins | Bins with >0 counts | Bins with >2000 counts | High rate bins dominated by noise | Noise dominated (total time) | Noise dominated (detector-on time) | Marked lightcurve |
|---|---|---|---|---|---|---|---|
| A | 7742 | 6592 | 135 | 135 | 1.74% | 2.05% | 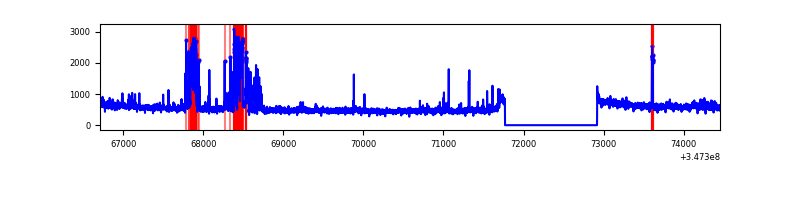 |
| B | 7742 | 6592 | 1732 | 1732 | 22.37% | 26.27% | 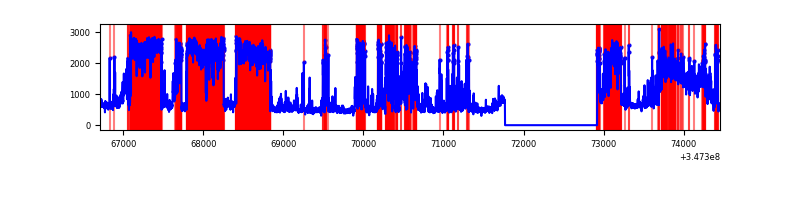 |
| C | 7742 | 6592 | 0 | 0 | 0.00% | 0.00% | 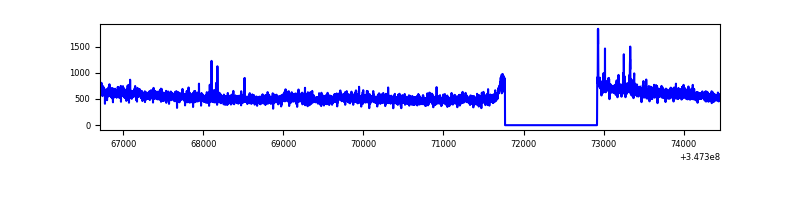 |
| D | 7741 | 6591 | 181 | 181 | 2.34% | 2.75% | 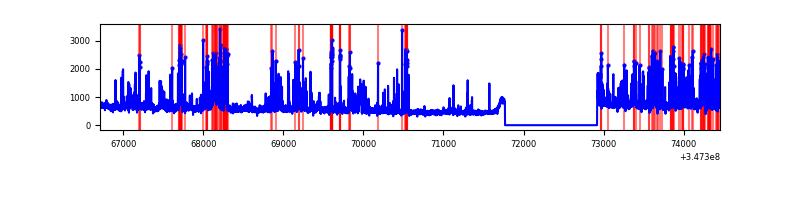 |
Top three noisy pixels from each quadrant. If the there are fewer than three noisy pixels in the level2.evt file, extra rows are filled as -1
| Pixel properties | Quadrant properties | ||||||
|---|---|---|---|---|---|---|---|
| Quadrant | DetID | PixID | Counts | Sigma | Mean | Median | Sigma |
| A | 15 | 174 | 586053 | 3355.65 | 880 | 865 | 174.4 |
| A | 13 | 254 | 11247 | 59.53 | 880 | 865 | 174.4 |
| A | 3 | 137 | 8241 | 42.3 | 880 | 865 | 174.4 |
| B | 10 | 245 | 5438651 | 40535.81 | 716 | 699 | 134.2 |
| B | 10 | 246 | 32037 | 233.6 | 716 | 699 | 134.2 |
| B | 12 | 111 | 16310 | 116.37 | 716 | 699 | 134.2 |
| C | 14 | 238 | 140688 | 705.72 | 853 | 860 | 198.1 |
| C | 7 | 247 | 107991 | 540.7 | 853 | 860 | 198.1 |
| C | 3 | 233 | 39061 | 192.8 | 853 | 860 | 198.1 |
| D | 1 | 52 | 823031 | 4054.45 | 856 | 836 | 202.8 |
| D | 8 | 195 | 296339 | 1457.2 | 856 | 836 | 202.8 |
| D | 2 | 250 | 196905 | 966.86 | 856 | 836 | 202.8 |
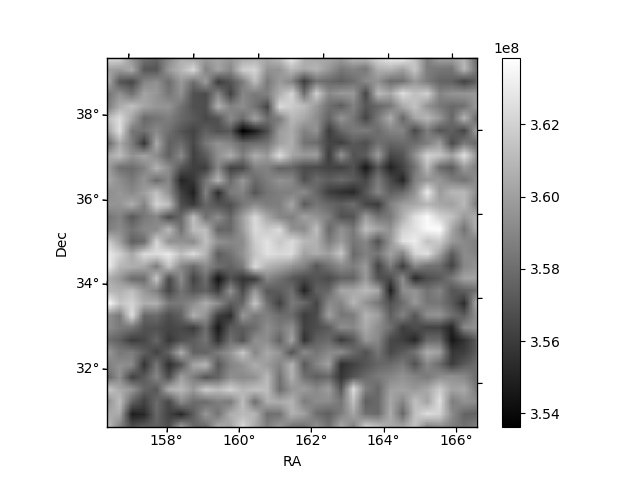
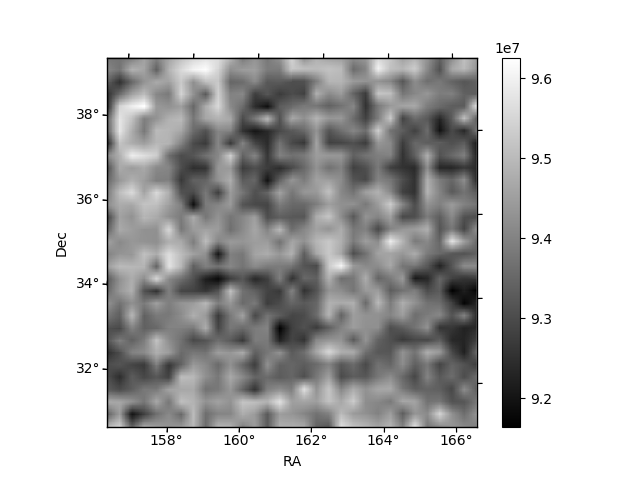
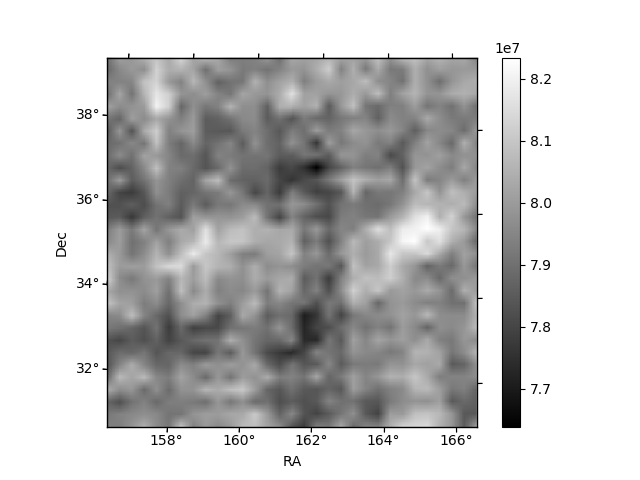
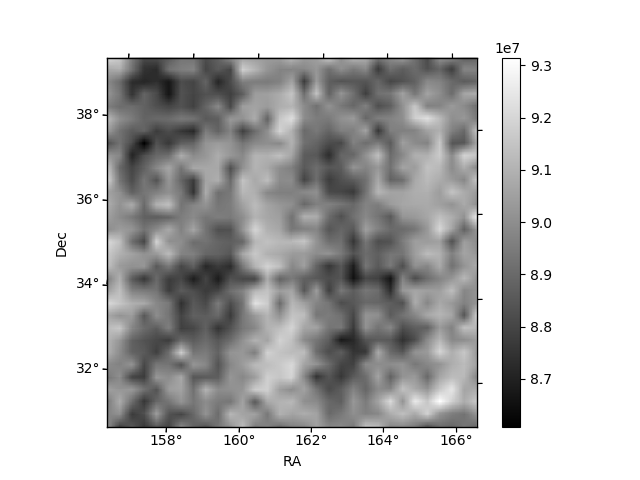
Histogram calculated using DETX and DETY for each event in the final _common_clean file
| Quadrant A |  |
 |
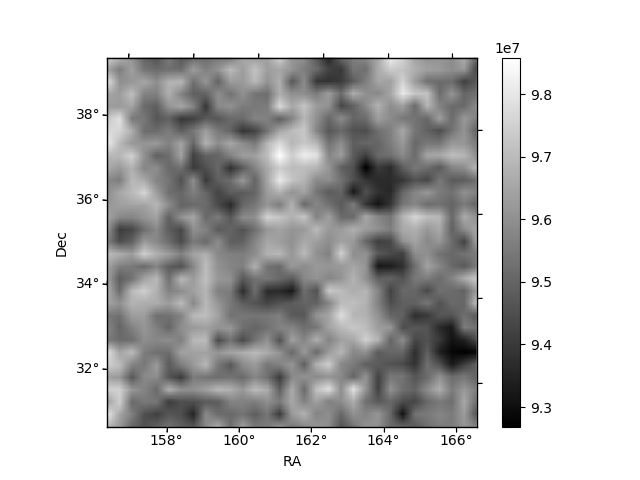
Quadrant B |
|---|---|---|---|
| Quadrant D |  |
 |
Quadrant C |
| Plot type | Count rate plots | Images |
|---|---|---|
| Comparison with Poisson distribution Blue bars denote a histogram of data divided into 1 sec bins. Red curve is a Poisson curve with rate = median count rate of data. |
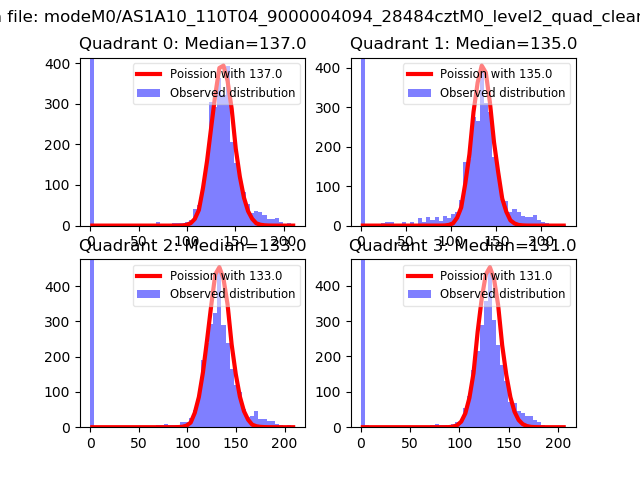 |
 |
| Quadrant-wise count rates Data is divided into 100 sec bins |
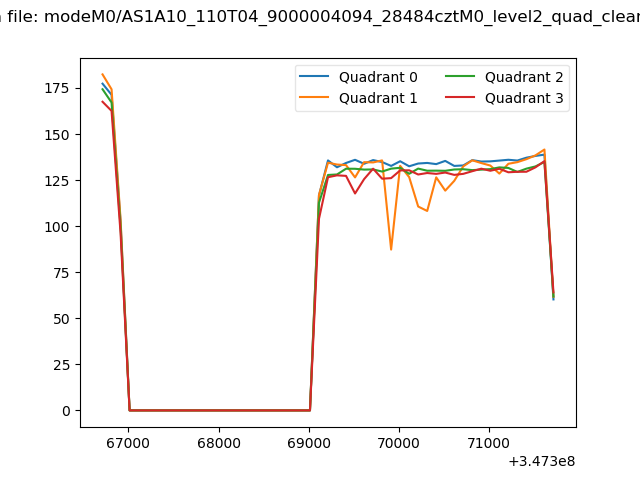 |
|
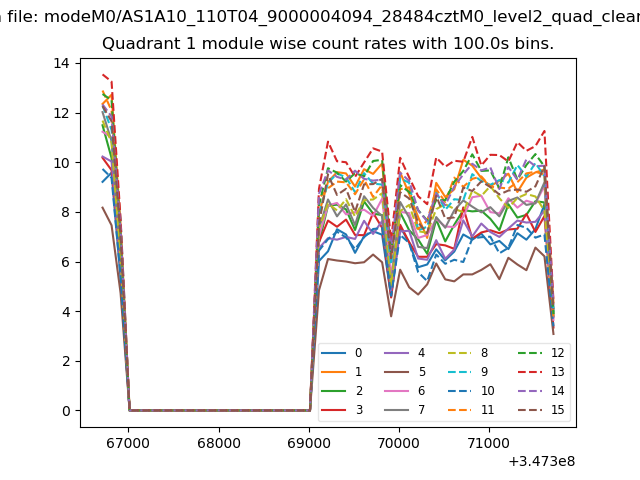
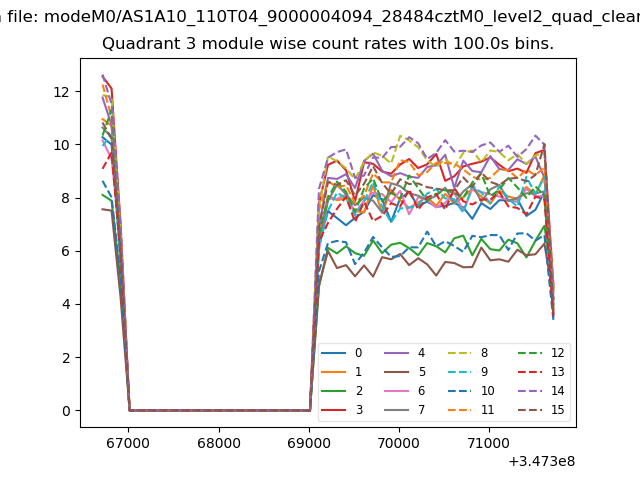
| Module-wise count rates for Quadrant A Data is divided into 100 sec bins |
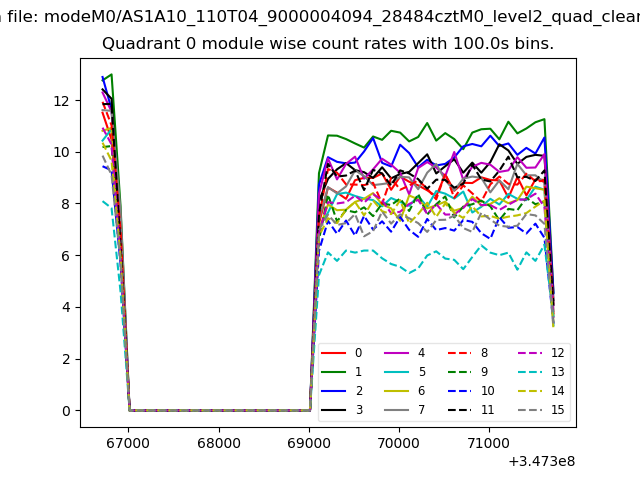 |
 |
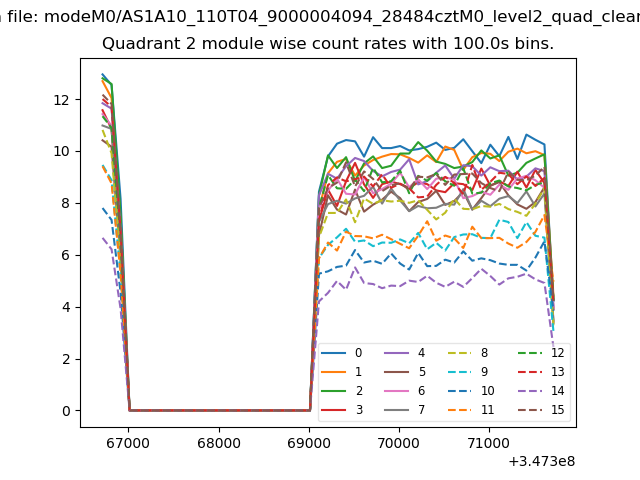
| Module-wise count rates for Quadrant B Data is divided into 100 sec bins |
 |
 |
| Module-wise count rates for Quadrant C Data is divided into 100 sec bins |
 |
 |
| Module-wise count rates for Quadrant D Data is divided into 100 sec bins |
 |
 |
| Parameter | Plot |
|---|---|
| CZT HV Monitor | 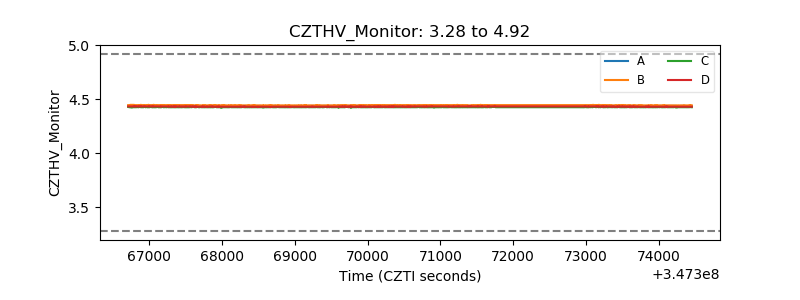 |
| D_VDD | 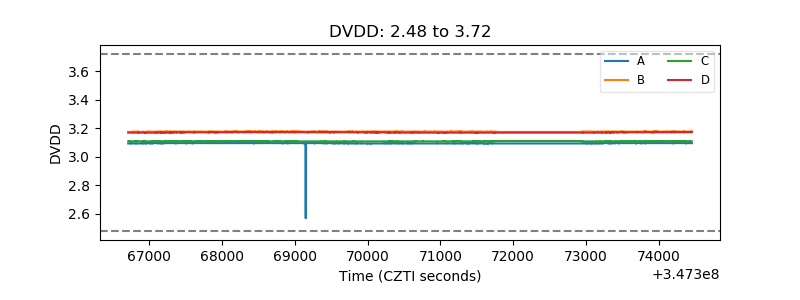 |
| Temperature 1 | 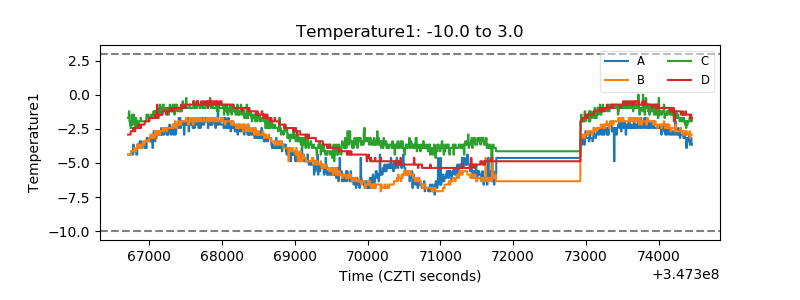 |
| Veto HV Monitor |  |
| Veto LLD | 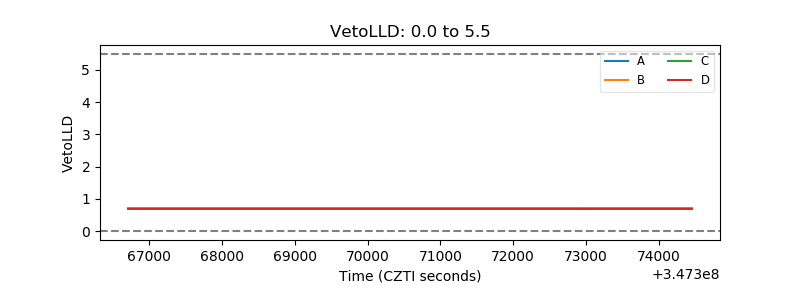 |
| Alpha Counter | 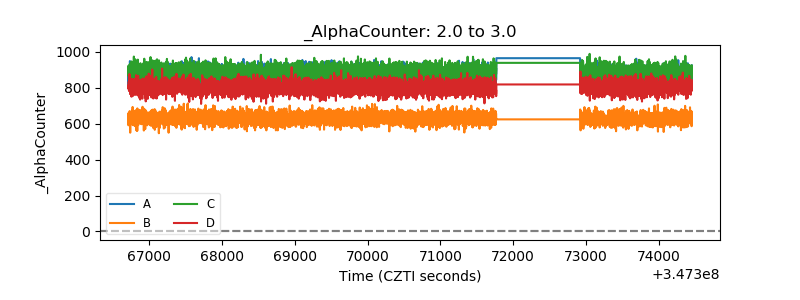 |
| _CPM_Rate | 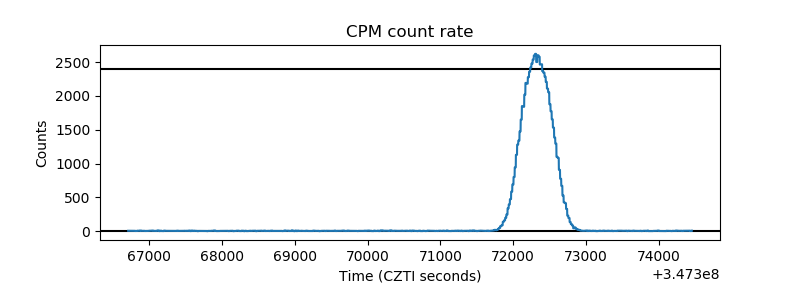 |
| CZT Counter | 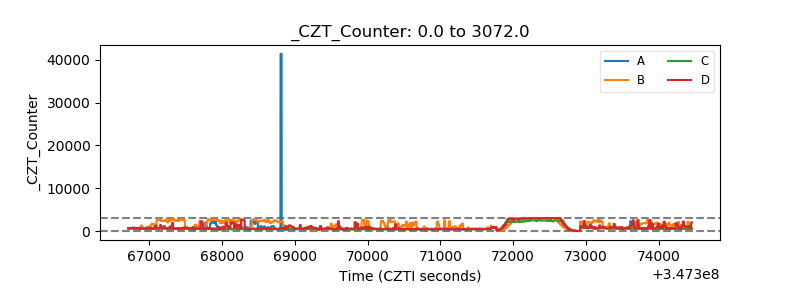 |
| +2.5 Volts monitor |  |
| +5 Volts monitor |  |
| _ROLL_ROT | 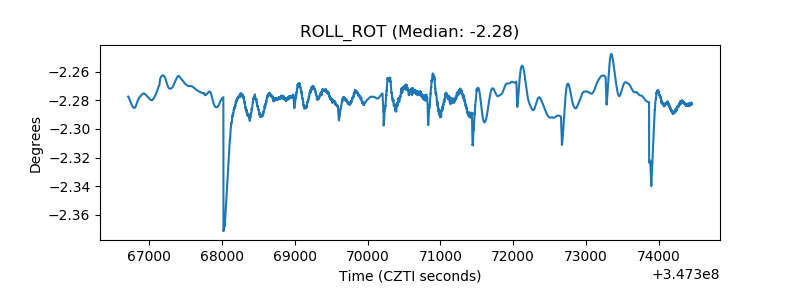 |
| _Roll_DEC | 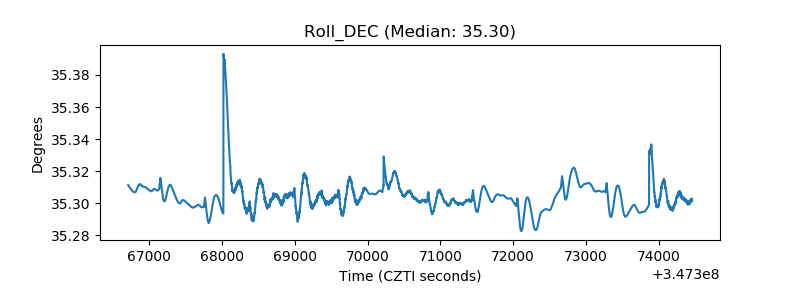 |
| _Roll_RA | 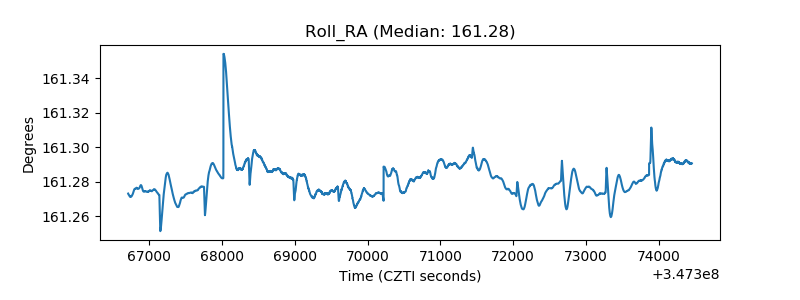 |
| Veto Counter | 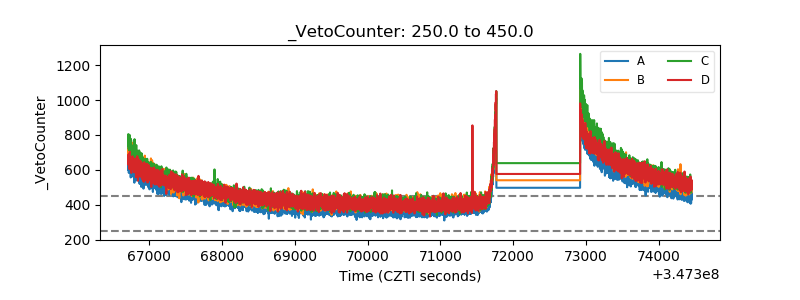 |