| Param | Original file | Final file |
|---|---|---|
| Filename | modeM0/AS1A10_110T04_9000004094_28485cztM0_level2.evt | modeM0/AS1A10_110T04_9000004094_28485cztM0_level2_quad_clean.evt |
| Size (bytes) | 692,680,320 | 68,264,640 |
| Size | 660.6 MB | 65.1 MB |
| Events in quadrant A | 3,938,336 | 417,644 |
| Events in quadrant B | 6,322,724 | 402,575 |
| Events in quadrant C | 3,669,097 | 407,445 |
| Events in quadrant D | 6,613,294 | 390,259 |
| Mode M0 | |||
|---|---|---|---|
| Quadrant | BADHDUFLAG | Total packets | Discarded packets |
| A | 0 | 16180 | 2 |
| B | 0 | 23168 | 2 |
| C | 0 | 15198 | 2 |
| D | 0 | 24203 | 2 |
| Mode SS | |||
|---|---|---|---|
| Quadrant | BADHDUFLAG | Total packets | Discarded packets |
| A | 0 | 130 | 0 |
| B | 0 | 130 | 0 |
| C | 0 | 130 | 0 |
| D | 0 | 130 | 0 |
| Mode M9 | |||
|---|---|---|---|
| Quadrant | BADHDUFLAG | Total packets | Discarded packets |
| A | 0 | 17 | 0 |
| B | 0 | 18 | 0 |
| C | 0 | 18 | 0 |
| D | 0 | 18 | 0 |
| Quadrant | Total seconds | Saturated seconds | Saturation percentage |
|---|---|---|---|
| A | 6436 | 173 | 2.688005% |
| B | 6436 | 888 | 13.797390% |
| C | 6436 | 127 | 1.973275% |
| D | 6436 | 828 | 12.865134% |
Noise dominated data is calculated using 1-second bins in cleaned event files. If a bin has >2000 counts, and if more than 50% of those come from <1% of pixels, then it is considered to be noise-dominated and hence unusable.
| Quadrant | # 1 sec bins | Bins with >0 counts | Bins with >2000 counts | High rate bins dominated by noise | Noise dominated (total time) | Noise dominated (detector-on time) | Marked lightcurve |
|---|---|---|---|---|---|---|---|
| A | 7711 | 6436 | 65 | 65 | 0.84% | 1.01% | 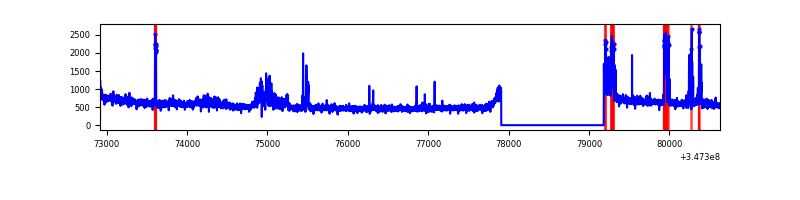 |
| B | 7711 | 6436 | 555 | 555 | 7.20% | 8.62% | 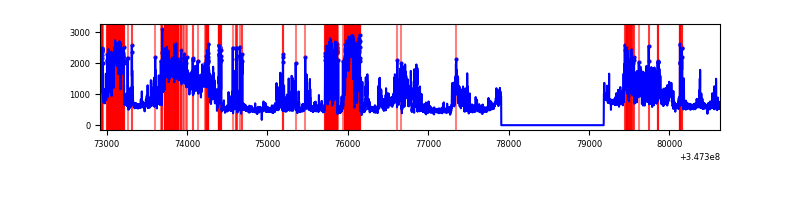 |
| C | 7711 | 6436 | 0 | 0 | 0.00% | 0.00% | 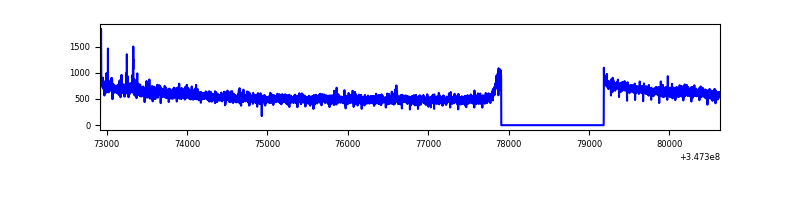 |
| D | 7710 | 6435 | 783 | 783 | 10.16% | 12.17% | 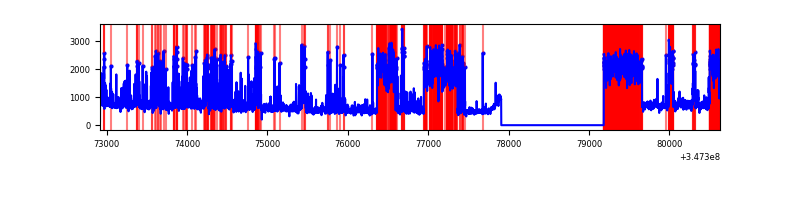 |
Top three noisy pixels from each quadrant. If the there are fewer than three noisy pixels in the level2.evt file, extra rows are filled as -1
| Pixel properties | Quadrant properties | ||||||
|---|---|---|---|---|---|---|---|
| Quadrant | DetID | PixID | Counts | Sigma | Mean | Median | Sigma |
| A | 15 | 174 | 429139 | 2406.96 | 907 | 894 | 177.9 |
| A | 13 | 254 | 11083 | 57.27 | 907 | 894 | 177.9 |
| A | 3 | 137 | 8129 | 40.66 | 907 | 894 | 177.9 |
| B | 10 | 245 | 2275670 | 14232.28 | 860 | 842 | 159.8 |
| B | 10 | 246 | 653564 | 4083.7 | 860 | 842 | 159.8 |
| B | 12 | 111 | 18417 | 109.96 | 860 | 842 | 159.8 |
| C | 14 | 238 | 145656 | 711.26 | 884 | 893 | 203.5 |
| C | 7 | 247 | 59439 | 287.65 | 884 | 893 | 203.5 |
| C | 3 | 233 | 21470 | 101.1 | 884 | 893 | 203.5 |
| D | 8 | 195 | 2136521 | 10332.37 | 868 | 847 | 206.7 |
| D | 1 | 52 | 873085 | 4219.88 | 868 | 847 | 206.7 |
| D | 12 | 233 | 153221 | 737.18 | 868 | 847 | 206.7 |
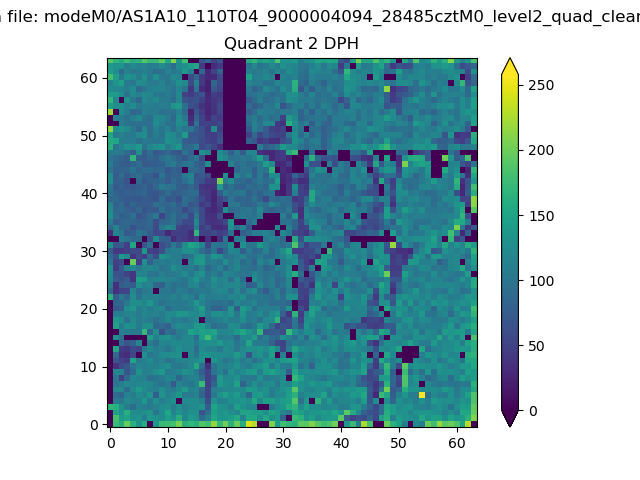
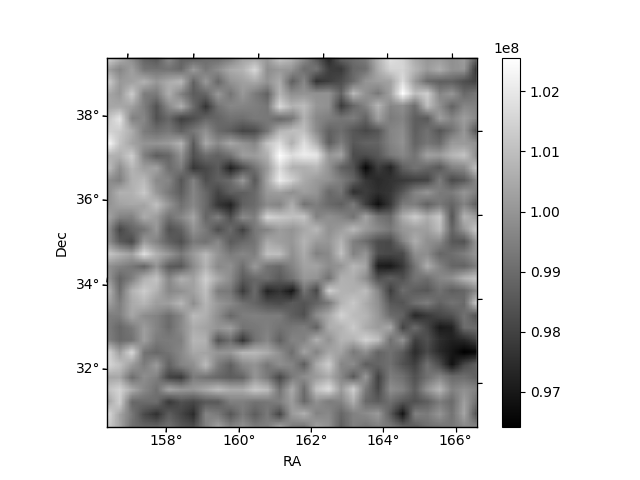
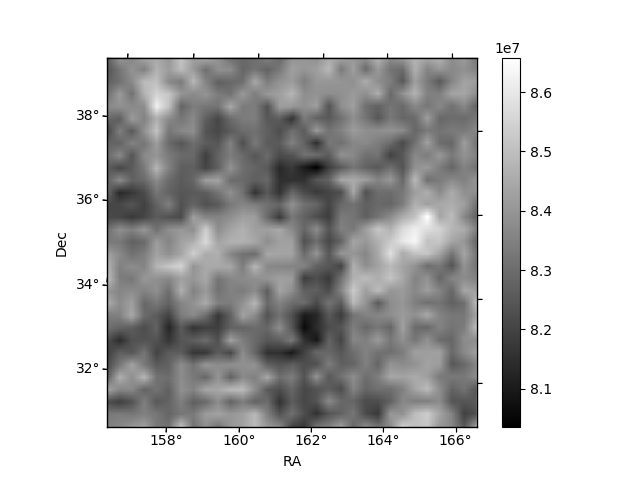
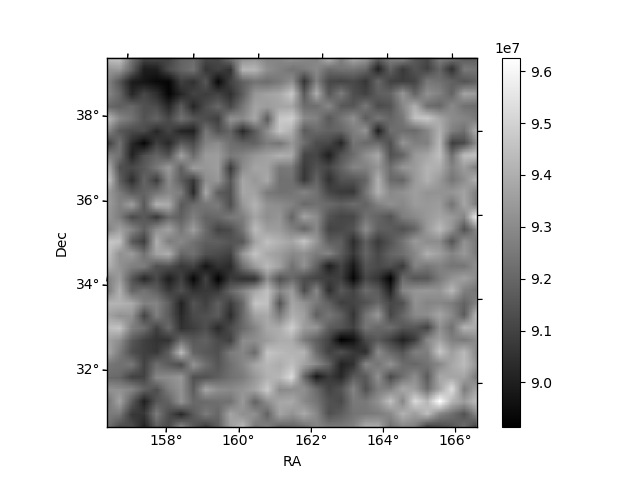
Histogram calculated using DETX and DETY for each event in the final _common_clean file
| Quadrant A | 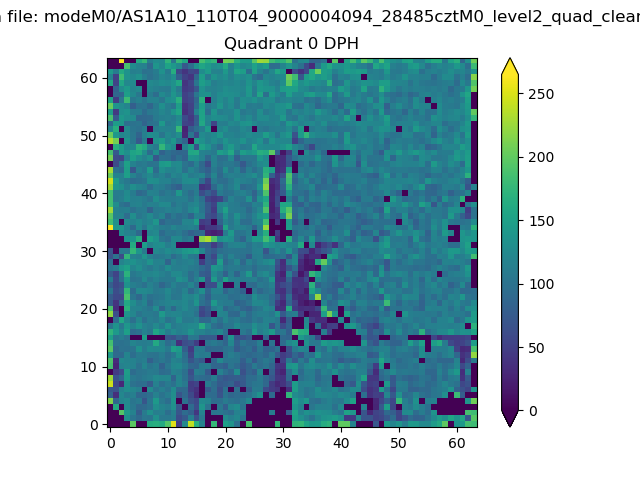 |
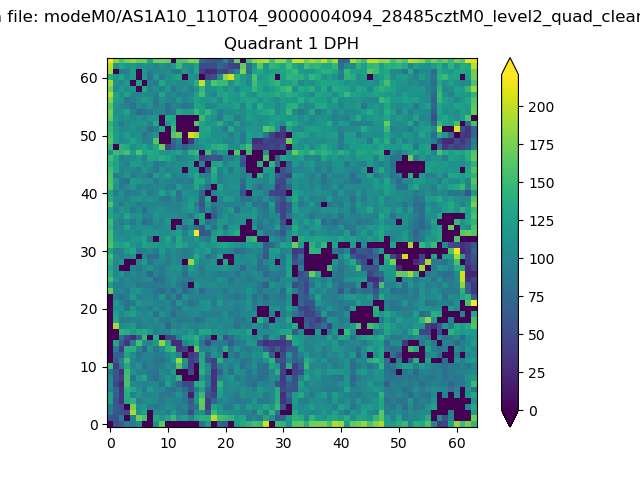 |
Quadrant B |
|---|---|---|---|
| Quadrant D | 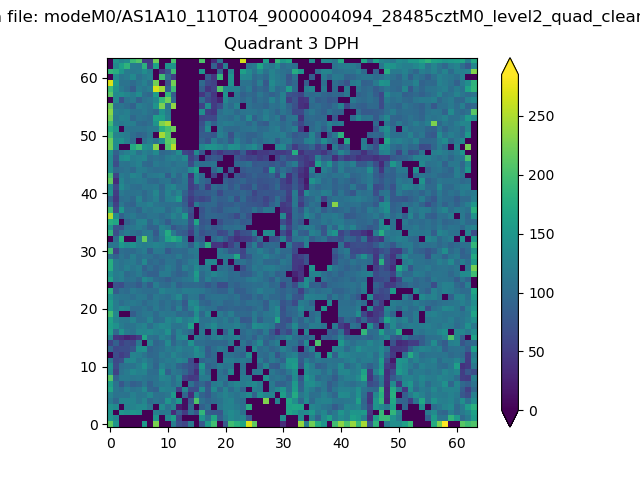 |
 |
Quadrant C |
| Plot type | Count rate plots | Images |
|---|---|---|
| Comparison with Poisson distribution Blue bars denote a histogram of data divided into 1 sec bins. Red curve is a Poisson curve with rate = median count rate of data. |
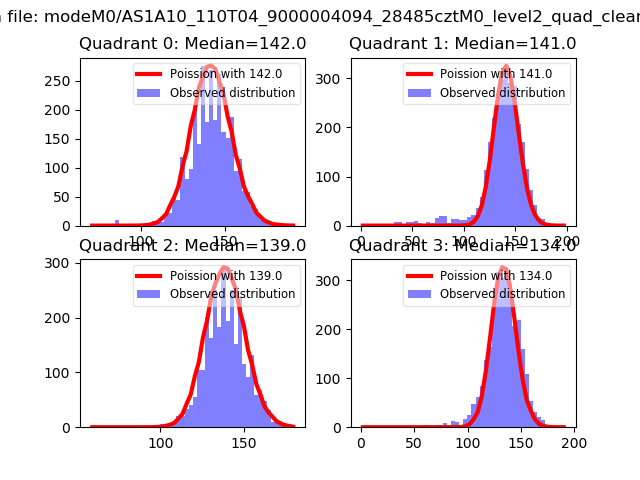 |
 |
| Quadrant-wise count rates Data is divided into 100 sec bins |
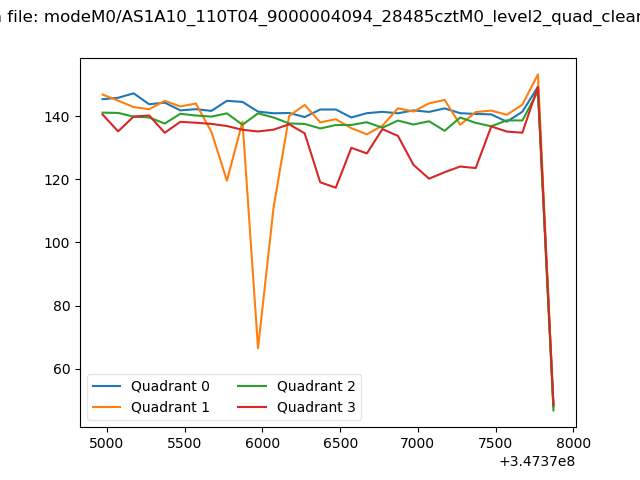 |
|
| Module-wise count rates for Quadrant A Data is divided into 100 sec bins |
 |
 |
| Module-wise count rates for Quadrant B Data is divided into 100 sec bins |
 |
 |
| Module-wise count rates for Quadrant C Data is divided into 100 sec bins |
 |
 |
| Module-wise count rates for Quadrant D Data is divided into 100 sec bins |
 |
 |
| Parameter | Plot |
|---|---|
| CZT HV Monitor |  |
| D_VDD | 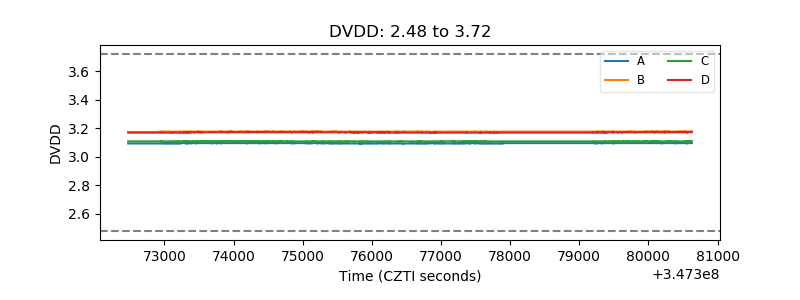 |
| Temperature 1 | 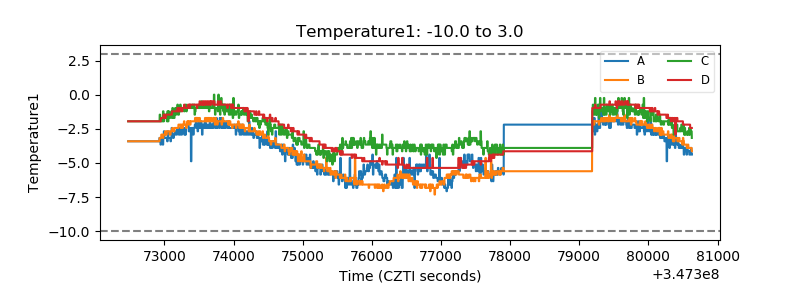 |
| Veto HV Monitor | 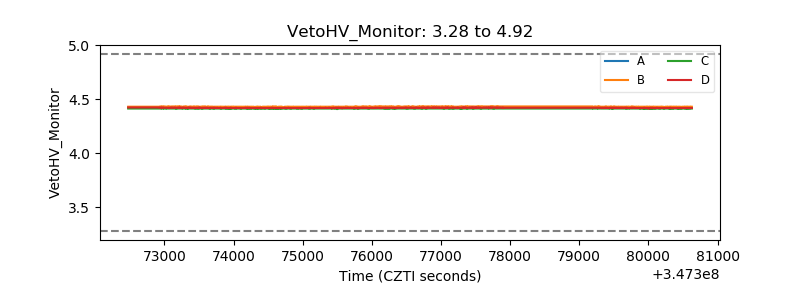 |
| Veto LLD | 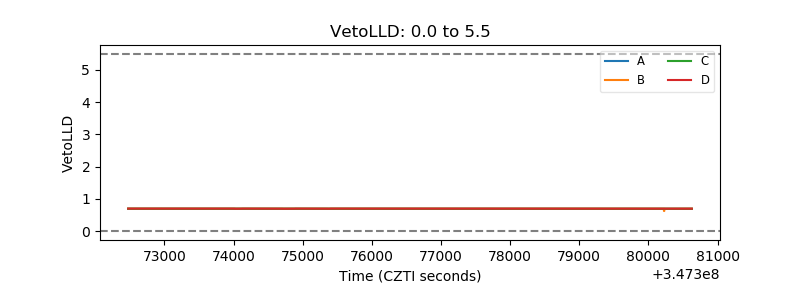 |
| Alpha Counter | 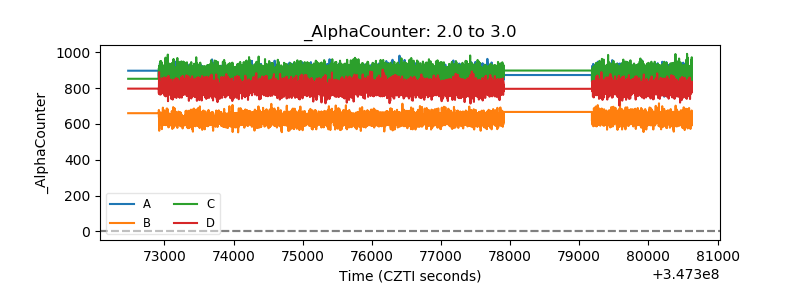 |
| _CPM_Rate | 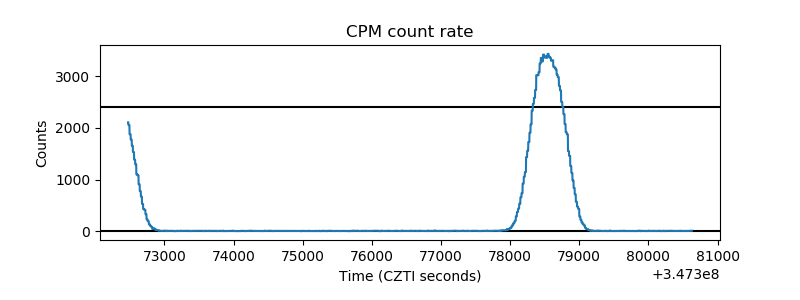 |
| CZT Counter |  |
| +2.5 Volts monitor |  |
| +5 Volts monitor |  |
| _ROLL_ROT |  |
| _Roll_DEC | 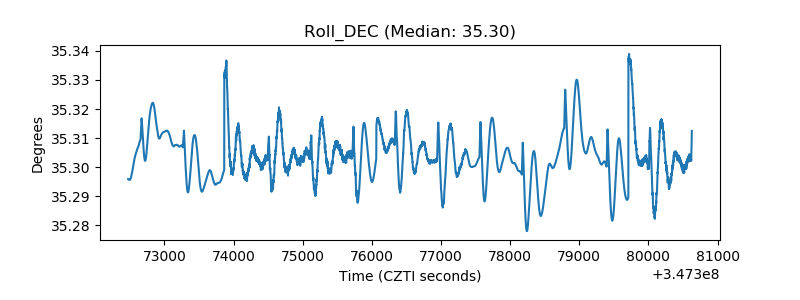 |
| _Roll_RA | 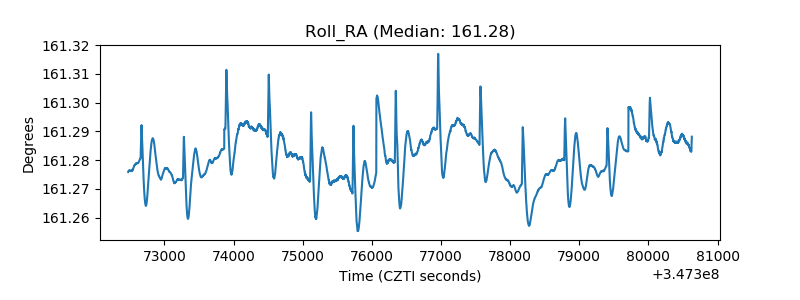 |
| Veto Counter |  |