| Param | Original file | Final file |
|---|---|---|
| Filename | modeM0/AS1A10_110T04_9000004094_28488cztM0_level2.evt | modeM0/AS1A10_110T04_9000004094_28488cztM0_level2_quad_clean.evt |
| Size (bytes) | 572,028,480 | 99,158,400 |
| Size | 545.5 MB | 94.6 MB |
| Events in quadrant A | 3,108,007 | 662,497 |
| Events in quadrant B | 4,272,479 | 671,347 |
| Events in quadrant C | 3,274,157 | 659,370 |
| Events in quadrant D | 6,260,290 | 588,154 |
| Mode M0 | |||
|---|---|---|---|
| Quadrant | BADHDUFLAG | Total packets | Discarded packets |
| A | 0 | 13000 | 1 |
| B | 0 | 16630 | 1 |
| C | 0 | 13550 | 1 |
| D | 0 | 22706 | 3 |
| Mode SS | |||
|---|---|---|---|
| Quadrant | BADHDUFLAG | Total packets | Discarded packets |
| A | 0 | 122 | 0 |
| B | 0 | 122 | 0 |
| C | 0 | 122 | 0 |
| D | 0 | 122 | 0 |
| Mode M9 | |||
|---|---|---|---|
| Quadrant | BADHDUFLAG | Total packets | Discarded packets |
| A | 0 | 13 | 0 |
| B | 0 | 13 | 0 |
| C | 0 | 13 | 0 |
| D | 0 | 13 | 0 |
| Quadrant | Total seconds | Saturated seconds | Saturation percentage |
|---|---|---|---|
| A | 6035 | 46 | 0.762220% |
| B | 6035 | 492 | 8.152444% |
| C | 6036 | 132 | 2.186879% |
| D | 6035 | 1058 | 17.531069% |
Noise dominated data is calculated using 1-second bins in cleaned event files. If a bin has >2000 counts, and if more than 50% of those come from <1% of pixels, then it is considered to be noise-dominated and hence unusable.
| Quadrant | # 1 sec bins | Bins with >0 counts | Bins with >2000 counts | High rate bins dominated by noise | Noise dominated (total time) | Noise dominated (detector-on time) | Marked lightcurve |
|---|---|---|---|---|---|---|---|
| A | 7295 | 6036 | 0 | 0 | 0.00% | 0.00% | 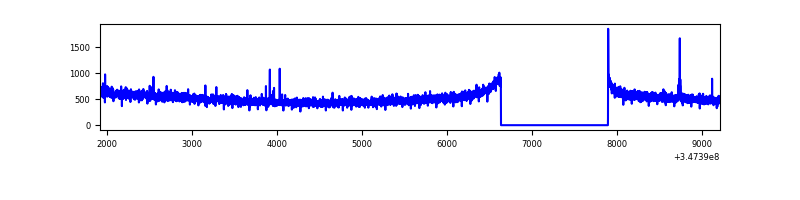 |
| B | 7295 | 6035 | 278 | 278 | 3.81% | 4.61% | 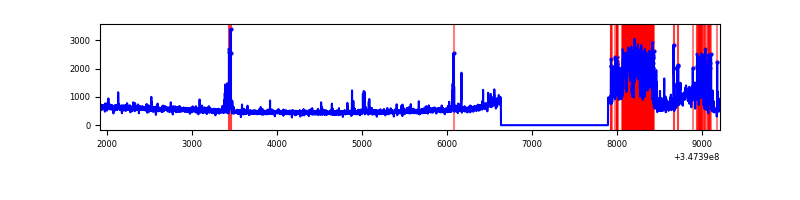 |
| C | 7296 | 6036 | 2 | 2 | 0.03% | 0.03% | 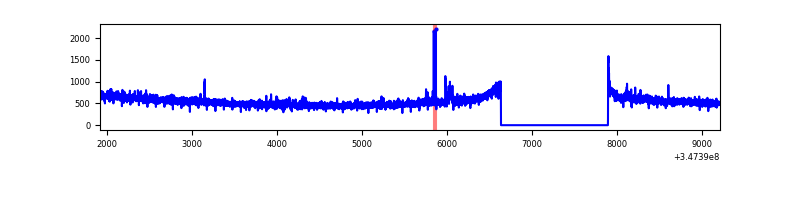 |
| D | 7295 | 6035 | 884 | 884 | 12.12% | 14.65% | 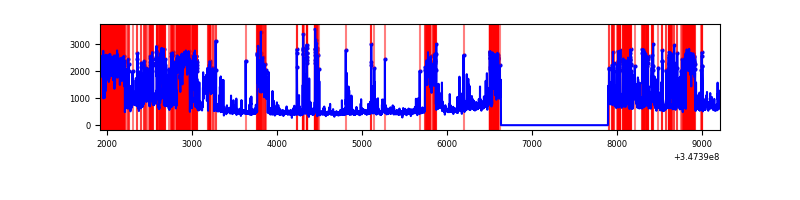 |
Top three noisy pixels from each quadrant. If the there are fewer than three noisy pixels in the level2.evt file, extra rows are filled as -1
| Pixel properties | Quadrant properties | ||||||
|---|---|---|---|---|---|---|---|
| Quadrant | DetID | PixID | Counts | Sigma | Mean | Median | Sigma |
| A | 15 | 174 | 12008 | 70.49 | 799 | 783 | 159.3 |
| A | 13 | 254 | 10457 | 60.75 | 799 | 783 | 159.3 |
| A | 1 | 113 | 8107 | 45.99 | 799 | 783 | 159.3 |
| B | 10 | 245 | 1150524 | 7833.17 | 781 | 764 | 146.8 |
| B | 0 | 230 | 31792 | 211.39 | 781 | 764 | 146.8 |
| B | 12 | 111 | 17613 | 114.79 | 781 | 764 | 146.8 |
| C | 14 | 238 | 126234 | 688.41 | 786 | 792 | 182.2 |
| C | 7 | 247 | 42805 | 230.56 | 786 | 792 | 182.2 |
| C | 3 | 233 | 26649 | 141.9 | 786 | 792 | 182.2 |
| D | 1 | 52 | 2227861 | 12942.74 | 720 | 703 | 172.1 |
| D | 8 | 195 | 1049359 | 6094.08 | 720 | 703 | 172.1 |
| D | 12 | 233 | 143675 | 830.85 | 720 | 703 | 172.1 |
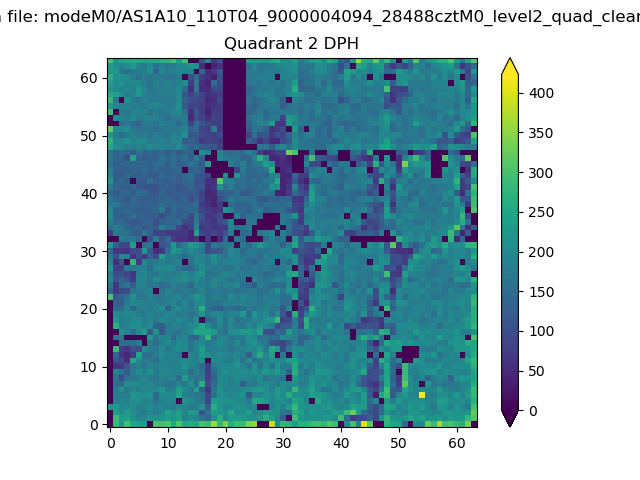
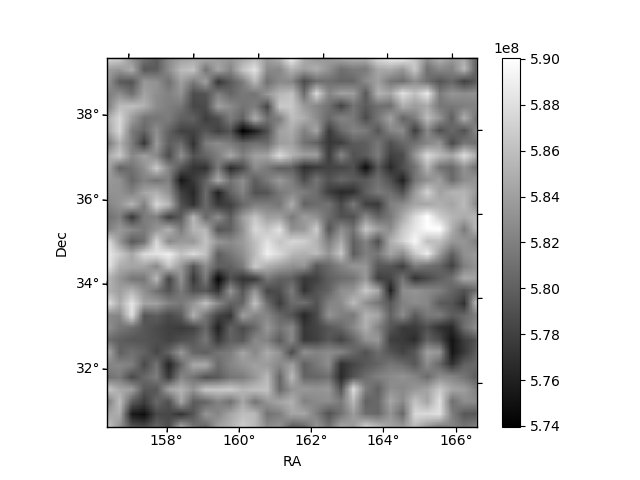
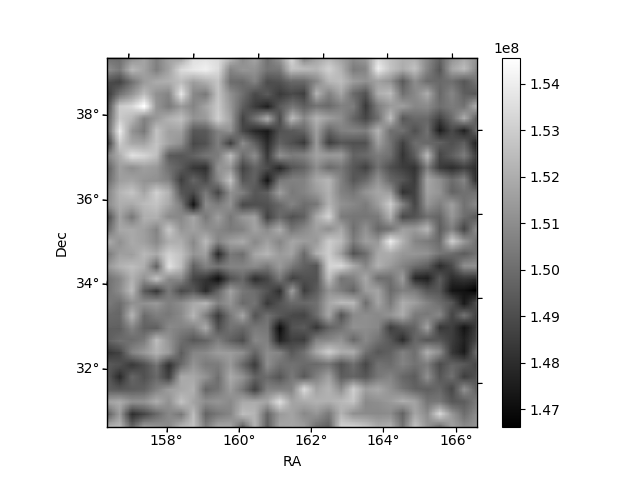
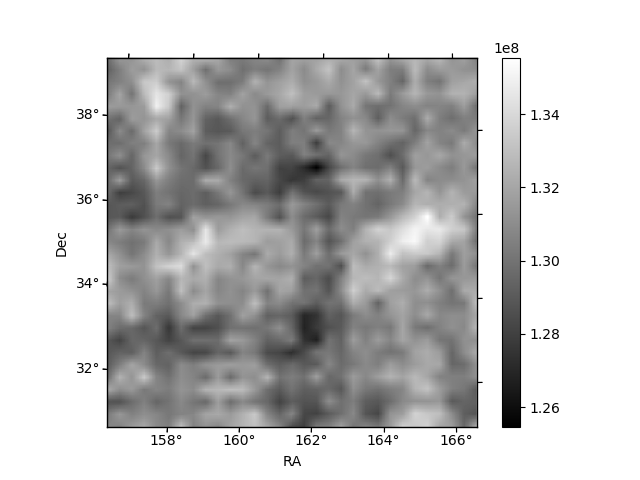
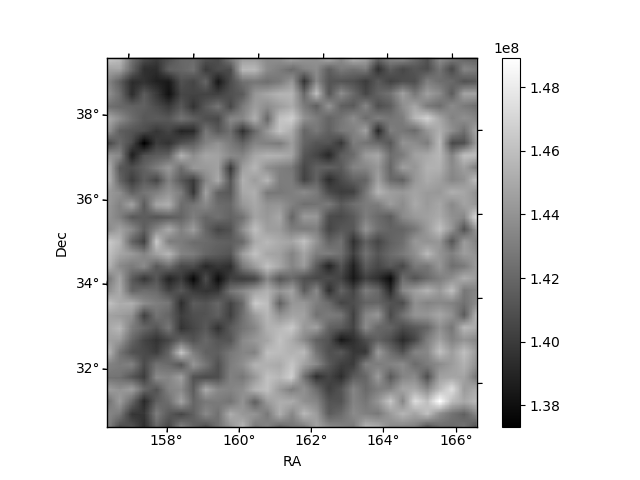
Histogram calculated using DETX and DETY for each event in the final _common_clean file
| Quadrant A | 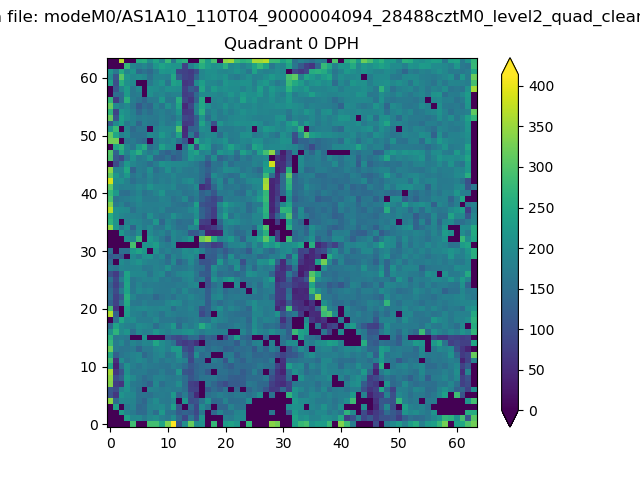 |
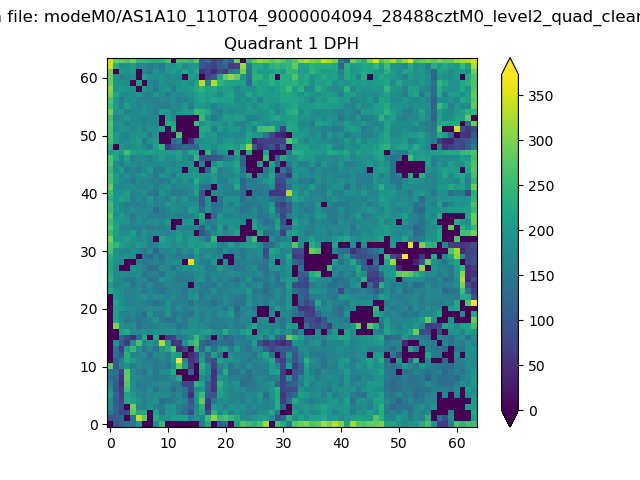 |
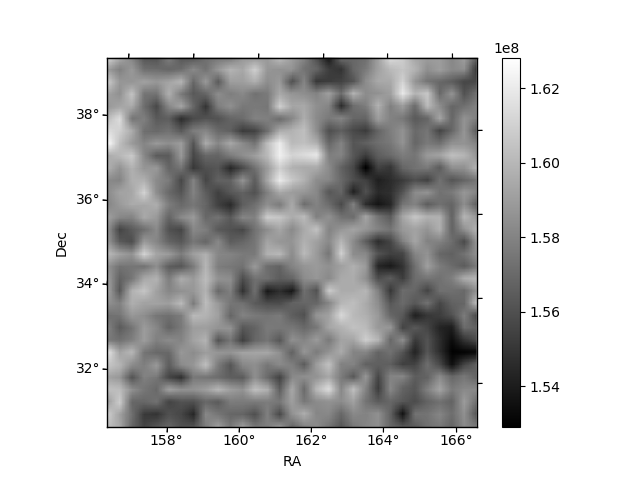
Quadrant B |
|---|---|---|---|
| Quadrant D | 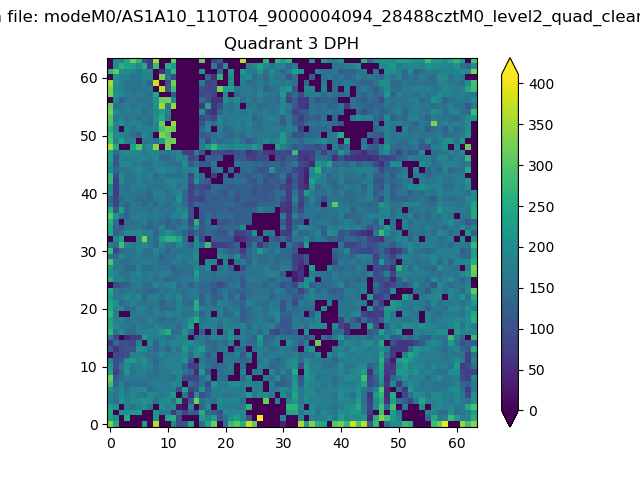 |
 |
Quadrant C |
| Plot type | Count rate plots | Images |
|---|---|---|
| Comparison with Poisson distribution Blue bars denote a histogram of data divided into 1 sec bins. Red curve is a Poisson curve with rate = median count rate of data. |
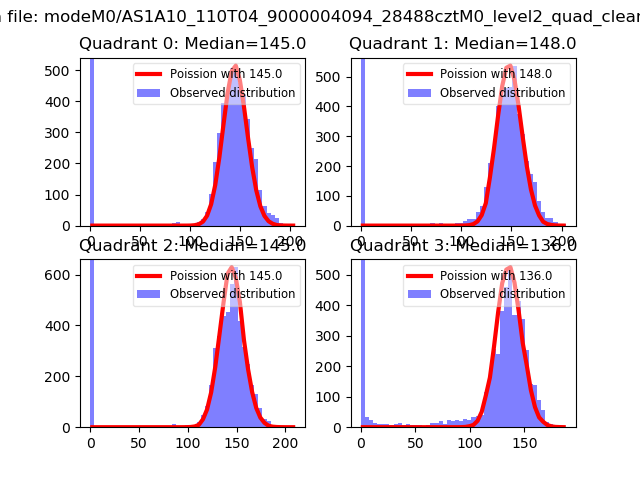 |
 |
| Quadrant-wise count rates Data is divided into 100 sec bins |
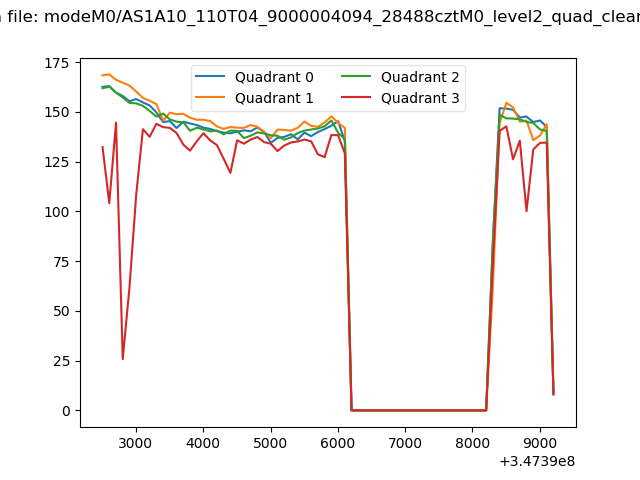 |
|
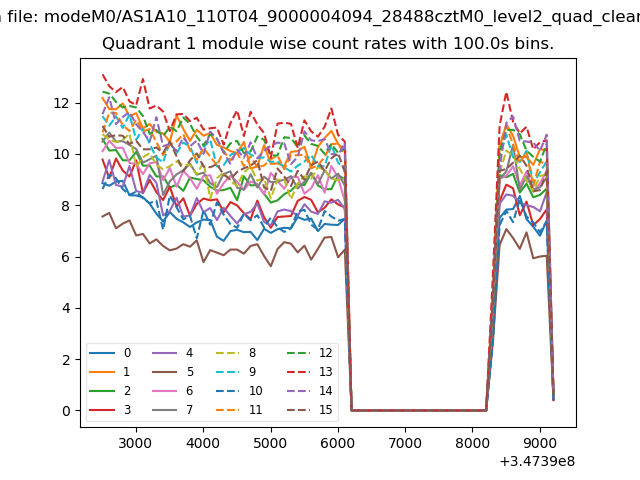
| Module-wise count rates for Quadrant A Data is divided into 100 sec bins |
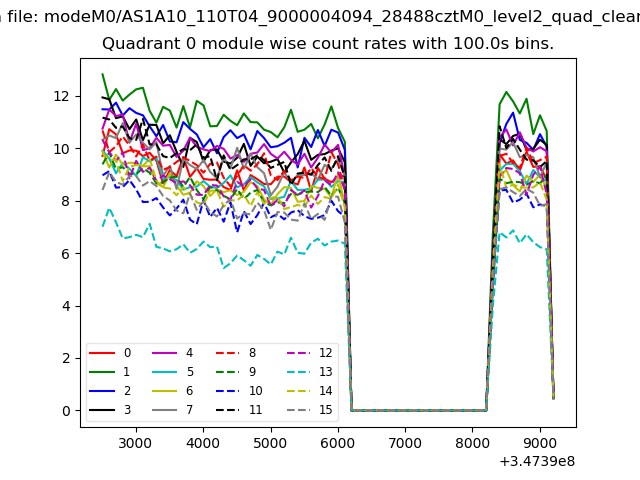 |
 |
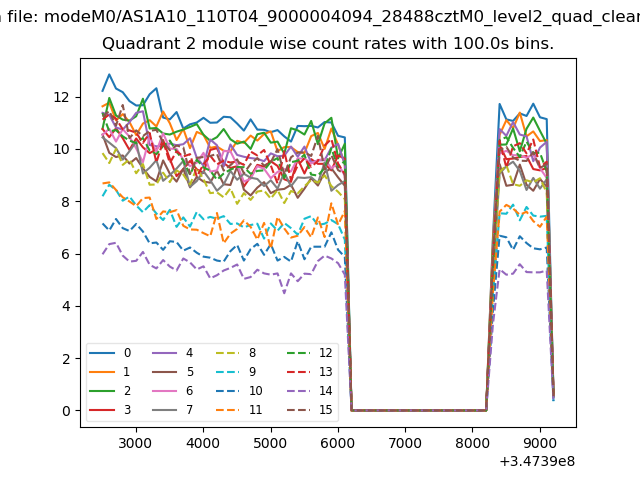
| Module-wise count rates for Quadrant B Data is divided into 100 sec bins |
 |
 |
| Module-wise count rates for Quadrant C Data is divided into 100 sec bins |
 |
 |
| Module-wise count rates for Quadrant D Data is divided into 100 sec bins |
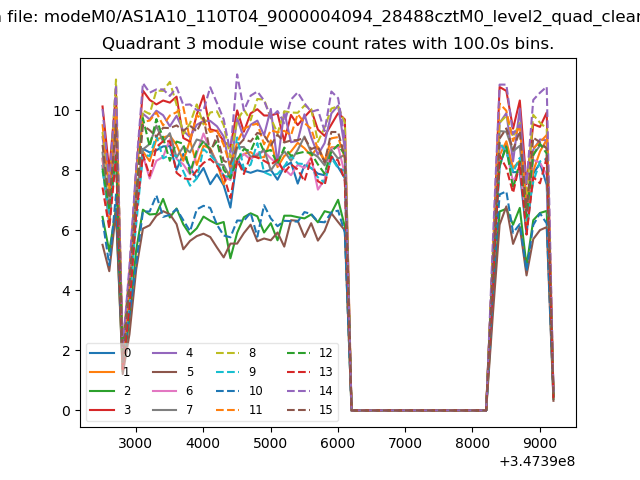 |
 |
| Parameter | Plot |
|---|---|
| CZT HV Monitor | 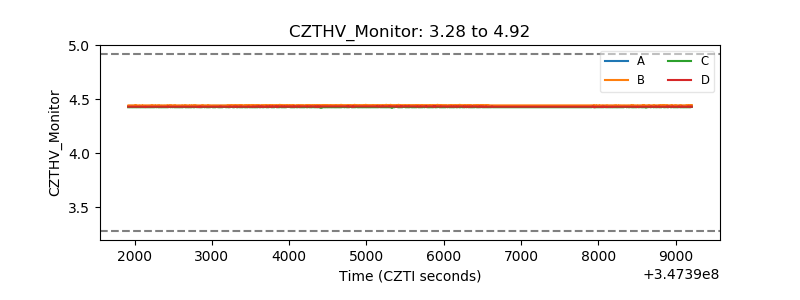 |
| D_VDD | 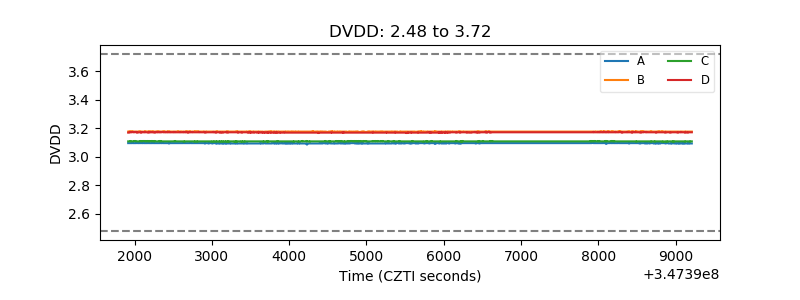 |
| Temperature 1 | 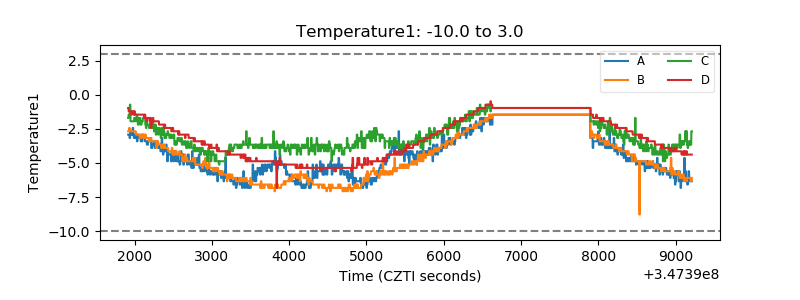 |
| Veto HV Monitor | 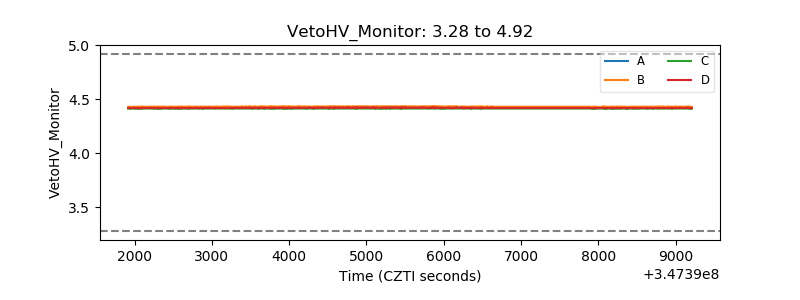 |
| Veto LLD | 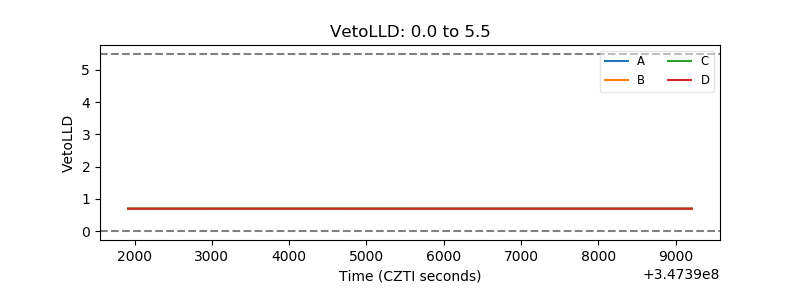 |
| Alpha Counter | 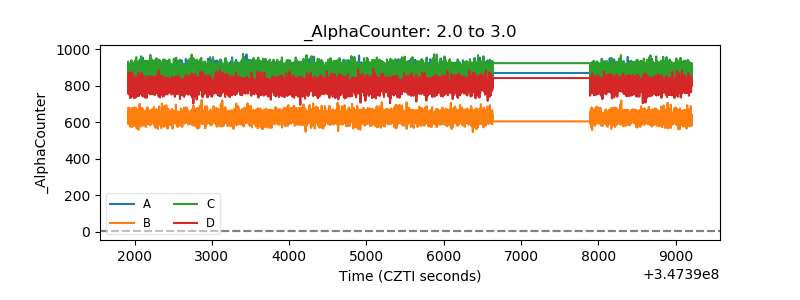 |
| _CPM_Rate | 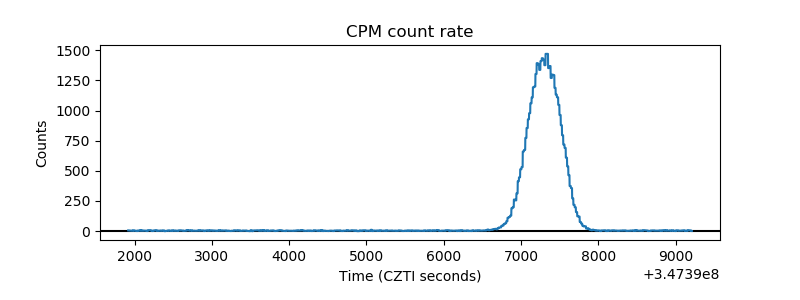 |
| CZT Counter | 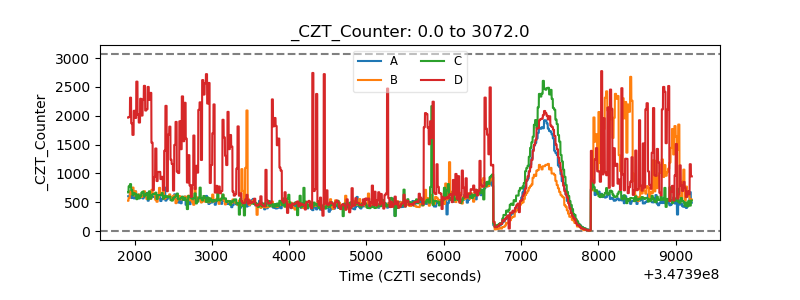 |
| +2.5 Volts monitor |  |
| +5 Volts monitor |  |
| _ROLL_ROT | 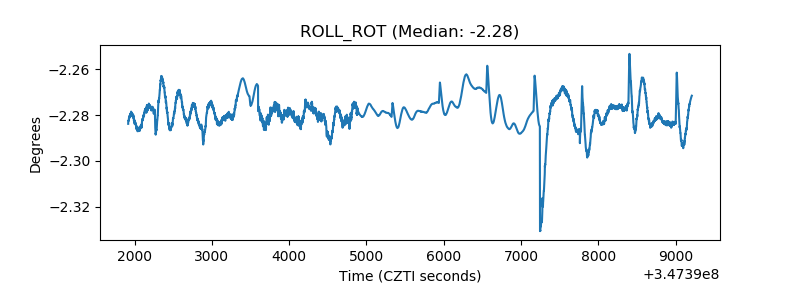 |
| _Roll_DEC | 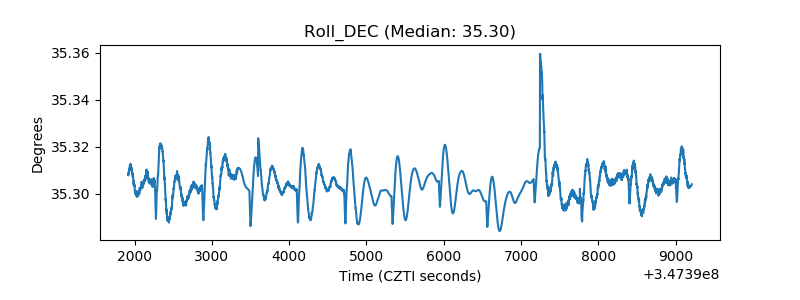 |
| _Roll_RA | 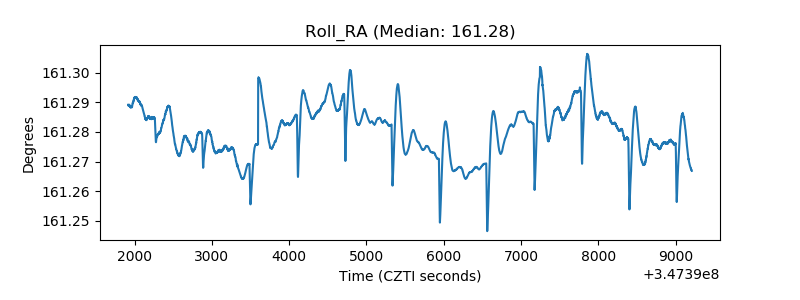 |
| Veto Counter | 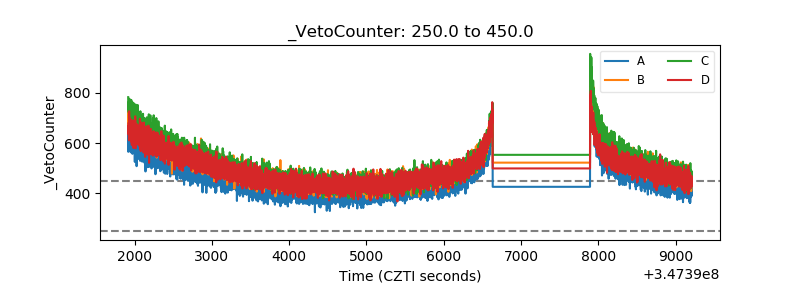 |