| Param | Original file | Final file |
|---|---|---|
| Filename | modeM0/AS1A10_110T04_9000004094_28489cztM0_level2.evt | modeM0/AS1A10_110T04_9000004094_28489cztM0_level2_quad_clean.evt |
| Size (bytes) | 691,499,520 | 104,702,400 |
| Size | 659.5 MB | 99.9 MB |
| Events in quadrant A | 3,380,259 | 697,626 |
| Events in quadrant B | 6,434,246 | 680,087 |
| Events in quadrant C | 3,443,508 | 690,347 |
| Events in quadrant D | 7,228,202 | 632,491 |
| Mode M0 | |||
|---|---|---|---|
| Quadrant | BADHDUFLAG | Total packets | Discarded packets |
| A | 0 | 14399 | 2 |
| B | 0 | 23647 | 2 |
| C | 0 | 14446 | 2 |
| D | 0 | 26146 | 2 |
| Mode SS | |||
|---|---|---|---|
| Quadrant | BADHDUFLAG | Total packets | Discarded packets |
| A | 0 | 136 | 0 |
| B | 0 | 136 | 0 |
| C | 0 | 136 | 0 |
| D | 0 | 136 | 0 |
| Mode M9 | |||
|---|---|---|---|
| Quadrant | BADHDUFLAG | Total packets | Discarded packets |
| A | 0 | 10 | 0 |
| B | 0 | 10 | 0 |
| C | 0 | 10 | 0 |
| D | 0 | 10 | 0 |
| Quadrant | Total seconds | Saturated seconds | Saturation percentage |
|---|---|---|---|
| A | 6746 | 72 | 1.067299% |
| B | 6747 | 1093 | 16.199793% |
| C | 6747 | 152 | 2.252853% |
| D | 6747 | 891 | 13.205869% |
Noise dominated data is calculated using 1-second bins in cleaned event files. If a bin has >2000 counts, and if more than 50% of those come from <1% of pixels, then it is considered to be noise-dominated and hence unusable.
| Quadrant | # 1 sec bins | Bins with >0 counts | Bins with >2000 counts | High rate bins dominated by noise | Noise dominated (total time) | Noise dominated (detector-on time) | Marked lightcurve |
|---|---|---|---|---|---|---|---|
| A | 7691 | 6746 | 2 | 2 | 0.03% | 0.03% | 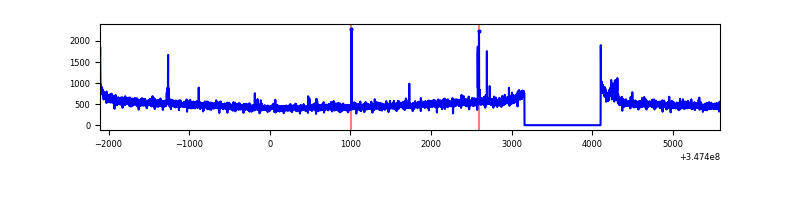 |
| B | 7692 | 6747 | 711 | 711 | 9.24% | 10.54% | 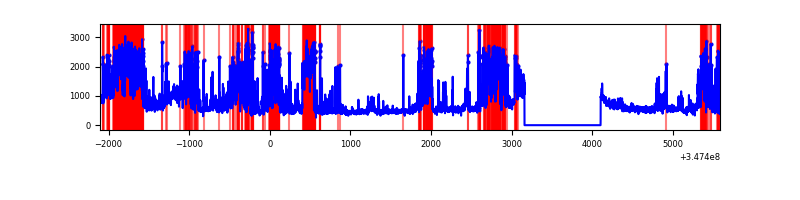 |
| C | 7692 | 6748 | 0 | 0 | 0.00% | 0.00% | 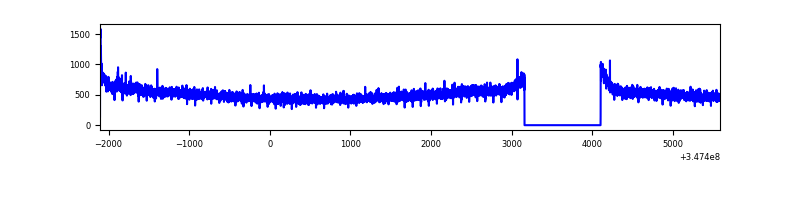 |
| D | 7691 | 6747 | 969 | 969 | 12.60% | 14.36% | 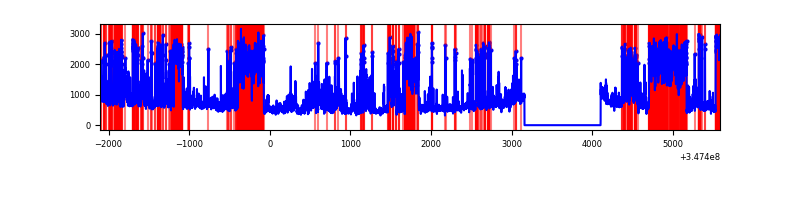 |
Top three noisy pixels from each quadrant. If the there are fewer than three noisy pixels in the level2.evt file, extra rows are filled as -1
| Pixel properties | Quadrant properties | ||||||
|---|---|---|---|---|---|---|---|
| Quadrant | DetID | PixID | Counts | Sigma | Mean | Median | Sigma |
| A | 15 | 174 | 62565 | 359.16 | 857 | 839 | 171.9 |
| A | 13 | 254 | 11914 | 64.44 | 857 | 839 | 171.9 |
| A | 8 | 192 | 8893 | 46.86 | 857 | 839 | 171.9 |
| B | 10 | 245 | 3168666 | 20411.49 | 816 | 796 | 155.2 |
| B | 0 | 230 | 38024 | 239.87 | 816 | 796 | 155.2 |
| B | 12 | 111 | 18691 | 115.3 | 816 | 796 | 155.2 |
| C | 14 | 238 | 136227 | 694.48 | 839 | 845 | 194.9 |
| C | 3 | 233 | 24927 | 123.54 | 839 | 845 | 194.9 |
| C | 0 | 10 | 6431 | 28.65 | 839 | 845 | 194.9 |
| D | 1 | 52 | 1863688 | 9656.76 | 804 | 783 | 192.9 |
| D | 8 | 195 | 1766641 | 9153.7 | 804 | 783 | 192.9 |
| D | 12 | 233 | 236155 | 1220.1 | 804 | 783 | 192.9 |
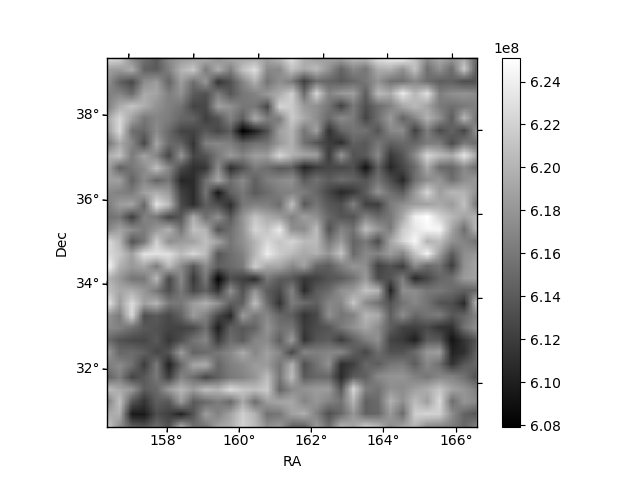
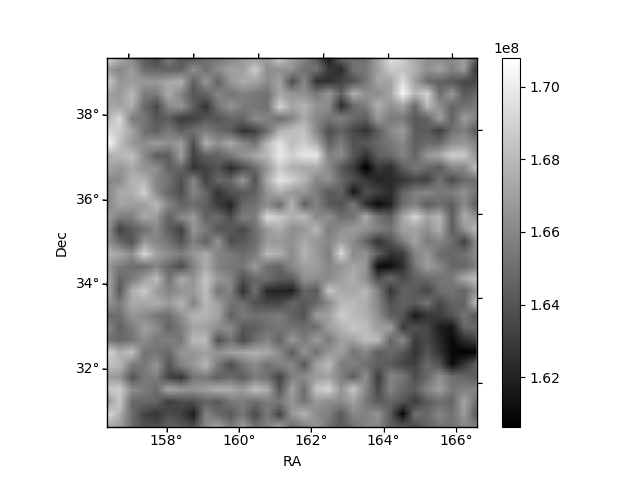
Histogram calculated using DETX and DETY for each event in the final _common_clean file
| Quadrant A | 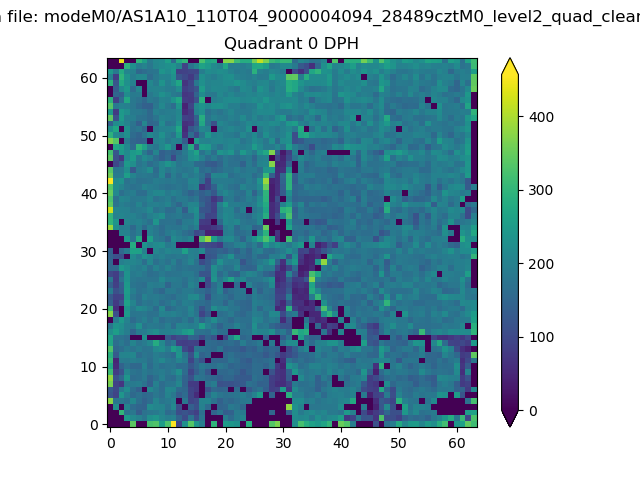 |
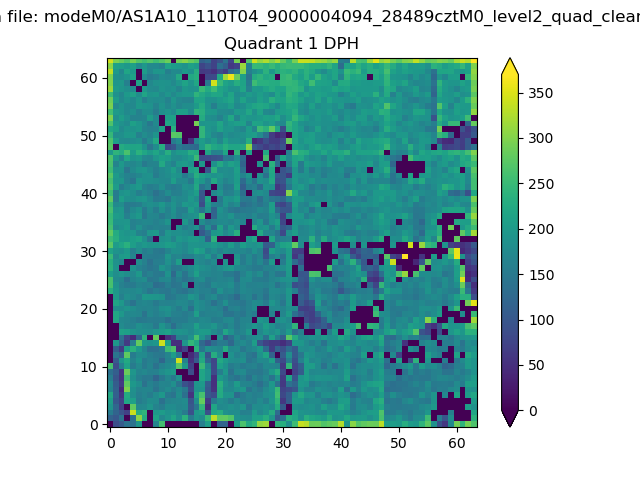 |
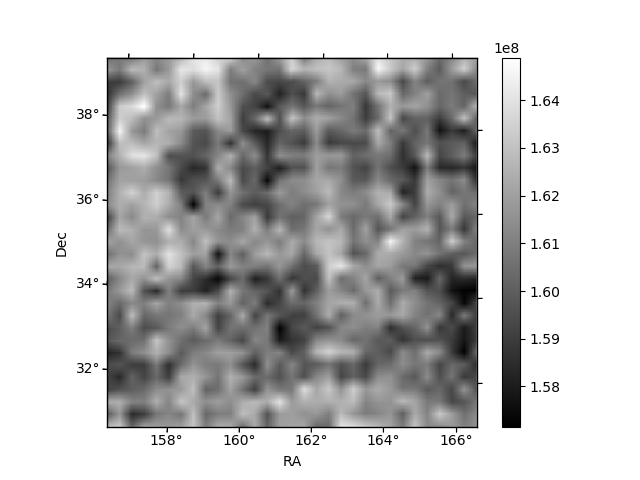
Quadrant B |
|---|---|---|---|
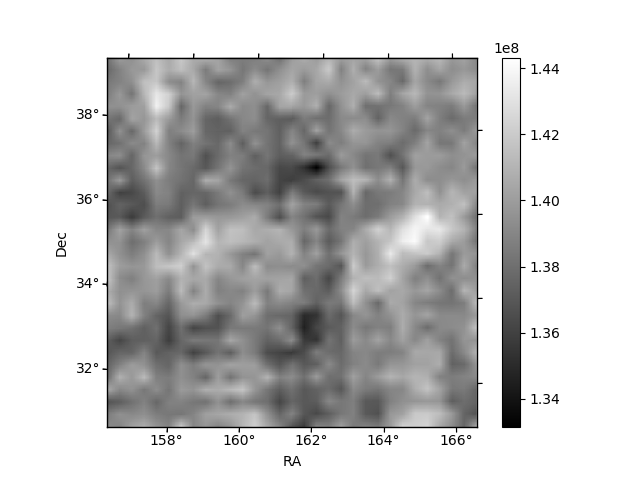
| Quadrant D |  |
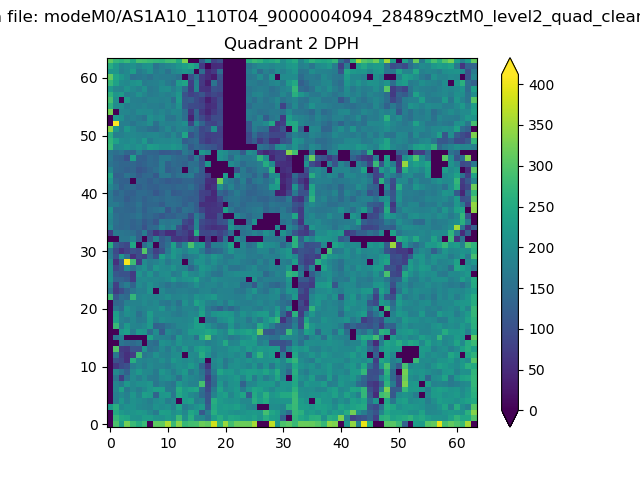 |
Quadrant C |
| Plot type | Count rate plots | Images |
|---|---|---|
| Comparison with Poisson distribution Blue bars denote a histogram of data divided into 1 sec bins. Red curve is a Poisson curve with rate = median count rate of data. |
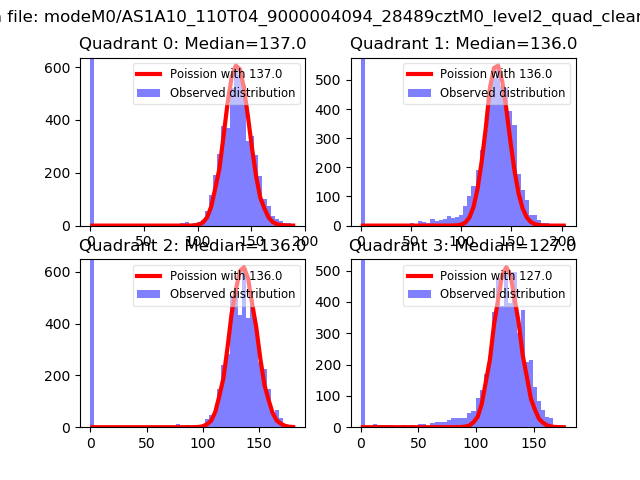 |
 |
| Quadrant-wise count rates Data is divided into 100 sec bins |
 |
|
| Module-wise count rates for Quadrant A Data is divided into 100 sec bins |
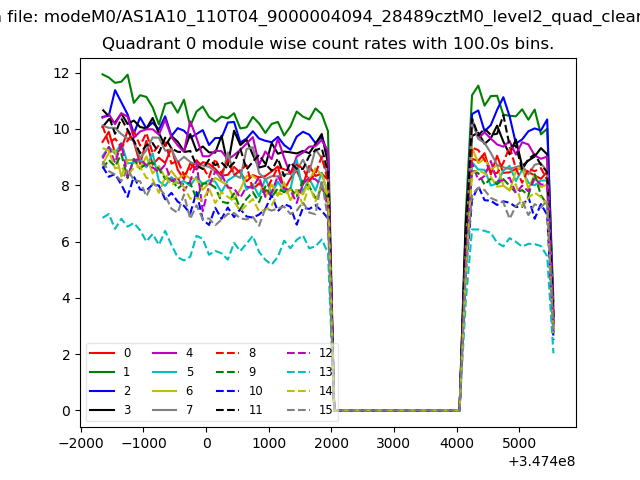 |
 |
| Module-wise count rates for Quadrant B Data is divided into 100 sec bins |
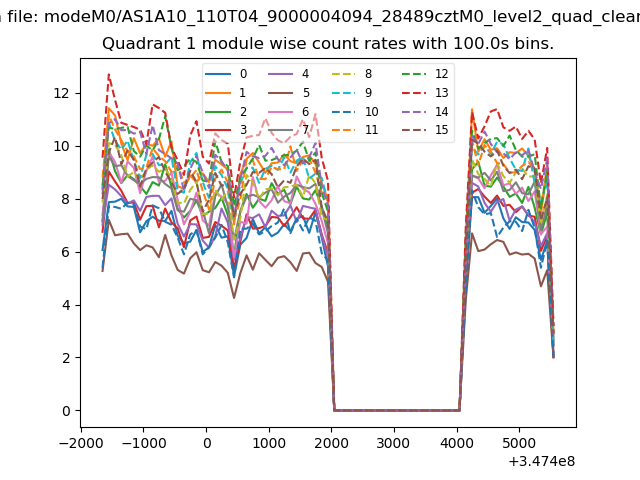 |
 |
| Module-wise count rates for Quadrant C Data is divided into 100 sec bins |
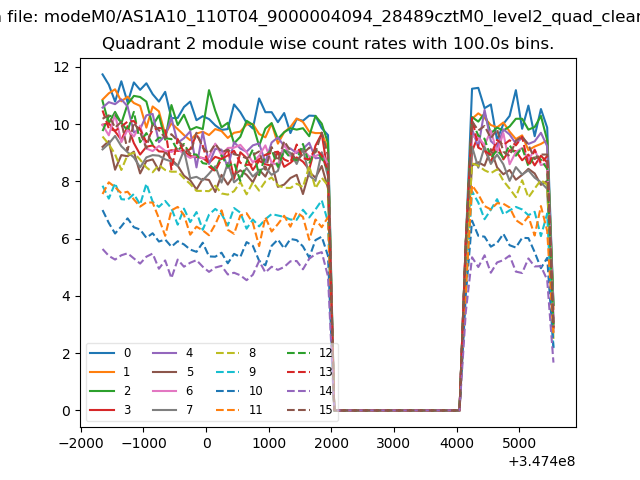 |
 |
| Module-wise count rates for Quadrant D Data is divided into 100 sec bins |
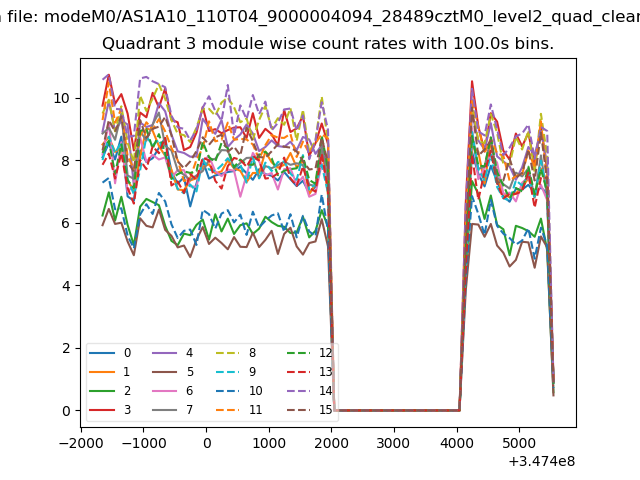 |
 |
| Parameter | Plot |
|---|---|
| CZT HV Monitor |  |
| D_VDD | 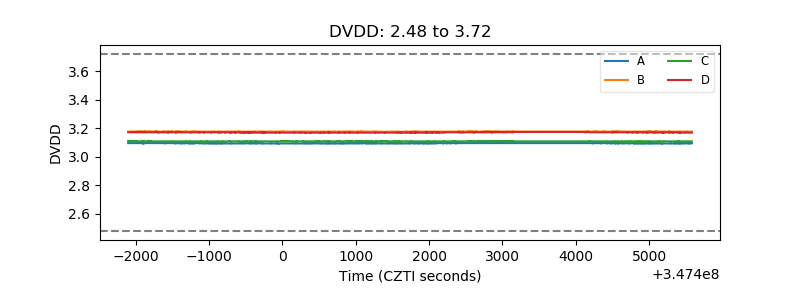 |
| Temperature 1 |  |
| Veto HV Monitor | 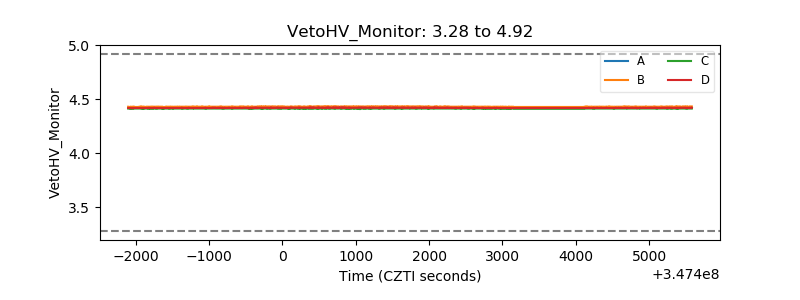 |
| Veto LLD | 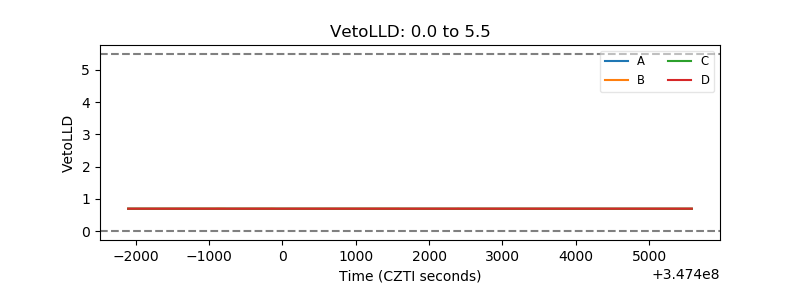 |
| Alpha Counter | 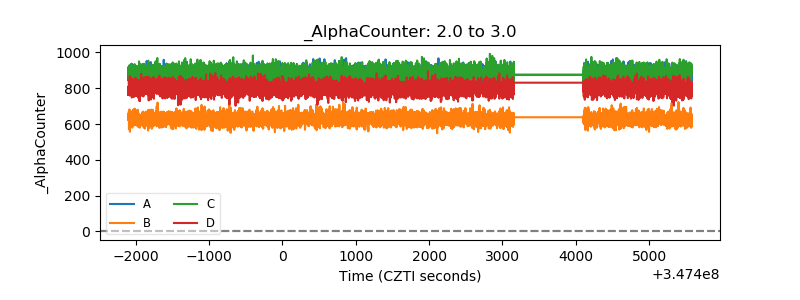 |
| _CPM_Rate | 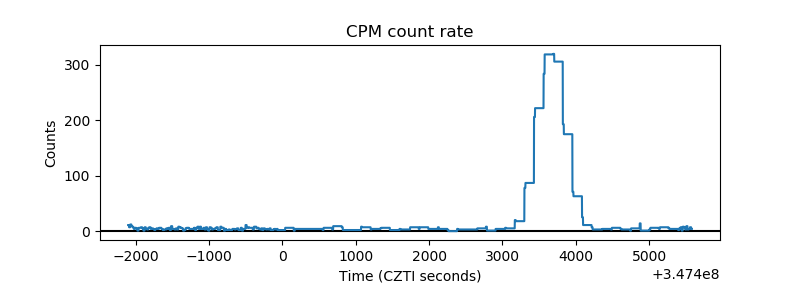 |
| CZT Counter | 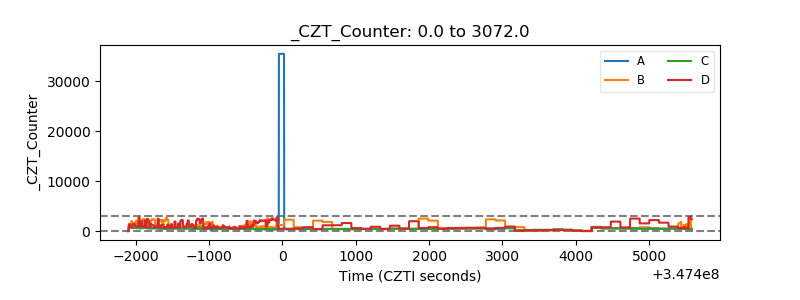 |
| +2.5 Volts monitor |  |
| +5 Volts monitor |  |
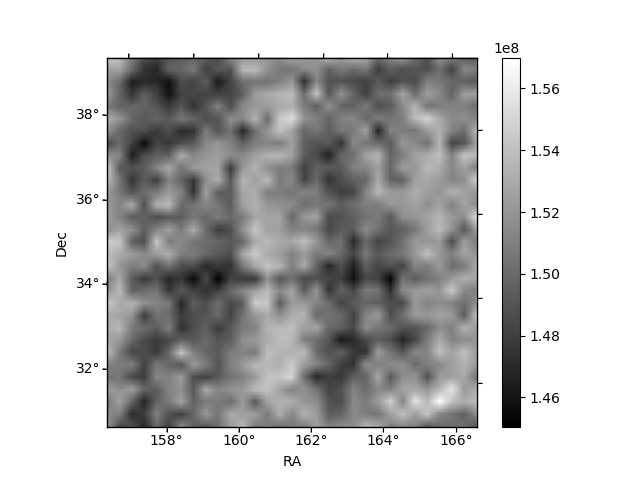
| _ROLL_ROT | 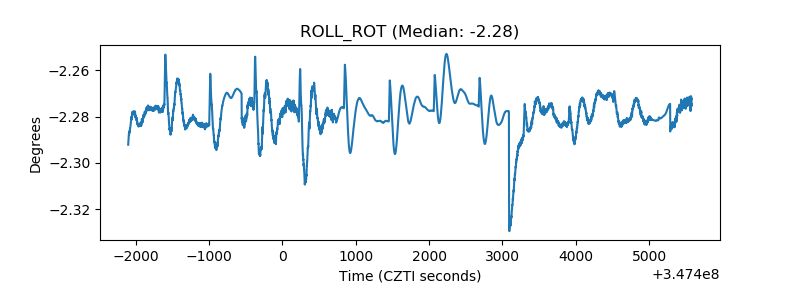 |
| _Roll_DEC | 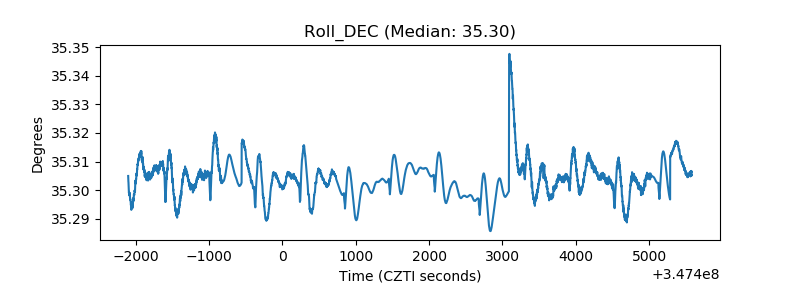 |
| _Roll_RA | 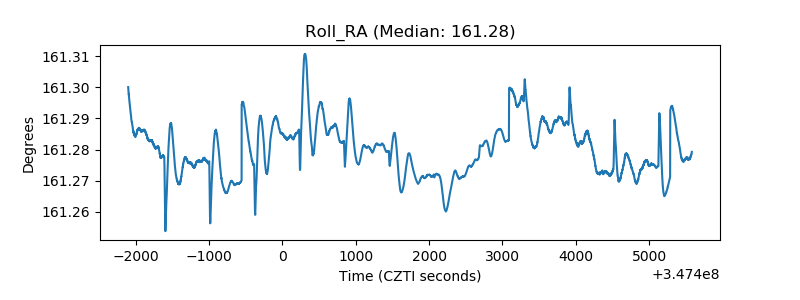 |
| Veto Counter | 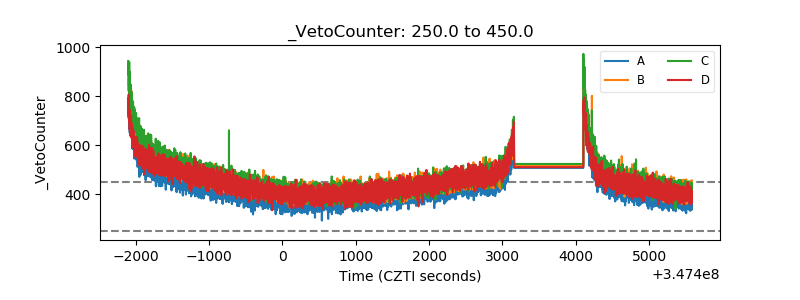 |