| Param | Original file | Final file |
|---|---|---|
| Filename | modeM0/AS1A10_110T04_9000004094_28490cztM0_level2.evt | modeM0/AS1A10_110T04_9000004094_28490cztM0_level2_quad_clean.evt |
| Size (bytes) | 824,765,760 | 101,260,800 |
| Size | 786.6 MB | 96.6 MB |
| Events in quadrant A | 3,595,670 | 674,892 |
| Events in quadrant B | 7,049,358 | 653,313 |
| Events in quadrant C | 3,662,189 | 666,688 |
| Events in quadrant D | 10,181,516 | 566,636 |
| Mode M0 | |||
|---|---|---|---|
| Quadrant | BADHDUFLAG | Total packets | Discarded packets |
| A | 0 | 15497 | 2 |
| B | 0 | 25931 | 2 |
| C | 0 | 15431 | 2 |
| D | 0 | 35201 | 5 |
| Mode SS | |||
|---|---|---|---|
| Quadrant | BADHDUFLAG | Total packets | Discarded packets |
| A | 0 | 148 | 0 |
| B | 0 | 148 | 0 |
| C | 0 | 148 | 0 |
| D | 0 | 148 | 0 |
| Mode M9 | |||
|---|---|---|---|
| Quadrant | BADHDUFLAG | Total packets | Discarded packets |
| A | 0 | 15 | 0 |
| B | 0 | 15 | 0 |
| C | 0 | 15 | 0 |
| D | 0 | 15 | 0 |
| Quadrant | Total seconds | Saturated seconds | Saturation percentage |
|---|---|---|---|
| A | 7247 | 114 | 1.573065% |
| B | 7248 | 1163 | 16.045806% |
| C | 7248 | 223 | 3.076711% |
| D | 7247 | 2560 | 35.324962% |
Noise dominated data is calculated using 1-second bins in cleaned event files. If a bin has >2000 counts, and if more than 50% of those come from <1% of pixels, then it is considered to be noise-dominated and hence unusable.
| Quadrant | # 1 sec bins | Bins with >0 counts | Bins with >2000 counts | High rate bins dominated by noise | Noise dominated (total time) | Noise dominated (detector-on time) | Marked lightcurve |
|---|---|---|---|---|---|---|---|
| A | 8732 | 7247 | 0 | 0 | 0.00% | 0.00% | 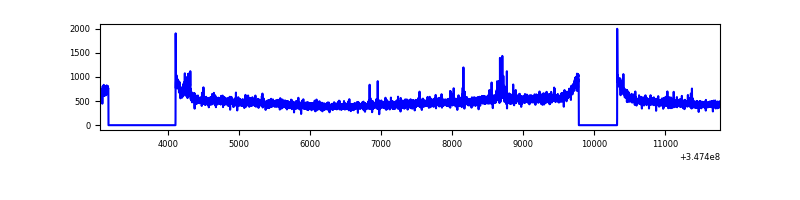 |
| B | 8733 | 7248 | 777 | 777 | 8.90% | 10.72% | 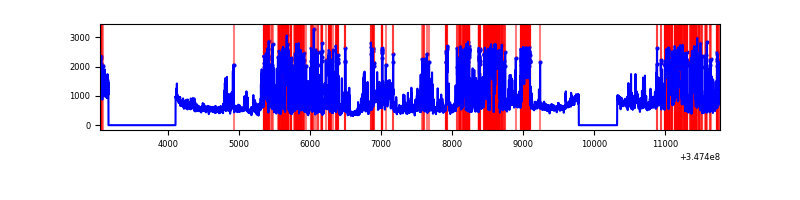 |
| C | 8733 | 7249 | 0 | 0 | 0.00% | 0.00% | 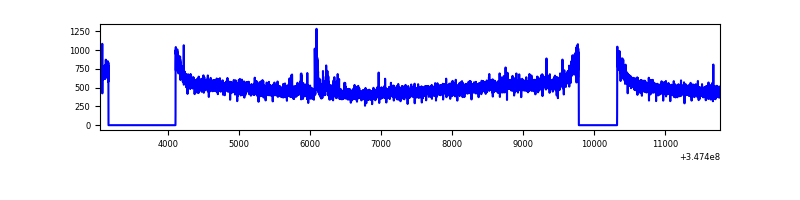 |
| D | 8731 | 7247 | 2327 | 2327 | 26.65% | 32.11% | 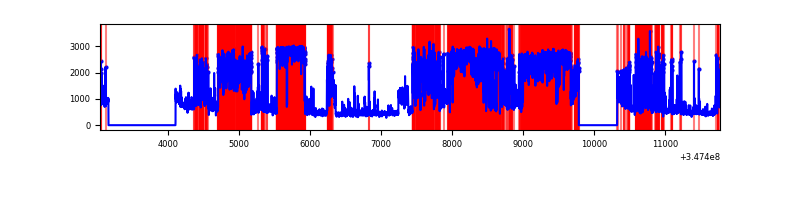 |
Top three noisy pixels from each quadrant. If the there are fewer than three noisy pixels in the level2.evt file, extra rows are filled as -1
| Pixel properties | Quadrant properties | ||||||
|---|---|---|---|---|---|---|---|
| Quadrant | DetID | PixID | Counts | Sigma | Mean | Median | Sigma |
| A | 15 | 174 | 34290 | 180.13 | 913 | 893 | 185.4 |
| A | 1 | 113 | 24554 | 127.62 | 913 | 893 | 185.4 |
| A | 13 | 254 | 12456 | 62.36 | 913 | 893 | 185.4 |
| B | 10 | 245 | 3573296 | 21465.96 | 864 | 842 | 166.4 |
| B | 0 | 230 | 37513 | 220.35 | 864 | 842 | 166.4 |
| B | 12 | 111 | 20535 | 118.33 | 864 | 842 | 166.4 |
| C | 14 | 238 | 142940 | 686.66 | 885 | 892 | 206.9 |
| C | 7 | 247 | 67255 | 320.8 | 885 | 892 | 206.9 |
| C | 13 | 61 | 6005 | 24.72 | 885 | 892 | 206.9 |
| D | 12 | 79 | 3947647 | 22419.44 | 731 | 710 | 176.0 |
| D | 8 | 195 | 1649270 | 9364.17 | 731 | 710 | 176.0 |
| D | 1 | 52 | 1586102 | 9005.36 | 731 | 710 | 176.0 |
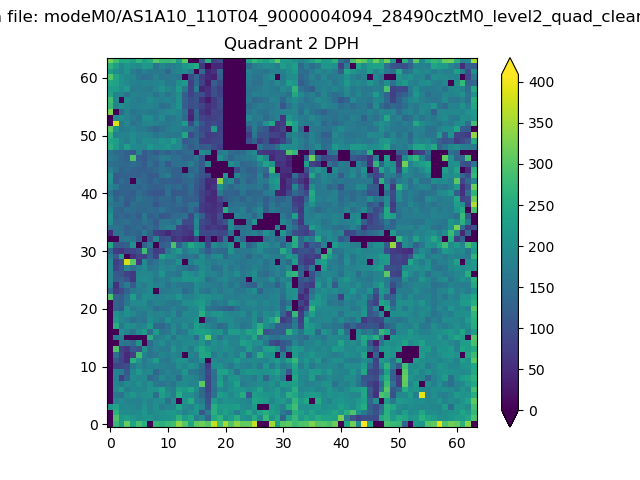
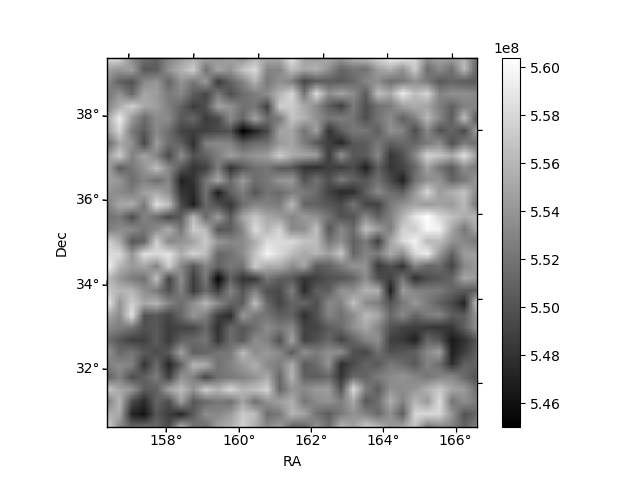
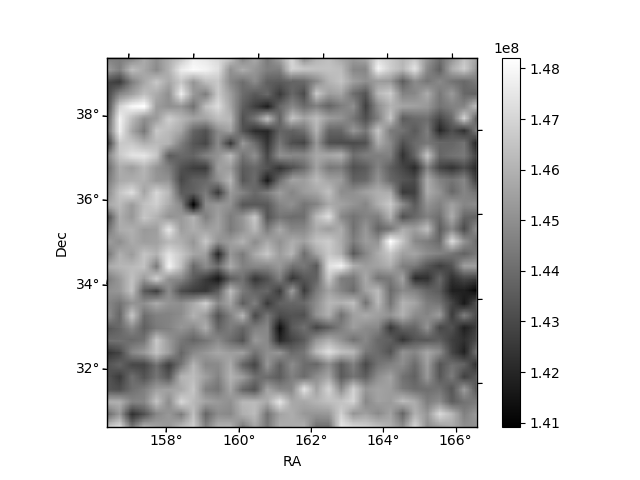
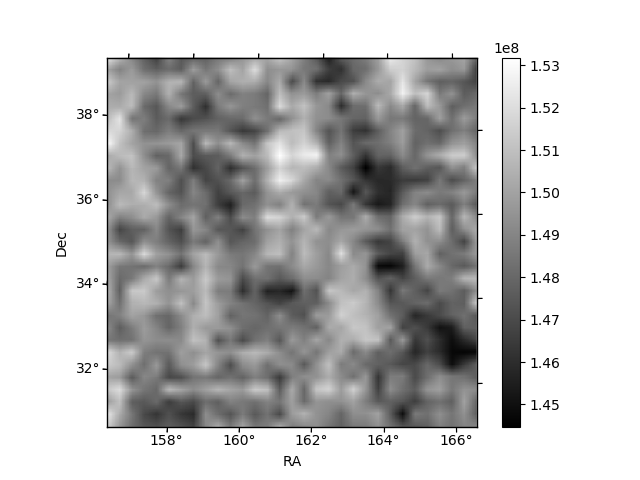
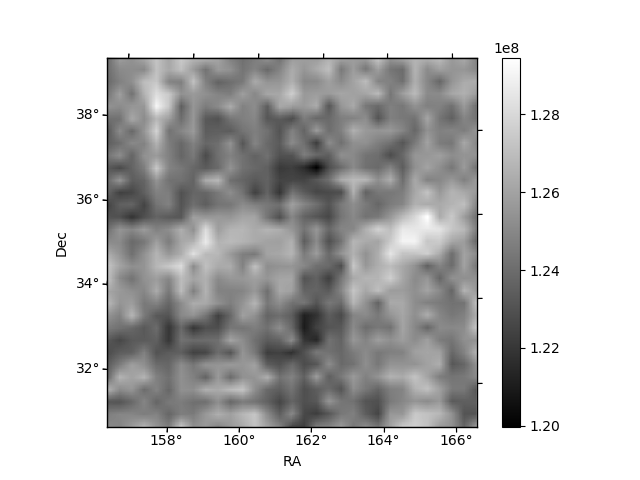
Histogram calculated using DETX and DETY for each event in the final _common_clean file
| Quadrant A | 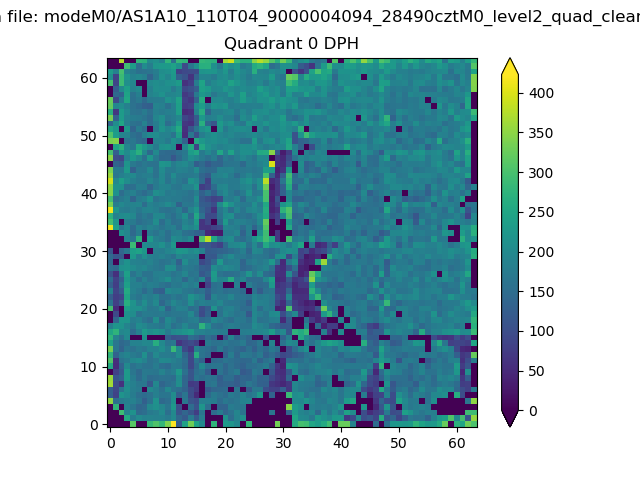 |
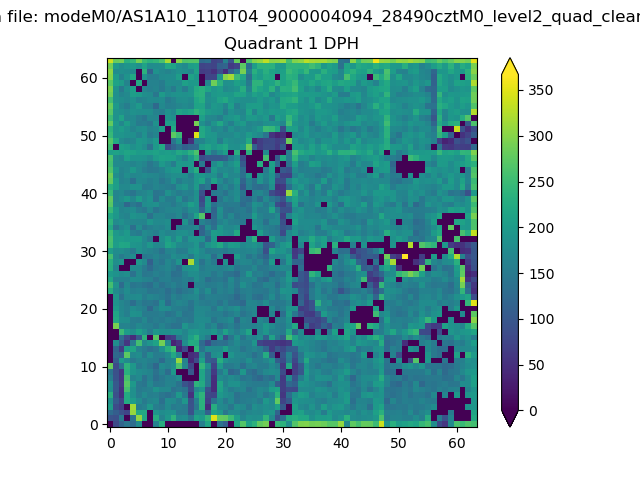 |
Quadrant B |
|---|---|---|---|
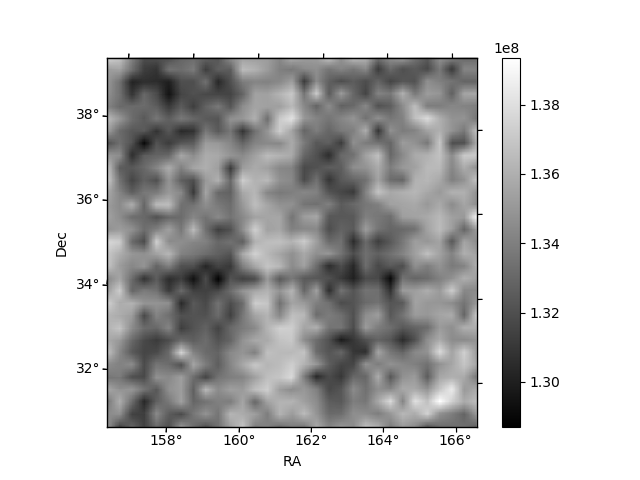
| Quadrant D | 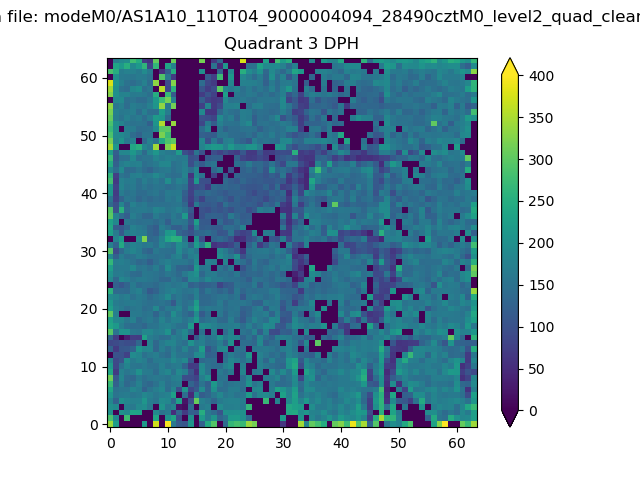 |
 |
Quadrant C |
| Plot type | Count rate plots | Images |
|---|---|---|
| Comparison with Poisson distribution Blue bars denote a histogram of data divided into 1 sec bins. Red curve is a Poisson curve with rate = median count rate of data. |
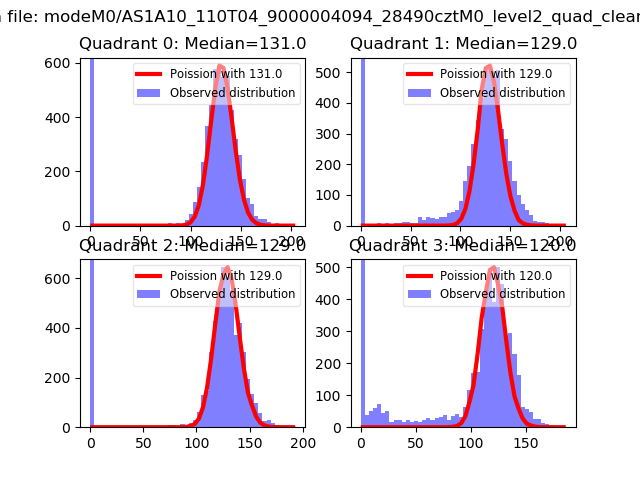 |
 |
| Quadrant-wise count rates Data is divided into 100 sec bins |
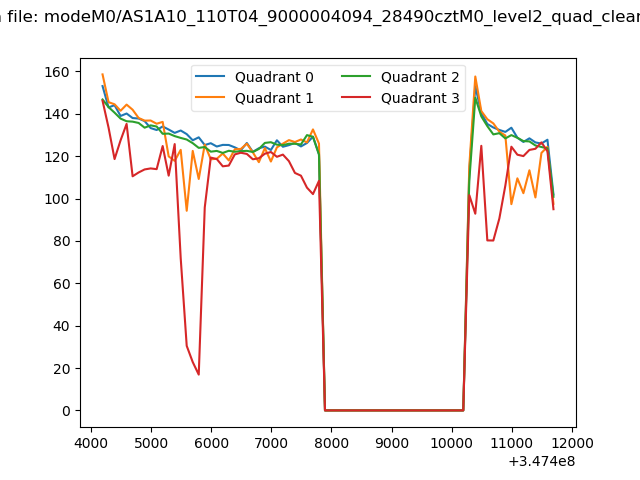 |
|
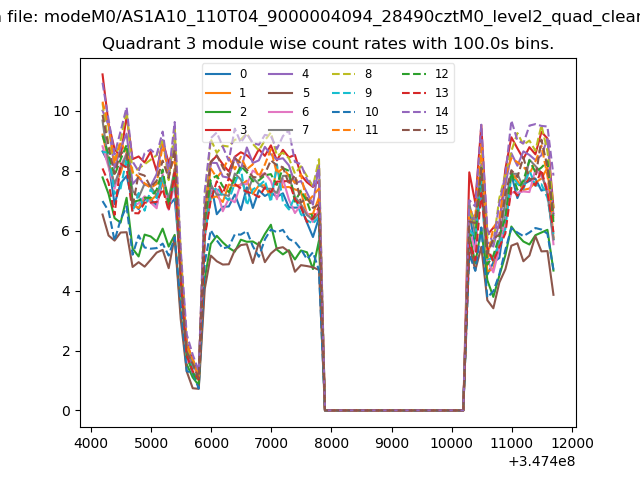
| Module-wise count rates for Quadrant A Data is divided into 100 sec bins |
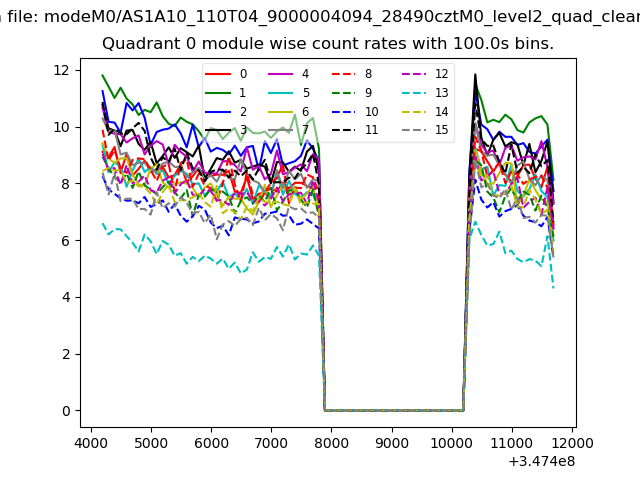 |
 |
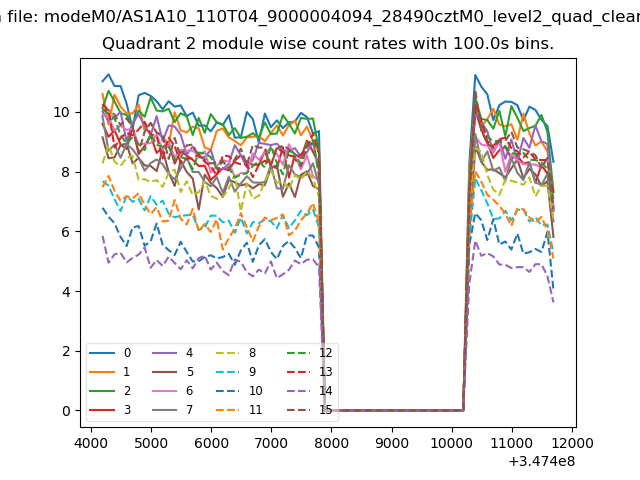
| Module-wise count rates for Quadrant B Data is divided into 100 sec bins |
 |
 |
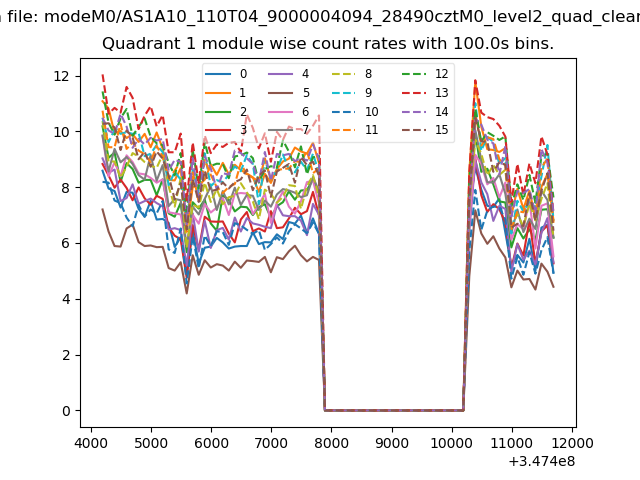
| Module-wise count rates for Quadrant C Data is divided into 100 sec bins |
 |
 |
| Module-wise count rates for Quadrant D Data is divided into 100 sec bins |
 |
 |
| Parameter | Plot |
|---|---|
| CZT HV Monitor | 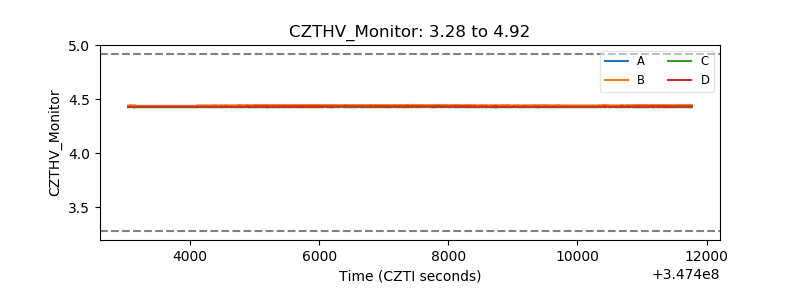 |
| D_VDD | 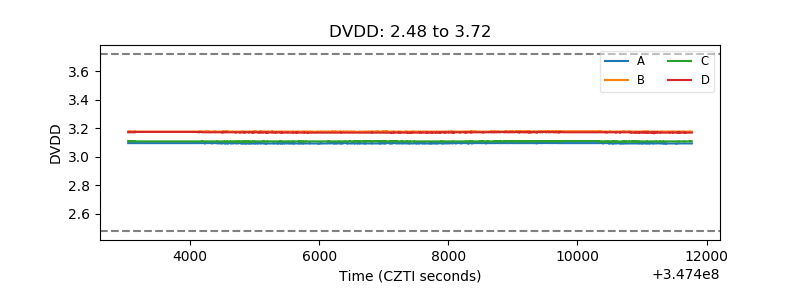 |
| Temperature 1 | 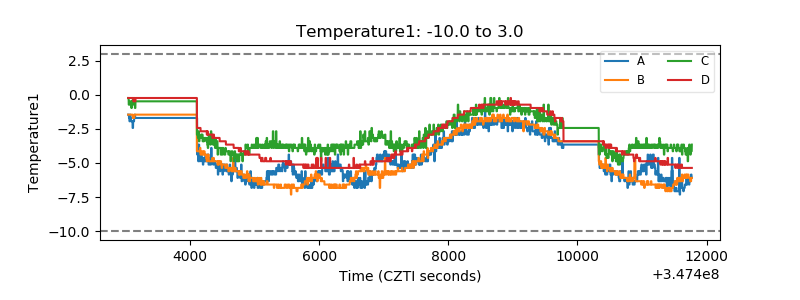 |
| Veto HV Monitor | 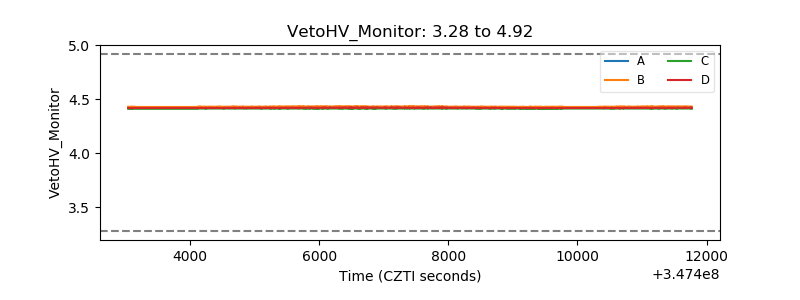 |
| Veto LLD | 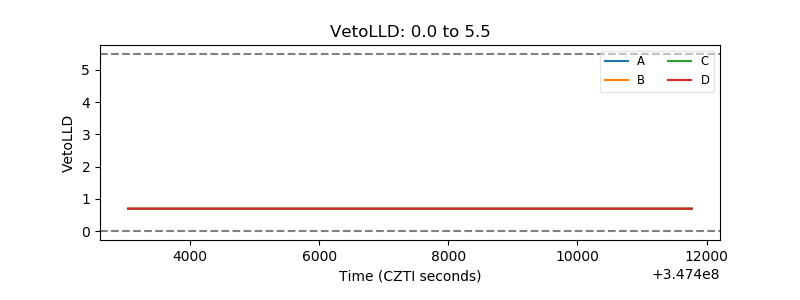 |
| Alpha Counter | 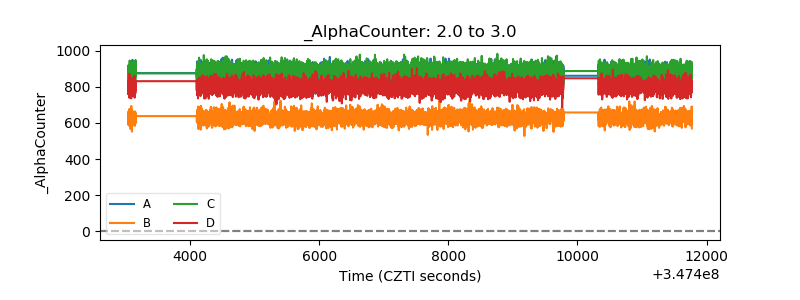 |
| _CPM_Rate | 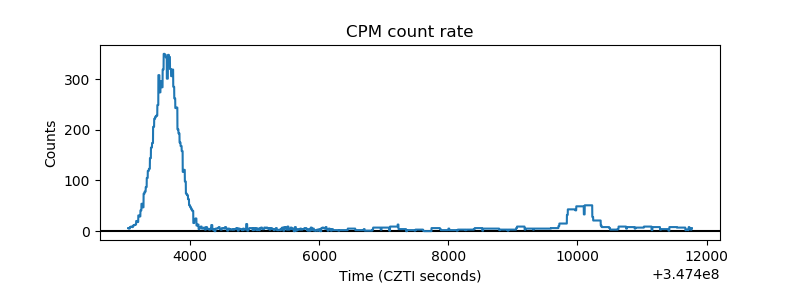 |
| CZT Counter | 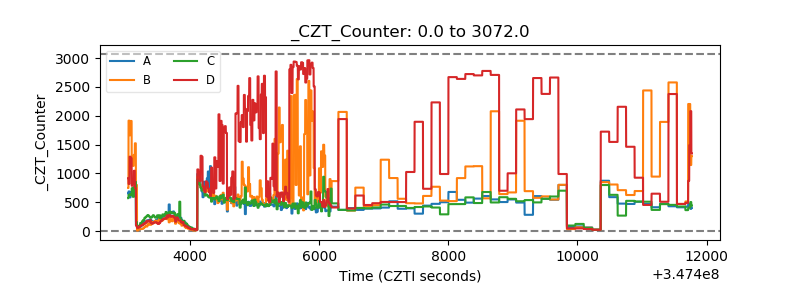 |
| +2.5 Volts monitor | 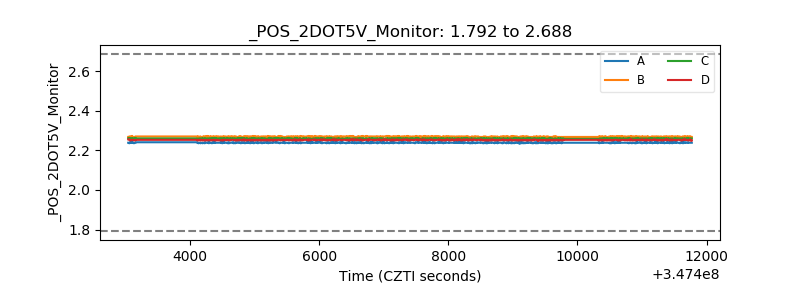 |
| +5 Volts monitor | 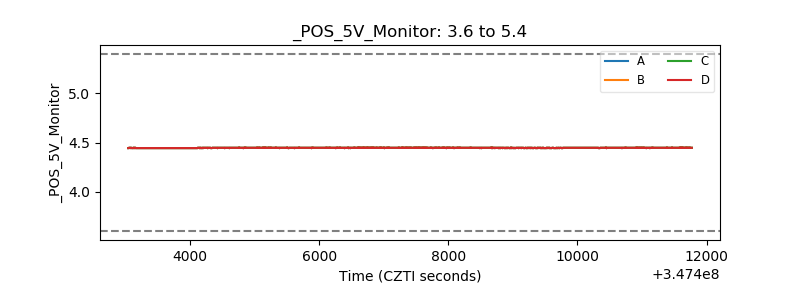 |
| _ROLL_ROT | 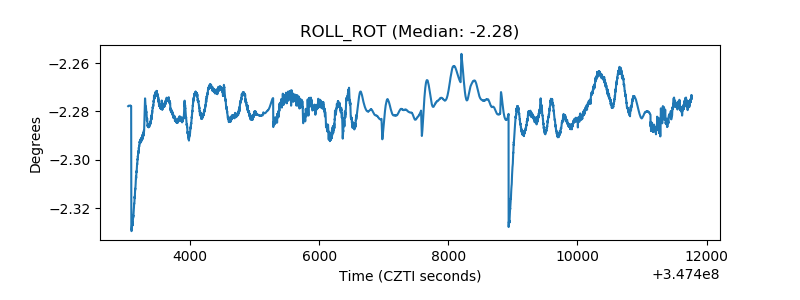 |
| _Roll_DEC | 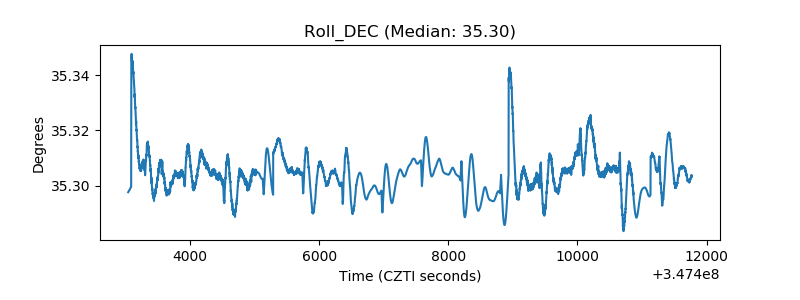 |
| _Roll_RA | 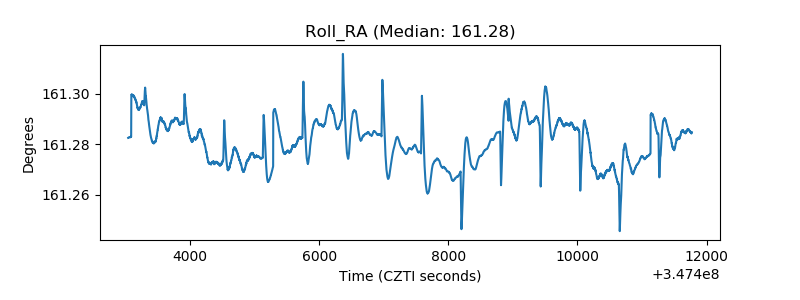 |
| Veto Counter | 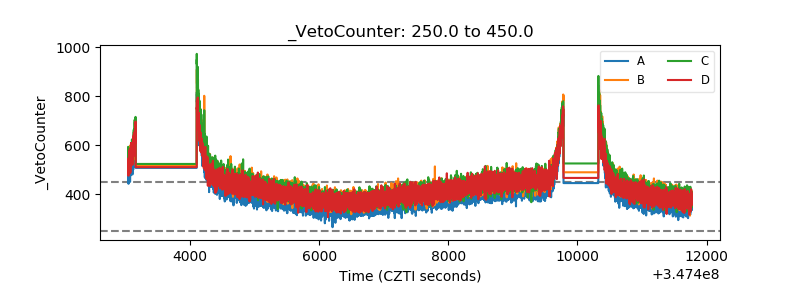 |