| Param | Original file | Final file |
|---|---|---|
| Filename | modeM0/AS1A10_110T04_9000004094_28492cztM0_level2.evt | modeM0/AS1A10_110T04_9000004094_28492cztM0_level2_quad_clean.evt |
| Size (bytes) | 536,293,440 | 80,919,360 |
| Size | 511.4 MB | 77.2 MB |
| Events in quadrant A | 2,850,124 | 550,820 |
| Events in quadrant B | 3,859,828 | 540,658 |
| Events in quadrant C | 2,949,360 | 545,149 |
| Events in quadrant D | 6,187,680 | 407,123 |
| Mode M0 | |||
|---|---|---|---|
| Quadrant | BADHDUFLAG | Total packets | Discarded packets |
| A | 0 | 15241 | 2670 |
| B | 0 | 18392 | 3028 |
| C | 0 | 15332 | 2592 |
| D | 0 | 33899 | 11937 |
| Mode SS | |||
|---|---|---|---|
| Quadrant | BADHDUFLAG | Total packets | Discarded packets |
| A | 0 | 147 | 25 |
| B | 0 | 148 | 24 |
| C | 0 | 148 | 26 |
| D | 0 | 148 | 14 |
| Mode M9 | |||
|---|---|---|---|
| Quadrant | BADHDUFLAG | Total packets | Discarded packets |
| A | 0 | 3 | 0 |
| B | 0 | 4 | 1 |
| C | 0 | 4 | 0 |
| D | 0 | 4 | 0 |
| Quadrant | Total seconds | Saturated seconds | Saturation percentage |
|---|---|---|---|
| A | 5955 | 131 | 2.199832% |
| B | 5897 | 338 | 5.731728% |
| C | 6005 | 179 | 2.980849% |
| D | 5275 | 1453 | 27.545024% |
Noise dominated data is calculated using 1-second bins in cleaned event files. If a bin has >2000 counts, and if more than 50% of those come from <1% of pixels, then it is considered to be noise-dominated and hence unusable.
| Quadrant | # 1 sec bins | Bins with >0 counts | Bins with >2000 counts | High rate bins dominated by noise | Noise dominated (total time) | Noise dominated (detector-on time) | Marked lightcurve |
|---|---|---|---|---|---|---|---|
| A | 7652 | 6488 | 0 | 0 | 0.00% | 0.00% | 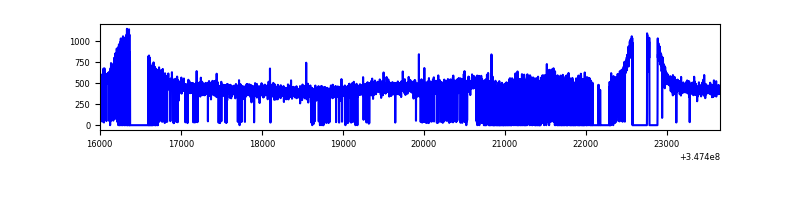 |
| B | 7651 | 6488 | 145 | 145 | 1.90% | 2.23% | 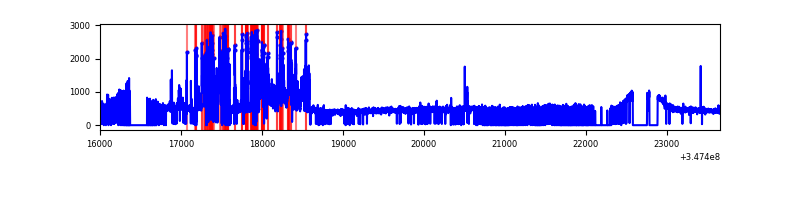 |
| C | 7651 | 6527 | 0 | 0 | 0.00% | 0.00% | 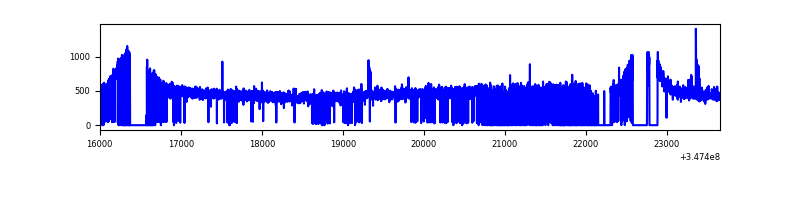 |
| D | 7652 | 5605 | 1195 | 1195 | 15.62% | 21.32% | 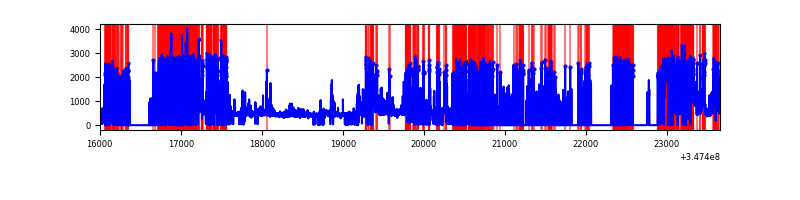 |
Top three noisy pixels from each quadrant. If the there are fewer than three noisy pixels in the level2.evt file, extra rows are filled as -1
| Pixel properties | Quadrant properties | ||||||
|---|---|---|---|---|---|---|---|
| Quadrant | DetID | PixID | Counts | Sigma | Mean | Median | Sigma |
| A | 13 | 254 | 9107 | 55.75 | 737 | 720 | 150.4 |
| A | 3 | 137 | 7653 | 46.09 | 737 | 720 | 150.4 |
| A | 0 | 226 | 6280 | 36.96 | 737 | 720 | 150.4 |
| B | 10 | 245 | 1016899 | 7197.99 | 720 | 702 | 141.2 |
| B | 12 | 111 | 17958 | 122.23 | 720 | 702 | 141.2 |
| B | 11 | 111 | 16305 | 110.52 | 720 | 702 | 141.2 |
| C | 14 | 238 | 113456 | 657.29 | 715 | 718 | 171.5 |
| C | 7 | 247 | 18264 | 102.3 | 715 | 718 | 171.5 |
| C | 8 | 128 | 10600 | 57.61 | 715 | 718 | 171.5 |
| D | 1 | 52 | 3780728 | 29396.65 | 529 | 511 | 128.6 |
| D | 8 | 195 | 232010 | 1800.24 | 529 | 511 | 128.6 |
| D | 12 | 233 | 112985 | 874.65 | 529 | 511 | 128.6 |
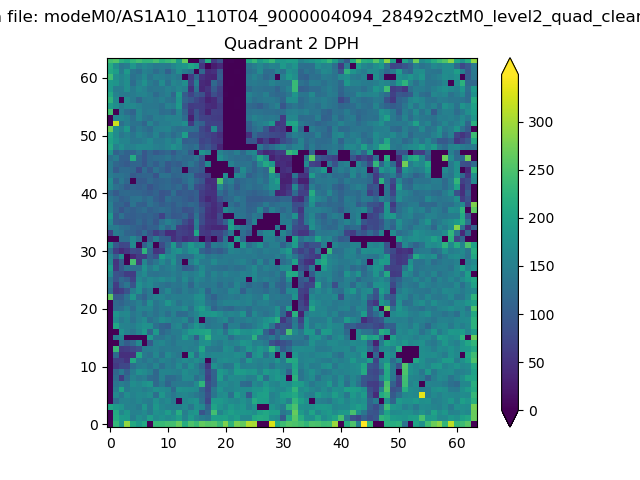
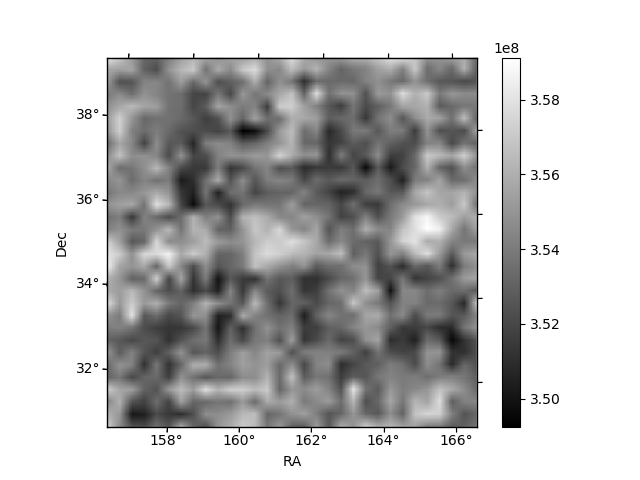
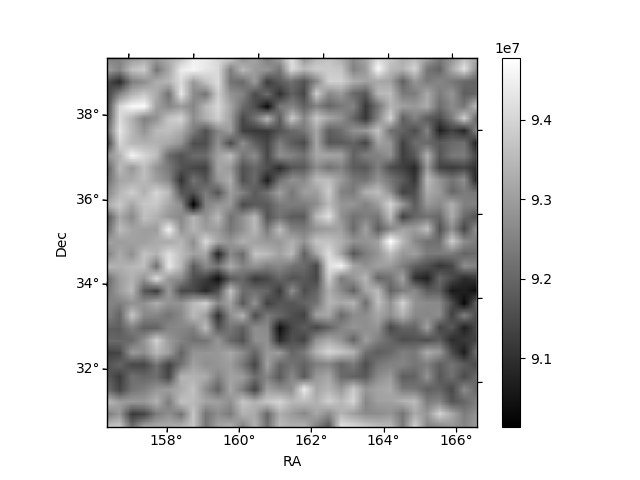
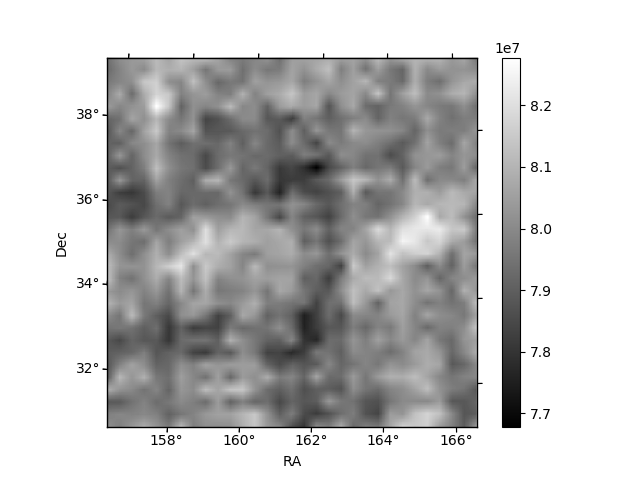
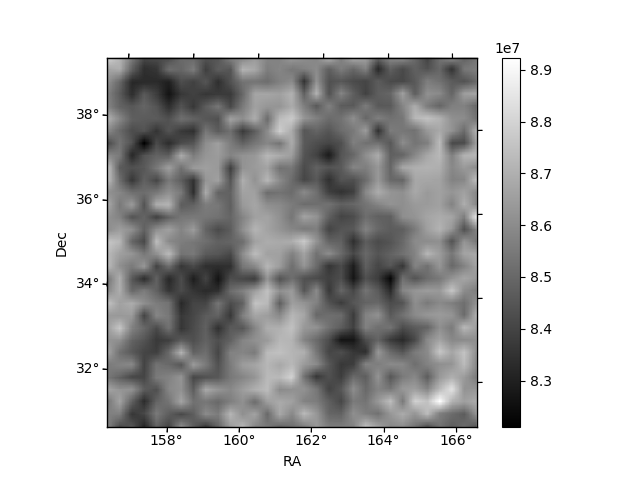
Histogram calculated using DETX and DETY for each event in the final _common_clean file
| Quadrant A | 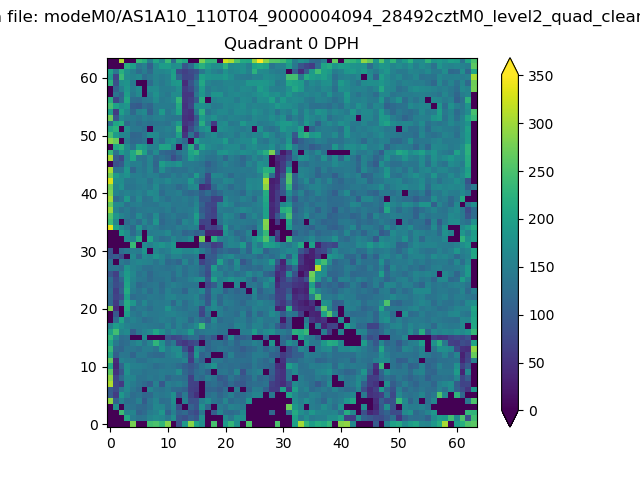 |
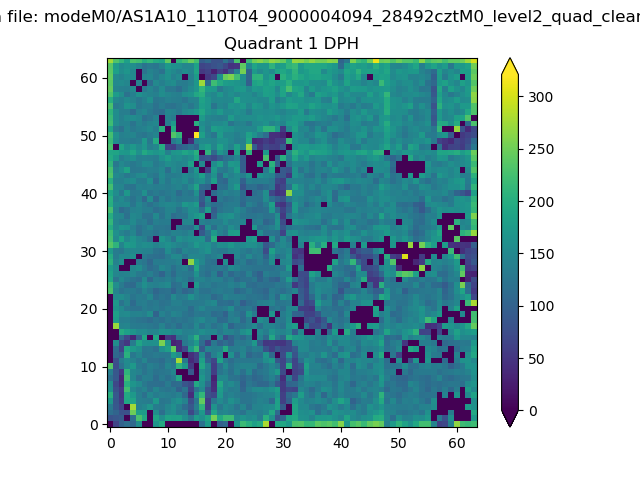 |
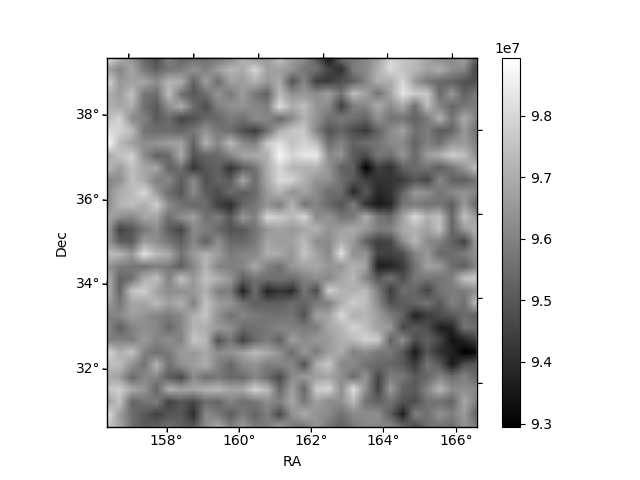
Quadrant B |
|---|---|---|---|
| Quadrant D | 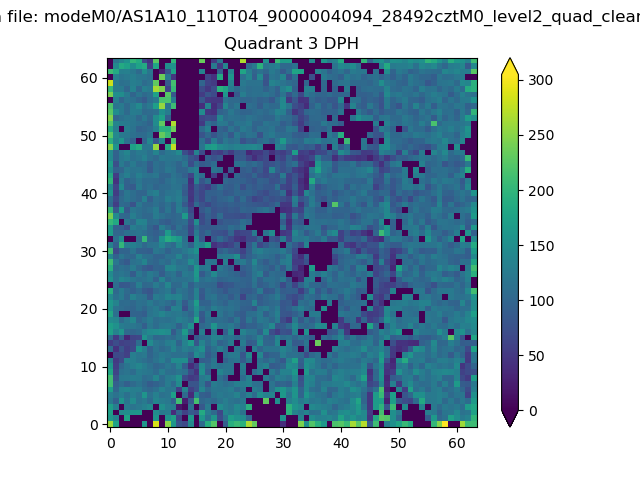 |
 |
Quadrant C |
| Plot type | Count rate plots | Images |
|---|---|---|
| Comparison with Poisson distribution Blue bars denote a histogram of data divided into 1 sec bins. Red curve is a Poisson curve with rate = median count rate of data. |
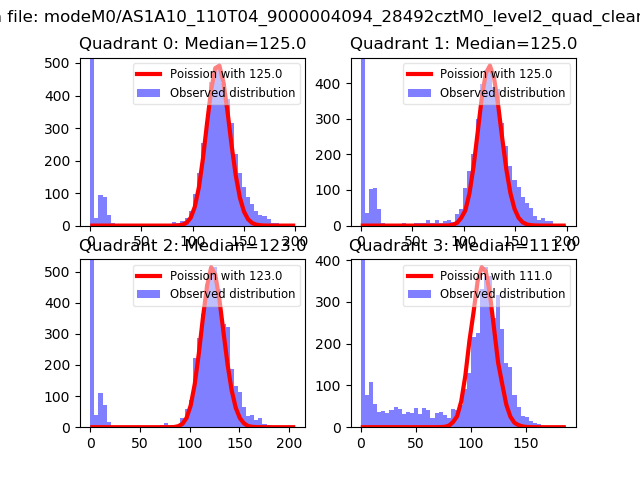 |
 |
| Quadrant-wise count rates Data is divided into 100 sec bins |
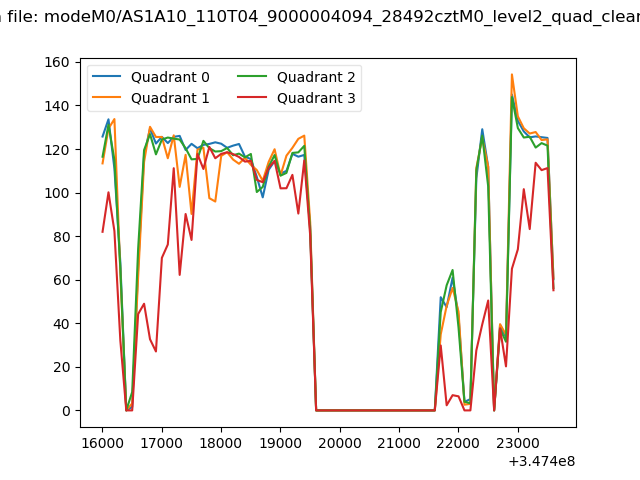 |
|
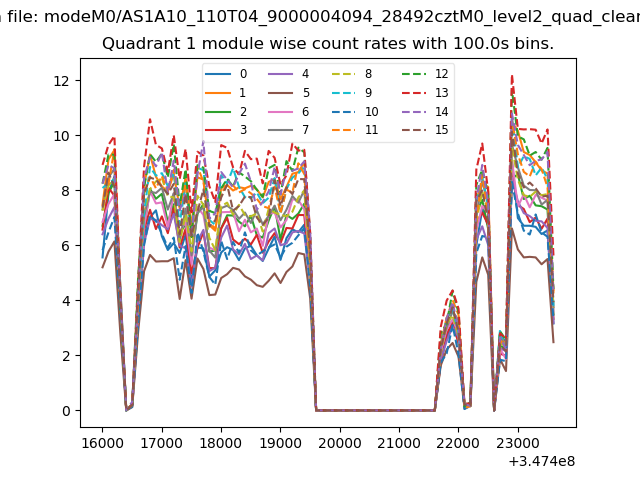
| Module-wise count rates for Quadrant A Data is divided into 100 sec bins |
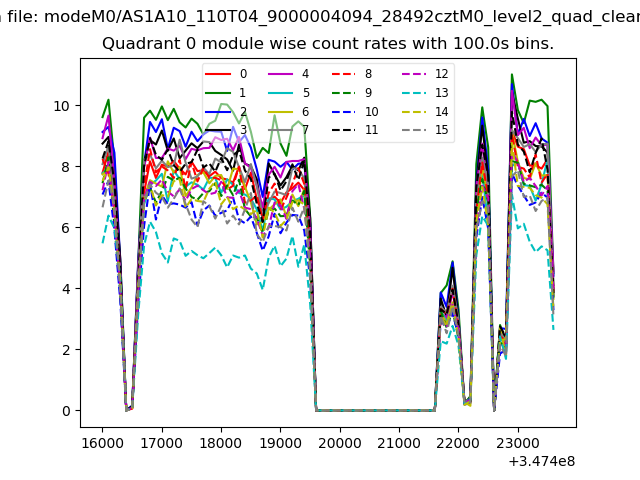 |
 |
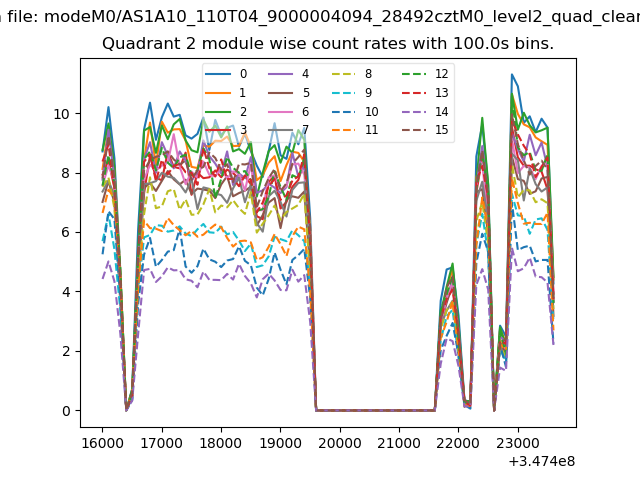
| Module-wise count rates for Quadrant B Data is divided into 100 sec bins |
 |
 |
| Module-wise count rates for Quadrant C Data is divided into 100 sec bins |
 |
 |
| Module-wise count rates for Quadrant D Data is divided into 100 sec bins |
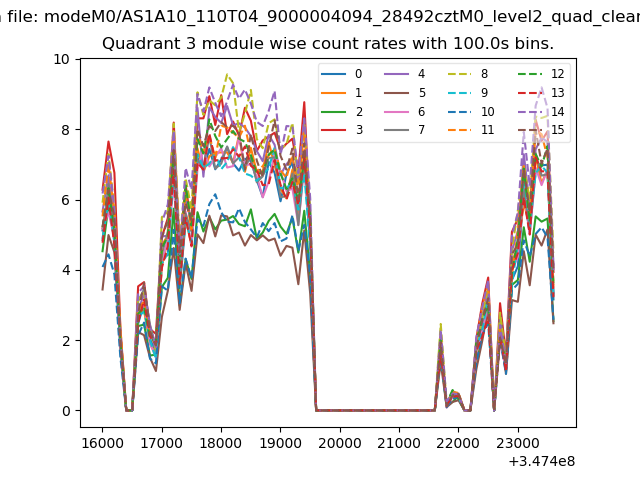 |
 |
| Parameter | Plot |
|---|---|
| CZT HV Monitor | 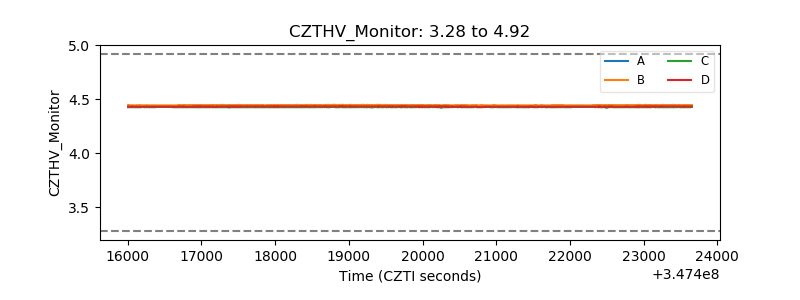 |
| D_VDD | 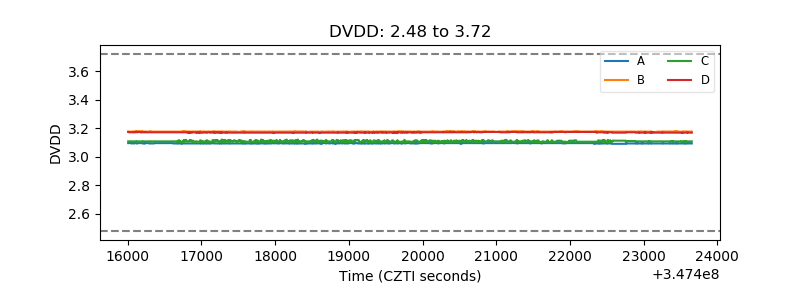 |
| Temperature 1 | 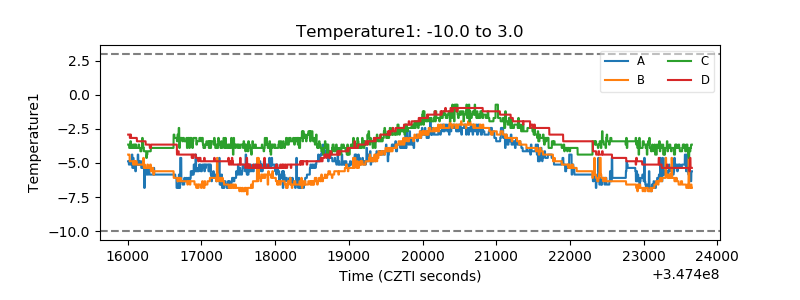 |
| Veto HV Monitor | 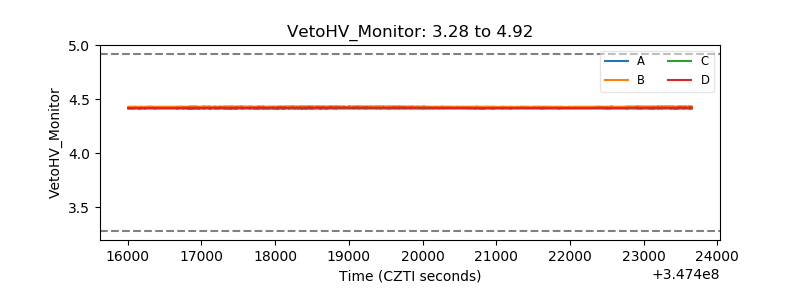 |
| Veto LLD | 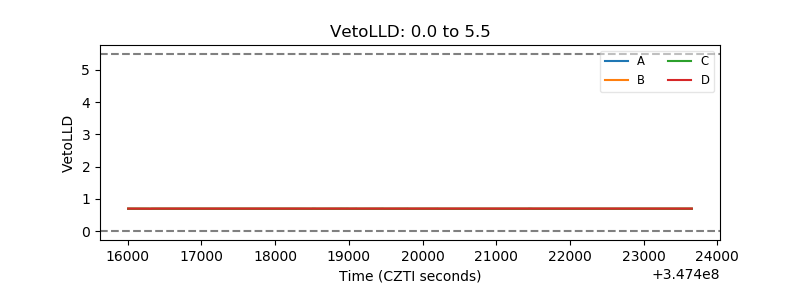 |
| Alpha Counter | 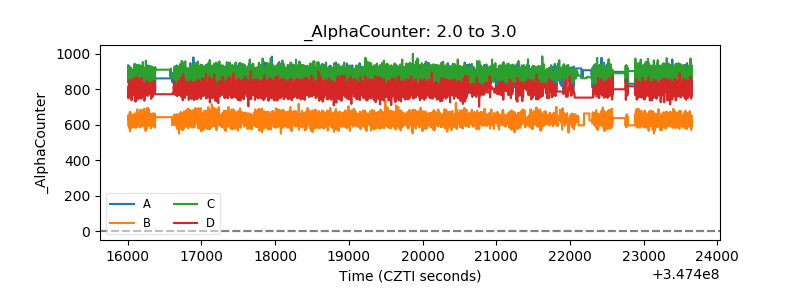 |
| _CPM_Rate | 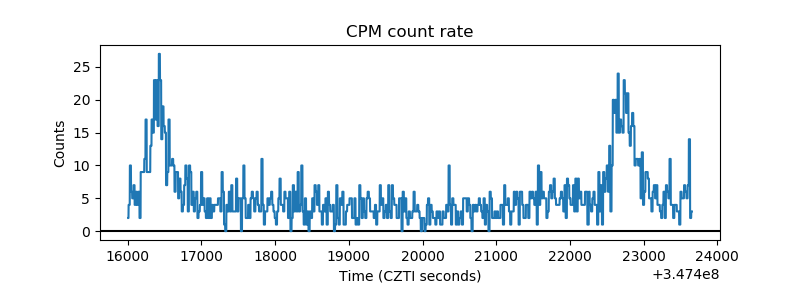 |
| CZT Counter | 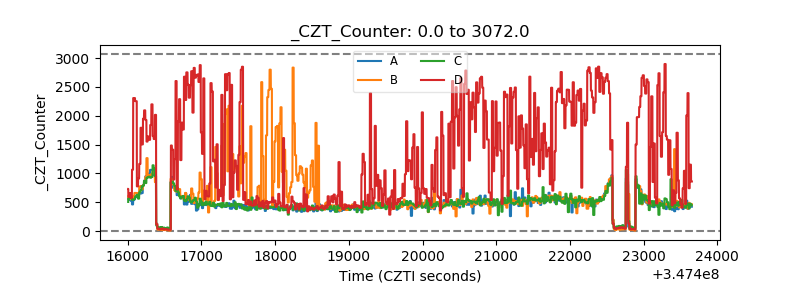 |
| +2.5 Volts monitor |  |
| +5 Volts monitor |  |
| _ROLL_ROT | 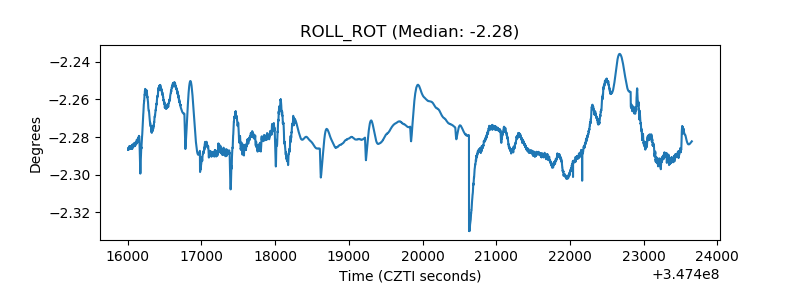 |
| _Roll_DEC | 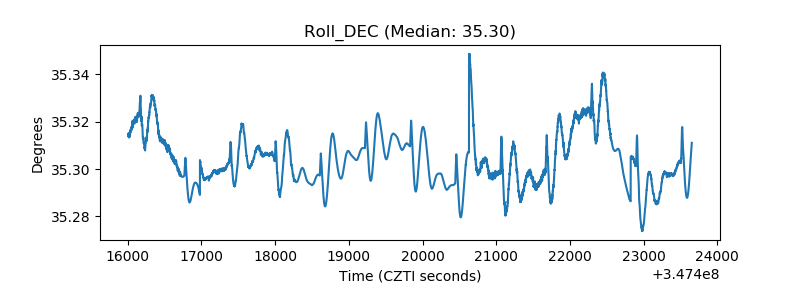 |
| _Roll_RA | 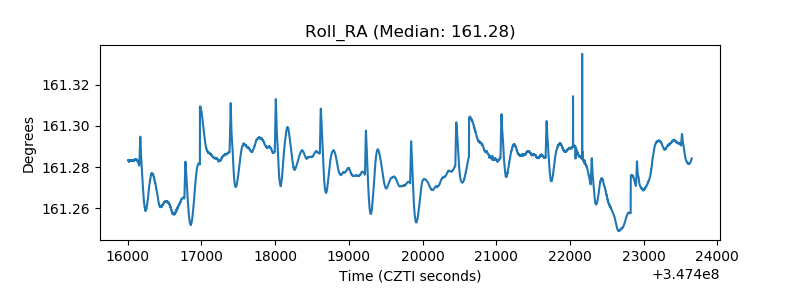 |
| Veto Counter | 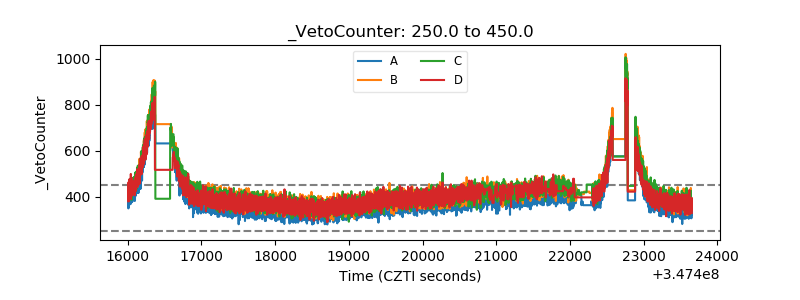 |